Please cite this article as: M. S. Fallahnezhad, V. Golbafian,Determining the Sample Size for Estimation of the CCC-R Control Chart Parameters Based on Estimation Costs, International Journal of Engineering (IJE), TRANSACTIONS B: Applications Vol. 30, No. 2, (February 2017) 253-260
International Journal of Engineering
J o u r n a l H o m e p a g e : w w w . i j e . i rDetermining the Sample Size for Estimation of the
CCC-R Control Chart Parameters
Based on Estimation Costs
M. S. Fallahnezhad*, V. Golbafian
Department of Industrial Engineering, Yazd University, Yazd, Iran.
P A P E R I N F O
Paper history:
Received 26 January 2016
Received in revised form 23 January 2017 Accepted 31 January 2017
Keywords:
Statistical Process Control High Yield Process
Cumulative Count Conforming-rarely Control Charts
Parameter Estimation Average Number Inspected Estimation Costs
A B S T R A C T
In today's highly competitive industrial environment due to fast technology development, quality practitioners will have to detect out-of-control situations and take actions whenever is necessary as soon as possible. Accordingly, new statistical procedures have been enhanced incessantly both to handle high yield processes along with looking for methods of minimizing all quality cost. CCC-r (Cumulative Count Conforming-rarely) chart, the extended method of CCC charts, is commonly applied when nonconforming items are rarely observed. Since the values of the parameters used for the design of the charts' control parameters are usually unknown in practice, the practitioners need to estimate them by using an in-control retrospective sample. It has been shown that parameter estimation affects the control charts' properties severely. This study develops a model based on estimation costs and Average Number of Inspected Items for CCC-r chart when nonconforming fraction is unknown. The unknown parameters estimated based on different values of sample sizes and sensitivity analysis was performed.
doi: 10.5829/idosi.ije.2017.30.02b.12
1. INTRODUCTION1
As one of the basic Statistical Process Control (SPC) tools, control chart has an important role to maintain process stability. Quality practitioners use control charts to draw conclusions about the state of the process and monitor performance to retain control situation in the production process.
The control chart conclusions depended on whether the applied monitoring approach is a phase I or phase II method. In phase I, historical data of the process is analyzed to understand the variation of the process over time, to evaluate the process stability, and to estimate the in-control parameters. In phase II, the process is monitored in real-time to quickly detect shifts from the baseline established in phase I [1]. As highlighted by Szarka and Woodall [2], the sampled items in high yield processes are often represented by a Bernoulli process; that is, the items are independently classified as
1*Corresponding Author’s Email: [email protected] (M. S. Fallahnezhad)
conforming or nonconforming. In addition, Szarka and Woodall [2] stated that the in-control value of p, p0, is
studied variable control charts with estimated parameters. Yang et al. [8] and Chakraborti and Human [9] reported the effects of parameter estimation on attribute control charts. Jensen et al. [10] analyzed the effect of parameter estimation on control charts and concluded that the effect of parameter estimation on control chart properties should not be ignored. Shepherd et al. [11] presented a comparison of the in-control ARL (average run length) properties of the attribute chart for Markov-dependent data with known and estimated parameters. Lee and Lee [12] evaluated the performance of Shewhart chart with estimated parameters in terms of the average of median run length (AMRL) and the standard deviation of MRL (SDMRL) metrics. Since the run length distribution is skewed when the process is either in-control or out-of-control, the median run length (MRL) can be used as alternative measure instead of the ARL. Saleh et al. [13] studied the effect of the phase I estimation error on the cumulative sum (CUSUM) chart.
They designed the CUSUM chart by adjusting the control limits using a bootstrap-based design technique. To reduce the effect of estimation error on the chart's performance
However, accurate parameter estimation for high yield processes is very difficult and may require a larger sample size than that available in practice.
High-quality or high-yield processes refer to those production or processes which are capable of producing defective items rarely and have a very low nonconforming proportion. In these states, traditional statistical process control tools had been found inadequate to provide the obligatory decision support mechanisms to evaluate the process. Bersimis et al. [14] expressed that this is because of the rules used in these charts. So, if a small or moderate shift occurs in these processes, then the out-of-control fraction of non-conforming items will still be very small, and as a consequence, it is highly probable that no defective items will be observed in the inspected sample. Therefore, for small or moderate shifts in nonconforming fraction, standard p or np charts are incapable to diagnose a change in a high quality process because there are a small number of nonconforming items, and usually a high number of conforming items are detected before a nonconforming one.
Due to the properties of zero defect processes, the high yield control chart, also known as the Cumulative Conformance Count (CCC) chart or Geometric chart, has gained wide application in the industry. This chart first introduced by Calvin [15], counts the number of conforming items produced between successive nonconforming ones. It has been known for its ability to detect improvements in high yield production processes while overcoming the problem of possible false alarms experienced by the Shewhart chart when a defective item rarely occurs. Zhang et al. [16] suggested an improved technique for high-quality processes under
group inspection and concept of control charts for high-quality process under sampling inspection. Chen et al. [7] offered a CCC control chart with variable sampling intervals and control limits. Their numerical comparisons showed that the performance of the CCC control chart could be improved by some modifications. In recent years, attention to rising sensitivity of control charts considerably increased because of technology improvements. An alternative strategy to enhance sensitivity is to monitor the cumulative count of items produced until a fixed number ''r'' of nonconforming items are observed. This chart is called CCC-r control chart and it has better performance in finding the shifts of the non-conforming proportion in high-quality processes. The idea of CCC-r control chart has been proposed by Xie et al. [17] and further discussed by Sun and Zhang [18]. The cumulative count of conforming items will follow the Negative Binomial distribution, which is a generalization of the Geometric distribution.
An efficient implementation of a control chart requires the optimal selection of its design parameters, the appropriate sample size, sampling frequency, and control limits. They can be selected according to an economic-statistical objective before applying the classical control methods so that minimum cost in production cycle is obtained.
Several methods are proposed for the economic design of control charts. Duncan [24] was the first to present a mathematical model for the design of control charts achieving a pure economic objective function based on the minimization of a total cost per hour. Yilmaz and Burnak [25] discussed about importance of cost consideration. Furthermore, they explained that any activities in production and quality control should be put into the context of cost saving. In most researches only one objective function named cost function is minimized subject to statistical constraints which is not an effective method for economic-statistical design of control charts. Moghaddam et al. [26] generalized a multi objective model for designing CCC control chart where optimal values of sampling interval and the lower control limit are obtained such that cost function as well as out of control average run length are minimized, while in-control average run length is considered as a statistical constraint.
Nowadays, in using control chart, economic factors must be taken into account to achieve optimum level for designing the charts. From the economic view, all quality costs such as those related to sampling, testing, investigating out of control signals, eliminating special cases, and rectifying the process are influenced by process parameters.
With respect to the literature review, it is important to consider control costs in determining chart parameters so that control chart could be operating in an optimum condition and production process costs is minimized specifically in high quality production.
Since reaching to a defective need to investigating many samples in high quality processes and it leads to additional time and cost, so it’s been tried to estimate non-conforming fraction in a way such that inspection’s cost would be in the minimum value in this research.
In addition, there is an error in estimating non-conforming fraction of the process, and this causes additional cost. The Average Number of Inspected items is used as performance measure in order to analyze the accuracy of estimation. Therefore, with considering formulation of CCC-r control chart, the purpose of this study is to estimate parameters by considering estimation related costs, which have not been addressed in previous studies. At first, the probability distribution of estimators is developed and then the Upper control limit and Lower control limit of the CCC-r chart are calculated based on estimation of non-conforming fraction. Then, a cost scheme is designed by considering investigation cost of samples and estimation error cost
based on Average Number of Inspected items. In this scheme, the needed sample size to estimate the non-conforming fraction is obtained when the objective function is in its optimum value.
This paper is organized as fallows. Firstly, the formulations of CCC-r control chart will be reviewed, and estimation of non-conforming fraction is discussed. Secondly, a cost scheme to obtain the optimum sample size is explained. Then, a numerical example and sensitivity analysis of the model will be given in section four. At last, the conclusion is presented.
2. REVIEW OF CCC-r CONTROL CHART
The idea of CCC chart can be extended for process monitoring by considering the number of items inspected until a fixed number of nonconforming items are observed. This control chart is called the cumulative count of conforming chart (CCC-r chart). In a CCC-r
chart, the number of items until the detection of rth
nonconforming item (x) is plotted to monitor the nonconforming fraction of the process, 𝑝0. If the value
𝑝0∈ (0.1)is known, x is a random variable of negative binomial distribution. The probability mass function (pmf) and the cumulative distribution function (cdf) are presented by Xie et al. [27] as follows:
𝑓𝑟.𝑝0(𝑥) = ( 𝑥−1
𝑟−1)(1 − 𝑝0)𝑥−𝑟𝑝0𝑟 ; 𝑓𝑜𝑟 𝑥 = 𝑟. 𝑟 + 1. … (1)
𝐹𝑟.𝑝0(𝑛) = 𝑝(𝑥 ≤ 𝑛) =
∑𝑛 (𝑟−1𝑖−1)
𝑖=𝑟 (1 − 𝑝0)𝑖−𝑟𝑝0𝑟 ; 𝑓𝑜𝑟 𝑛 = 𝑟. 𝑟 + 1. …
(2)
when r is equal to one (the case of CCC chart) then the distribution reduces to geometric probability distribution.
For an acceptable risk of false alarm, 𝛼, Xie et al. [28] explained thatthe upper control limit, UCLand the lower control limit, LCL of the CCC-r chart could be obtained as the solutions of the following equations: 𝐹(𝑈𝐶𝐿 − 1. 𝑟. 𝑝0) = ∑𝑈𝐶𝐿−1𝑖=𝑟 (𝑟−1𝑖−1)𝑝0𝑟= 1 −
𝛼
2 (3)
And:
𝐹(𝐿𝐶𝐿. 𝑟. 𝑝0) = ∑𝐿𝐶𝐿𝑖=𝑟(𝑟−1𝑖−1)𝑝0𝑟(1 − 𝑝0)𝑖−𝑟= 𝛼
2
(4)
While the centerline, CL, is given as the solution of following equation
𝐹(𝐶𝐿. 𝑟. 𝑝0) = ∑𝐶𝐿𝑖=𝑟(𝑟−1𝑖−1)𝑝0𝑟(1 − 𝑝0)𝑖−𝑟=12 (5)
As is clear from the above equations, the control limits of the CCC-r chart increase when process fraction nonconforming, 𝑝0, approaches zero. The control limits of the CCC-r charts with a large r, are much larger than that small r for the same value of 𝑝0 level. The probability of not observing any signal in two-sided
𝛽(𝑝0) = 𝑝(𝐿𝐶𝐿 < 𝑥 < 𝑈𝐶𝐿 |𝑝0) =
∑𝑈𝐶𝐿−1𝑖=𝐿𝐶𝐿+1(𝑟−1𝑖−1)𝑝0𝑟(1 − 𝑝0)𝑖−𝑟
(6)
Average run length (ARL), which represents the average number of samples taken until the occurrence of one signal can be calculated:
𝐴𝑅𝐿 = 1
1−𝛽(𝑝0)=
1
1− ∑𝑈𝐶𝐿−1𝑖=𝐿𝐶𝐿+1(𝑟−1𝑖−1)𝑝0𝑟(1−𝑝0)𝑖−𝑟
(7)
It is obvious that ARL is the mean value of Geometric distribution with success probability of 1 − 𝛽(𝑝0). In addition to that, the average number of items inspected (ANI) is a different performance measure of control charts. Moreover, we can emphasize that ANI is more informative than ARL in high quality processes because the ANI counts the number of items inspected whereas the ARL does not. ANI can be determined as:
𝐴𝑁𝐼 = 𝑟
𝑝0𝐴𝑅𝐿 = 𝑟
𝑝0∗
1
1− ∑𝑈𝐶𝐿−1𝑖=𝐿𝐶𝐿+1(𝑖−1𝑟−1)𝑝0𝑟(1−𝑝0)𝑖−𝑟
(8)
where 𝑟
𝑝0 is equal to the expected number of sample size
in each stage that correspond to the mean value of negative binomial distribution.
2. 1. CCC-r Chart with Estimated Parameters The control limits of the traditional CCC-r chart in Equation (3) and (4) are based on assumption that the in control non-conforming fraction, 𝑝0 ,is known.
If the value of 𝑝0 is unknown, then we must estimate it by using initial sampling in the Phase I of quality control plan. Assume that M items are inspected and L
items are found to be non-conforming. If x is defined as the nonconformity proportion the posterior probability of random variable x, is obtained as following:
𝑓(𝑥|𝑀. 𝐿) =𝑔(𝑀.𝐿|𝑥)𝑓(𝑥)
𝑔(𝑀.𝐿) =
𝑔(𝑀.𝐿|𝑥)𝑓(𝑥)
∫ 𝑔(𝑀.𝐿|𝑧)𝑓(𝑧)𝑑𝑧01 =
(𝑀𝐿)𝑥𝐿(1−𝑥)𝑀−𝐿
(𝑀𝐿)𝑧𝐿(1−𝑧)𝑀−𝐿=
(𝑀𝐿)𝑥𝐿(1−𝑥)𝑀−𝐿
(𝑀 𝐿) Γ(𝐿+1)Γ(𝑀−𝐿+1) Γ(𝑀+2) = (𝑀+1)! 𝐿!(𝑀−𝐿)!𝑥
𝐿(1 − 𝑥)𝑀−𝐿
(9)
Thus, the value of nonconforming fraction can be estimated as following,
𝑝̂ = ∫ 𝑥. 𝑓(𝑥|𝑀. 𝐿) 𝑑𝑥 =0 𝑀+2𝐿+1 (10)
when the value of 𝑝0 is unknown, then we apply 𝑝̂0 as an estimator, where L is the number of nonconforming items among M items sampled and L is a binomial random variable with parameters M and 𝑝0. Consequently, by applying an estimation for 𝑝0,control limits of CCC-r chart will change. The estimated control limits for two-sided CCC-r chart are obtained as:
∑𝑈𝐶𝐿−1̂ (𝑟−1𝑖−1)(𝑀+2𝐿+1)𝑟
𝑖=𝑟 (1 − (
𝐿+1
𝑀+2))
𝑖−𝑟
= 1 −𝛼2 (11)
∑ (𝑟−1𝑖−1)(𝐿+1
𝑀+2)
𝑟
𝐿𝐶𝐿̂
𝑖=𝑟 (1 − (
𝐿+1
𝑀+2))
𝑖−𝑟
=𝛼
2
(12)
𝑈𝐶𝐿
̂ is upper control limit when the value of
nonconforming fraction is unknown and 𝐿𝐶𝐿̂ is lower control limit.
Since the estimated parameter is utilized to design economic CCC-r chart based on ANI which is used as performance measure, thus first probability of not observing any signal on the chart when non-conforming fraction has been estimated must be briefly explained. Since 𝑝̂0 is estimated by
𝐿+1
𝑀+2, thus 𝛽(𝑝0) is a function of a total items sampled M and the number of non-conforming items L. The properties of CCC-r control chart were derived conditionally on the estimated value 𝑝̂0. If x was defined as the number of inspected items until, the detection of rth nonconforming item then
𝛽(𝑝0) can be written as:
𝛽(𝑝0. 𝑀|𝐿) = 𝑝(𝐿𝐶𝐿̂ < 𝑥 < 𝑈𝐶𝐿̂ |𝐿) =
(∑𝑖=𝐿𝐶𝐿𝑈𝐶𝐿−1̂̂ (𝑟−1𝑖−1) 𝑝̂0𝑟(1 − 𝑝̂ )0 𝑖−𝑟|𝐿)
(13)
Equation (13) is equal to the conditional probability of not observing any signal in the case of an unknown parameter 𝑝0 which is conditioned on a value of the random variable L. The expected value of conditional probability in Equation (13) by considering binomial distribution of L can be stated as:
𝐸(𝛽(𝑝0. 𝑀|𝐿)) =
{ 0 𝑖𝑓 𝐿 = 0 𝑜𝑟 𝐿 = 𝑀 ∑𝑀 𝑝(𝐿𝐶𝐿̂ < 𝑥 < 𝑈𝐶𝐿̂ |𝐿 = 𝑙) ∗ 𝑝(𝐿 = 𝑙)
𝑙=0
= { 0 𝑖𝑓 𝐿 = 0 𝑜𝑟 𝐿 = 𝑀
∑𝑀𝑙=0(∑𝑖=𝐿𝐶𝐿+1𝑈𝐶𝐿−1̂̂(𝑖−1𝑟−1) 𝑝̂0𝑟(1 − 𝑝̂ )0 𝑖−𝑟∗ (𝑀𝑙)𝑝0𝑙. (1 − 𝑝0)𝑀−𝑙)
(14)
The expected value of probability of not observing any signal on the chart is denoted by 𝐸(𝛽(𝑝0. 𝑀|𝐿)) when non-conforming fraction is estimated. As expressed before and considering an unknown non-conforming fraction, it can be demonstrated that 𝐴𝑁𝐼̂ is equal to expected number of items inspected in each sampling stage (𝐸 (𝑟
𝑝̂0)) multiplied by expected number of sampling stages or 𝐴𝑅𝐿 (𝐴𝑅𝐿̂ = 1
1− 𝐸(𝛽(𝑝0.𝑀|𝐿)) )
. 𝐸 (𝑟
𝑝̂0) is
obtained as following: 𝐸 (𝑟
𝑝̂0) = ∑ 𝐸 ( 𝑟
𝑝̂0|𝐿 = 𝑙) ∗ 𝑝(𝐿 = 𝑙) 𝑀
𝑙=0 = ∑
𝑟 𝑙+1 𝑀+2 𝑀
𝑙=0 ∗
(𝑀𝑙). 𝑝0𝑙. (1 − 𝑝0)𝑀−𝑙
(15)
Thus: 𝐴𝑁𝐼̂ = 𝐸 (𝑝𝑟
0
̂) ∗ 𝐴𝑅𝐿 = ∑
𝑟 𝑙+1 𝑀+2 𝑀
𝑙=0 (𝑀𝑙). 𝑝0𝑙. (1 −
𝑝0)𝑀−𝑙∗ 1
1− 𝐸(𝛽(𝑝0.𝑀|𝐿))
(16)
formulations of a cost scheme for determining the optimal value of M is explained in the next section.
3. AN AOOROCH TO OBTAIN REQUIRED SAMPLE SIZE IN PARAMETER ESTIMATION
As mentioned in introduction section, a large sample size is needed in order to estimate unknown parameters in high quality related control charts. This large sample is leading to high estimation costs which has not been studied in previous studies, and consequently in this research a new cost function is introduced which could estimate parameters at the least level of cost.
The proposed model is made up two different parts. One part is for estimation error of non-conforming fraction and the other is for the size of investigated samples. The cost parameters of the model are as following:
1- The cost 𝐶𝑒𝑠𝑡 is required to consider the estimation error: Since average number of inspected items will be used to examine chart performance, thus its estimation error should be considered with a particular cost. The cost of estimation error is multiplied with error term (𝐴𝑁𝐼̂ − 𝐴𝑁𝐼𝑝0) where 𝐴𝑁𝐼̂ is the
estimated value, which is used in proposed control chart. 𝐴𝑁𝐼𝑝0 is true value of ANI and is calculated
based on 𝛽(𝑝0) in Equation (8).
2- The cost 𝐶𝑖𝑛𝑣 is required to consider the cost of inspection in the investigated sample: It is needed to inspect M items to find L which is the number of nonconforming items for estimating the value of 𝑝0. Therefore, the cost to inspect all M items should be considered.
Subsequently, total cost function based on the average number of inspected items as the performance measure of CCC-r control chart is as following:
𝑇𝐶 = 𝐶𝑒𝑠𝑡(𝐴𝑁𝐼̂ − 𝐴𝑁𝐼𝑝0) + 𝑀𝐶𝑖𝑛𝑣 (17)
To illustrate the proposed cost function, some numerical examples are solved in next section.
4. PERFORMANCE STUDY
When the sample of size M will be in optimum value, then the total cost approaches its minimum value. With this presumption, the sample size M is assumed as decision variable in this paper to reach the minimum cost in the process. A grid search procedure written in Visual Basic is used to determine the optimal value of decision variable in proposed approach. The optimal value of M, which is experimented in a fixed range of 5 to 120 is obtained by considering a specified value for the acceptable risk of false alarm to determine control limits, 𝐶𝑖𝑛𝑣 and 𝐶𝑒𝑠𝑡 as fixed costs. The fixed
parameters are stated in Table 1. For all values of M in each experiment, the following steps are repeated.
Firstly, the estimation of non-conforming fraction and chart control limits are calculated. Then, the values of 𝐴𝑁𝐼̂ and 𝐴𝑁𝐼𝑝0are evaluated based on real values of
control chart parameters and estimation parameters. Finally, the total cost function is obtained according to fixed costs. Finally, the minimum total cost is achieved by comparing all values of total cost functions in each iteration.
When the non-conforming fraction is estimated precisely, the estimation error statement would be minimum value and estimation of nonconforming fraction will be closer to its real value.
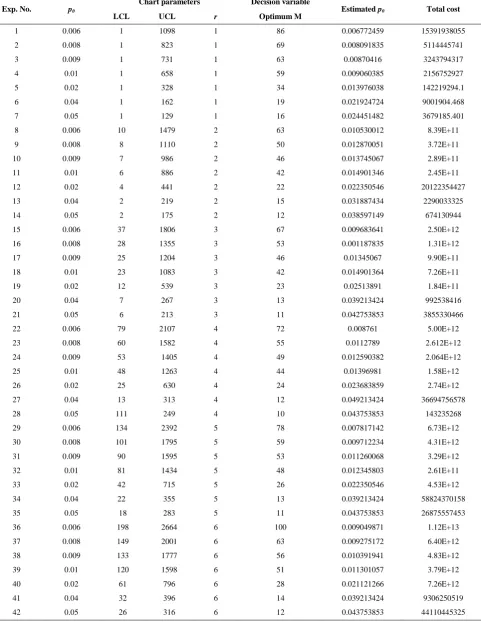
4. 1. Sensitivity Analysis According to Table 1 and specified fixed range of M, we survey on optimal condition for different values of p0 and r so that the
parameters in each experiment would be changed separately. Table 2 can be used to analyze the sensitivity of the model to the variation of various parameters. In this table, six different values are considered for r. For each value of r, different values of nonconforming fractions are experimented when acceptable risk of false alarm is constant.
As shown in Table 2, when r is fixed by increasing the value of 𝑝0, the value of M decreases; thus, a lower value of sample size is needed for larger value of 𝑝0. Also, in this condition, the value of cost function decreases by increasing the value of 𝑝0. By variations of
r when the value of 𝑝0 is fixed, increasing the value of r leads to the reduction of M and cost function value. Also in this case, the value of 𝑝̂0 is closer to true nonconforming fraction when r is lower. Similarly, it can be seen that estimated values are more precise for larger values of nonconformity fraction.
5. CONCLUSION
In this paper, detailed description of CCC-r control chart, which is a suitable type of control chart for high yield processes, was studied. The properties of a two-sided control chart with unknown non-conforming fraction were investigated. The probability of non-conforming estimators was developed based on sample size and negative binomial sampling scheme. It was denoted that the estimated values affected the upper and lower control limits.
TABLE 1. Fixed parameters
Parameter Value
Fixed costs 𝐶𝑒𝑠𝑡 100
𝐶𝑖𝑛𝑣 5
TABLE 2. Parameter estimation in different experiments
Exp. No. p0
Chart parameters Decision variable
Estimated p0 Total cost
LCL UCL r Optimum M
1 0.006 1 1098 1 86 0.006772459 15391938055
2 0.008 1 823 1 69 0.008091835 5114445741
3 0.009 1 731 1 63 0.00870416 3243794317
4 0.01 1 658 1 59 0.009060385 2156752927
5 0.02 1 328 1 34 0.013976038 142219294.1
6 0.04 1 162 1 19 0.021924724 9001904.468
7 0.05 1 129 1 16 0.024451482 3679185.401
8 0.006 10 1479 2 63 0.010530012 8.39E+11
9 0.008 8 1110 2 50 0.012870051 3.72E+11
10 0.009 7 986 2 46 0.013745067 2.89E+11
11 0.01 6 886 2 42 0.014901346 2.45E+11
12 0.02 4 441 2 22 0.022350546 20122354427
13 0.04 2 219 2 15 0.031887434 2290033325
14 0.05 2 175 2 12 0.038597149 674130944
15 0.006 37 1806 3 67 0.009683641 2.50E+12
16 0.008 28 1355 3 53 0.001187835 1.31E+12
17 0.009 25 1204 3 46 0.01345067 9.90E+11
18 0.01 23 1083 3 42 0.014901364 7.26E+11
19 0.02 12 539 3 23 0.02513891 1.84E+11
20 0.04 7 267 3 13 0.039213424 992538416
21 0.05 6 213 3 11 0.042753853 3855330466
22 0.006 79 2107 4 72 0.008761 5.00E+12
23 0.008 60 1582 4 55 0.0112789 2.612E+12
24 0.009 53 1405 4 49 0.012590382 2.064E+12
25 0.01 48 1263 4 44 0.01396981 1.58E+12
26 0.02 25 630 4 24 0.023683859 2.74E+12
27 0.04 13 313 4 12 0.049213424 36694756578
28 0.05 111 249 4 10 0.043753853 143235268
29 0.006 134 2392 5 78 0.007817142 6.73E+12
30 0.008 101 1795 5 59 0.009712234 4.31E+12
31 0.009 90 1595 5 53 0.011260068 3.29E+12
32 0.01 81 1434 5 48 0.012345803 2.61E+11
33 0.02 42 715 5 26 0.022350546 4.53E+12
34 0.04 22 355 5 13 0.039213424 58824370158
35 0.05 18 283 5 11 0.043753853 26875557453
36 0.006 198 2664 6 100 0.009049871 1.12E+13
37 0.008 149 2001 6 63 0.009275172 6.40E+12
38 0.009 133 1777 6 56 0.010391941 4.83E+12
39 0.01 120 1598 6 51 0.011301057 3.79E+12
40 0.02 61 796 6 28 0.021121266 7.26E+12
41 0.04 32 396 6 14 0.039213424 9306250519
Since the cost parameters is not taken into account in previous studies for parameter estimation and this could be an important issue in high quality processes because of low defective samples, thus a cost function is developed in this research. We tried to minimize the summation of cost of estimation error and cost of inspecting required samples to estimate unknown parameters. In order to evaluate performance of the estimator, Average Number of Inspected items is used as performance measure in proposed function. Due to the importance of sample size in high quality processes, it is considered as the decision variable in the cost function. The variations of the estimated non-conforming fraction and sample size are studied in various conditions of control chart parameters.
As expected, the results of sensitivity analysis show that cost function increases when nonconforming fraction decreases, so when non-conforming fraction is low, the cost of estimation would be very high. The increasing non-conforming fraction has an inverse effect on optimal value of the sample size as expected. Moreover, for fixed values of non-conforming fraction, the optimal value of sample size decreases as the value of r increases. Therefore, when the value of r increases then the value of optimal sample size decreases which leads to increase the sensitivity of CCC-r control chart.
Further research on this topic may include evaluating the performance of proposed model when different estimators are used. On the other hand, it could be beneficial to apply this proposed estimators and cost function on the performance of all types of control charts when nonconforming fraction is low.
6. REFERENCES
1. Zhang, M., Peng, Y., Schuh, A., Megahed, F.M. and Woodall, W.H., "Geometric charts with estimated control limits", Quality and Reliability Engineering International, Vol. 29, No. 2, (2013), 209-223.
2. Szarka, J.L. and Woodall, W.H., "A review and perspective on surveillance of bernoulli processes", Quality and Reliability Engineering International, Vol. 27, No. 6, (2011), 735-752. 3. Psarakis, S., Vyniou, A.K. and Castagliola, P., "Some recent
developments on the effects of parameter estimation on control charts", Quality and Reliability Engineering International, Vol. 30, No. 8, (2014), 1113-1129.
4. Jones, L.A., Champ, C.W. and Rigdon, S.E., "The run length distribution of the cusum with estimated parameters", Journal of Quality Technology, Vol. 36, No. 1, (2004), 95-102.
5. Chakraborti, S., "Parameter estimation and design considerations in prospective applications of the x chart", Journal of Applied Statistics, Vol. 33, No. 4, (2006), 439-459.
6. Testik, M.C., "Conditional and marginal performance of the poisson cusum control chart with parameter estimation",
International Journal of Production Research, Vol. 45, No. 23, (2007), 5621-5638.
7. Chen, Y.K., Chen, C.Y. and Chiou, K.C., "Cumulative conformance count chart with variable sampling intervals and control limits", Applied Stochastic Models in Business and Industry, Vol. 27, No. 4, (2011), 410-420.
8. Yang, Z., Xie, M., Kuralmani, V. and Tsui, K.-L., "On the performance of geometric chart with estimated control limits",
Journal of Quality Technology, Vol. 34, No. 4, (2002), 448. 9. Chakraborti, S. and Human, S., "Properties and performance of
the c-chart for attributes data", Journal of Applied Statistics, Vol. 35, No. 1, (2008), 89-100.
10. Jensen, W.A., Jones-Farmer, L.A., Champ, C.W. and Woodall, W.H., "Effects of parameter estimation on control chart properties: A literature review", Journal of Quality Technology, Vol. 38, No. 4, (2006), 349.
11. Shepherd, D.K., Champ, C.W. and Rigdon, S.E., "Properties of the markov‐dependent attribute control chart with estimated parameters", Quality and Reliability Engineering International, Vol. 32, No. 2, (2016), 485-498.
12. Lee, Y. and Lee, J., "The effect of parameter estimation x̄ on charts based on the median run length", The Korean Data & Information Science Society, Vol. 27, No. 6, (2016), 1487-1498.
13. Saleh, N.A., Zwetsloot, I.M., Mahmoud, M.A. and Woodall, W.H., "Cusum charts with controlled conditional performance under estimated parameters", Quality Engineering, Vol. 28, No. 4, (2016), 402-415.
14. Bersimis, S., Koutras, M.V. and Maravelakis, P.E., "A compound control chart for monitoring and controlling high quality processes", European Journal of Operational Research, Vol. 233, No. 3, (2014), 595-603.
15. Calvin, T., "Quality control techniques for" zero defects"",
IEEE Transactions on Components, Hybrids, and Manufacturing Technology, Vol. 6, No. 3, (1983), 323-328. 16. Zhang, C., Xie, M. and Goh, T., "On cumulative conforming
type of control charts for high quality processes under sampling inspection", Economic Quality Control, Vol. 20, No. 2, (2005), 205-222.
17. Xie, M., Lu, X., Goh, T. and Chan, L., "A quality monitoring and decision-making scheme for automated production processes", International Journal of Quality & Reliability Management, Vol. 16, No. 2, (1999), 148-157.
18. Sun, J. and Zhang, G., "Control charts based on the number of consecutive conforming items between two successive nonconforming items for the near zero-nonconformity processes", Total Quality Management, Vol. 11, No. 2, (2000), 235-250.
19. Chiu, J.-E. and Tsai, C.-H., "Properties and performance of one-sided cumulative count of conforming chart with parameter estimation in high-quality processes", Journal of Applied Statistics, Vol. 40, No. 11, (2013), 2341-2353.
20. Zhang, M., Nie, G. and He, Z., "Performance of cumulative count of conforming chart of variable sampling intervals with estimated control limits", International Journal of Production Economics, Vol. 150, (2014), 114-124.
21. Lee, P.-H., Torng, C.-C. and Liao, L.-F., "An economic design of combined double sampling and variable sampling interval control chart", International Journal of Production Economics, Vol. 138, No. 1, (2012), 102-106.
22. Tang, L.C. and Cheong, W.T., "Cumulative conformance count chart with sequentially updated parameters", IIE Transactions, Vol. 36, No. 9, (2004), 841-853.
Statistics-Theory and Methods, Vol. 45, No. 14, (2016), 4194-4214.
24. Duncan, A.J., "The economic design of x charts used to maintain current control of a process", Journal of the American Statistical Association, Vol. 51, No. 274, (1956), 228-242. 25. Yılmaz, Ş. and Burnak, N., "An economic approach to the
management of high‐quality processes", Quality and Reliability Engineering International, Vol. 29, No. 5, (2013), 681-690.
26. Moghaddam, A.S., Amiri, A. and Bashiri, M., "Multi-objective economic-statistical design of cumulative count of conforming control chart", International Journal of Engineering-Transactions A: Basics, Vol. 27, No. 10, (2014), 1591-1600. 27. Xie, M., Goh, T.N. and Kuralmani, V., "Statistical models and
control charts for high-quality processes, Springer Science & Business Media, (2012).
Determining the Sample Size for Estimation of the
CCC-R Control Chart Parameters
Based on Estimation Costs
M. S. Fallahnezhad, V. Golbafian
Department of Industrial Engineering, Yazd University, Yazd, Iran.
P A P E R I N F O
Paper history:
Received 26 January 2016
Received in revised form 23 January 2017 Accepted 31 January 2017
Keywords:
Statistical Process Control High Yield Process
Cumulative Count Conforming-rarely Control Charts
Parameter Estimation Average Number Inspected Estimation Costs
ديكچ ه
طیحم رد هدش داجیا یژولونکت عیرس تفرشیپ هطساو هب هک زورما یتباقر رایسب یتعنص یاه تیفیک نیصصختم ،دنا
تیعقوم و ییاسانش هدوب لرتنک زا جراخ هک ار ییاه یم لمع هب مادقا بسانم نامز رد ،زاین تروص رد
هجیتن رد .دننک ،
شور دنیارف هب یگدیسر یارب دیدج یرامآ یاه اب یاه
تیفیک ، شور نتفای یارب نینچمه و هنیزه هک ییاه
هب ار تیفیک یاه
یم لقادح هتفای اقترا هتسویپ تروص هب ،دنناسر یلرتنک رادومن .تسا
CCC-r
هتفای هعسوت تلاح هک یلرتنک رادومن زا یا
CCC
یم رارق هدافتسا دروم ینامز ،تسا هنومن هک دریگ
هدهاشم یمک رایسب بویعم یاه یم
نیا لیلد هب .دوش ریداقم هک
ریداقم نیا دیاب تیفیک نیصصختم ،تسا مولعمان تیعقاو رد یلرتنک رادومن یاهرتماراپ یحارط رد هدافتسا دروم یاهرتماراپ
هنومن ساسا رب ار هدش هداد ناشن .دنیامن دروارب هتشذگ لرتنک تحت یاه
یور رب یدایز ریثات رتماراپ دروارب هک تسا
تایصوصخ هنیزه ساسارب یلدم هعلاطم نیا رد .دراد لرتنک رادومن
نامز رد هدش یسرزاب ملاقا نیگنایم و دروارب یاه
یلرتنک یاهرادومن رد بویعم ملاقا تبسن ندوب مولعمان
CCC-r
هدش هئارا ریداقم ساسارب مولعمان یاهرتماراپ .تسا
روم نیا رد تیساسح لیلحت و هدش دروارب هنومن هزادنا فلتخم یم ماجنا د
.دوش