SIMPLIFICATION OF PARAMETERS IN A COMPLEX
CATCHMENT MODEL: A DAILY RAINFALL DATA
GENERATION PROCESS
E. Khazai
Department of Civil Engineering, Faculty of Engineering, University of Sistan and Baluchestan Zahedan, Iran, [email protected]
(Received: July 7, 2000 – Accepted in Revised Form: March 5, 2001)
Abstract This paper describes the rainfall data generation processes, which were used to simplify
the recharge model developed by Khazai and Spink. The principles of techniques used for single and two sites generation are discussed. The application of the techniques for extending the rainfall records at the existing stations and increasing arbitrarily the numbers of rain gauges within the catchment are presented.
Key Words Rainfall, Data Generation, Markov Model, Fiering Model
ﻩﺪﻴﻜﭼ
ﻩﺪﻴﻜﭼ
ﻩﺪﻴﻜﭼ
ﻩﺪﻴﻜﭼ
ﻂﺳﻮﺗ ﻪﻛ ﻲﻨﻴﻣﺯ ﺮﻳﺯ ﺏﺁ ﻪﻳﺬﻐﺗﻝﺪﻣ ﻦﺘﺧﺎﺳﻩﺩﺎﺳ ﻱﺍﺮﺑﻲﮔﺪﻧﺭﺎﺑ ﻱﺎﻫ ﻩﺩﺍﺩ ﺪﻴﻟﻮﺗ ﺪﻨﻳﺍﺮﻓ ﻪﻟﺎﻘﻣ ﻦﻳﺍ
ﺪﻨﻛﻲﻣﻒﻴﺻﻮﺗﺍﺭﺖﺳﺍ ﻩﺪﺷﻪﺋﺍﺭﺍﻚﻨﻴﭙﺳﺍﻭﻲﻋﺍﺰﺧ
. ﻲﮔﺪﻧﺭﺎﺑﺪﻴﻟﻮﺗﻱﺍﺮﺑﻩﺪﺷﻪﺘﻓﺮﮔﺭﺎﻜﺑﻱﺎﻬﺷﻭﺭﻭﻝﻮﺻﺍ
ﺩﻮﺷﻲﻣﺚﺤﺑﻪﻄﻘﻧﻭﺩﻭﻚﻳﺭﺩ
.
ﺪﻧﺭﺎﺑﻱﺎﻫﻩﺩﺍﺩﺶﻳﺍﺰﻓﺍﻱﺍﺮﺑﺎﻬﺷﻭﺭﺩﺮﺑﺭﺎﻛ
ﻱﺍﺮﺑﻭﺩﻮﺟﻮﻣﻱﺎﻬﻫﺎﮕﺘﺴﻳﺍﺭﺩﻲﮔ
ﺩﺩﺮﮔﻲﻣﻪﺋﺍﺭﺍﺰﻳﺮﺑﺁﻩﺯﻮﺣﻞﺧﺍﺩﺭﺩﻲﺿﺮﻓﻲﺠﻨﺳﻥﺍﺭﺎﺑﻱﺎﻬﻫﺎﮕﺘﺴﻳﺍﺩﺎﻳﺩﺯﺍ
.
INTRODUCTION
Groundwater in arid and semi-arid regions of Iran is often the sole source of water supply. The rapid growth of population and urban development in these regions creates shortages of water. Therefore, efficient groundwater management is necessary. Groundwater modeling is a powerful tool for groundwater management. However, unless the data input to models are reasonably accurate, the application of the model is unlikely to be efficient. Groundwater recharge is an essential input to any type of regional groundwater model. Consequently, having a feasible model for the accurate evaluation of recharge has great value. The catchment water balance model developed by Khazai and Spink [1], recharge model, is for estimating the groundwater recharge in the arid regions. It takes into account the main recharge mechanisms and deals with the spatial variation of the hydrological processes within the catchment. According to Dawdy and O’Donnell [2] for a quantitative model of catchment behavior to be useful, i.e. acceptably accurate, it must inevitably be complex, yet must be feasible to operate. The
operational feasibility of a conceptual model is connected with the number of parameters (Franchini and Pacciani [3]). The difficulty in the calibration phase increases with the number of parameters. On the other hand, over-simplification results in a loss of link with the physics of the problem consequently making the parameters less easy to specify based on the hydrological understanding. Therefore, it is desirable to achieve a balance between simplicity and keeping the parameters physically realistic. The recharge model suffers from the large number of parameters, which have to be estimated. In order to reduce the complexity of the recharge model further investigation was required.
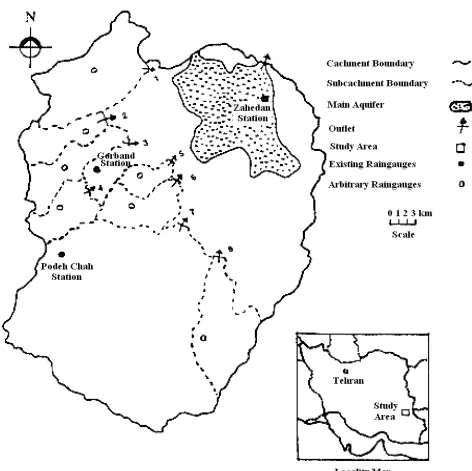
Figure 1. Study area.
arbitrarily. The generated data were then used as an input to the recharge model and the resulted value of recharge (output) is considered as “true” outputs. A sensitivity analysis is then carried out to see how well the resulted of the full model are reproduced when some of the parameters are omitted by comparing the resulted value with the “true” output. Using both an objective function and a visual method makes the comparison of the resulted
value and the “true” value. In this way the possibility of reducing the parameters of recharge model and introducing a version of the model, which is, less demanding in terms of parameters while maintaining the quality of outputs, was examined.
resources. As a result of this investigation the recharge model was simplified and its parameters reduces from 32 to 19 with no significant effect on groundwater recharge.
TECHNIQUES USED FOR DAILY RAINFALL GENERATION
Most of the techniques for generating daily rainfall data consist of two stages (Buishand [5] and Hamlin and Rees [6]). One stage is for rainfall occurrence, which is denoted as the wet and dry process, and the second is for the rainfall amount on wet days. The two stages for generating daily rainfall data are discussed in the following sections.
Modeling Rainfall Occurrence To model the
rainfall occurrence, the first-order Markov model is selected. The reason for this selection is:
a) Gabriel and Neumann [7] found that the first-order Markov model fitted the daily rainfall occurrence data for Tel Aviv, which is an arid region.
b) Buishand [5] found that a first-order Markov process provided a reasonable fit to the rainfall data of New Delhi where there is a long dry season.
c) Jimoh and Webster [8] used the Markov model for daily rainfall occurrence for various climatic conditions in Nigeria. They found that the first-order model is superior to the zero-first-order model in representing the characteristics of historical sequence. In addition they found no discernible difference between the performances of first- and second-order models.
d) There is general agreement that the first-order Markov model is easy to apply (e.g. Buishand [5] and Stern and Coe [9]).
In the first-order Markov model the probability of rainfall on any day depends only on whether the previous day is wet or dry. In this model, based on daily rainfall records, a sequence of 0’s and 1’s denoting the days with no rain and rain respectively, is obtained. The transition probabilities of P11and
P00 for each day of the year are defined as (Jimoh and Webster [8]):
wet being day previous with years of No. day wet previous & y with toda years of No. (t) 11 P = (1) dry day previous with years of No. dry day previous & y with toda years of No. ) t ( P00 =
(2) Where t is equal to 1, 2, 3, ..., 365. The transition probability is then used to generate a sequence of wet and dry days as described by Clarke [10] and Jimoh and Webster [8]. An initial value of zero representing a dry day is assumed. This assumption is not far from the reality because in the area of the study the water year begins on October, first and the probability of rainfall at this time is extremely low. The state of the remaining days is obtained by generating a uniformly distributed random number, Ru(t) in the interval 0 to 1 using the RAND() command in an Excel spreadsheet and considering the following conditions:
for yt-1=0
yt=0 if Ru(t) < P00(t) and yt=1 if Ru(t) ≥ P00(t); for yt-1=1
yt=1 if Ru(t) < P11(t) and yt=0 if Ru(t) ≥ P11(t); In this way a sequence of 0’s and 1’s is obtained. The sequence is then used to generate rainfall amounts. Clearly, whenever a zero occurs, the corresponding rainfall amount is zero, but when a 1 occurs, a way of introducing a value, which represents a rainfall amount, is needed. This is discussed in the next section.
Modeling Rainfall Amount
Rainfall amounts
on wet days are extremely skew and a gamma distribution, or some modification to it, has often been used to model the rainfall amounts (Stern and Coe [9]). To check whether the magnitude of rainfall on wet days in the study area is from a Gamma distribution, the chi-square test was carried out. The results indicated that the gamma distribution can describe the magnitude of rainfall on wet days. This is in agreement with the literature that the rainfall amounts on wet days can be represented by a two parameter gamma distribution (e.g. Buishand [5], Haan [11], Rees and Hamlin [12] and Hamlin and Rees [6]). Thus, this distribution is selected and can be written as (Kottegoda [13]):
) ( ) x exp( x ) x ( f 1 γ Γ λ λ − = γ − γ
which has mean = λγ and variance = λ2γ. Having selected the distribution, then random observations with the same mean and standard deviation as the historic data can be generated. The principles of this generation are clearly explained by Haan [11]. Random observations may be generated from probability distributions by making use of the fact that the cumulative probability function for any continuous variant is uniformly distributed over the interval 0 to 1. Thus for any random variable Y with probability density function PY (y), the variant
P y
Yp x dx
Yy
( )
=
( )
−∞
∫
(4) is uniformly distributed over (0,1).
A procedure, illustrated in Figure 2, for generating a random value y from PY (x) is
a) Select a random number Ru from a uniform distribution in interval (0,1).
b) Set PY (y)= Ru in Equation 4. c) Solve for y.
Step c in this procedure is known as obtaining the inverse transform of the probability distribution. In this study in order to obtain a rainfall amount for a wet day having a gamma distribution with mean and standard deviation equal to the historic rainfall, the following steps were followed:
I. On a wet day, a uniformly distributed random number Ru in the interval of 0 to 1 is obtained as illustrated in Figure 2.
II. Parameters of the Gamma distribution (λ and γ) are obtained using the mean and standard deviation of wet days in the historic data.
III. By having Ru, λ and γ, the inverse of the gamma cumulative distribution is obtained by using the GAMMAINV function in an Excel spreadsheet. The GAMMAINV function returns the inverse of the gamma cumulative distribution. The resulting value is the rainfall amount for a wet day. This procedure is carried out to produce rainfall amount for the remaining wet days. It is obvious that the corresponding rainfall amount is zero whenever a zero occurs. The application of the models for generating rainfall data is discussed in the next section.
DATA GENERATION
Historic rainfall data from Zahedan, Gorband and
Figure 2. Procedure for generating a random observation from a probability distribution (Reproduced from Haan [11]).
Podeh Chah stations are used to generate daily rainfalls in this study. The locations of the stations are shown in Figure 1. The periods of 8, 7 and 4 years of daily rainfalls are available for the Zahedan, Gorband and Podeh Chah stations respectively. The data generation for the whole catchment is carried out in two parts:
a) Based on the available records, rainfall data are generated for a period of 20 years at each of the three stations.
region. It consists of several subcatchments, which conduct the surface runoff to the plain.
Generating Daily Rainfall for Available Stations
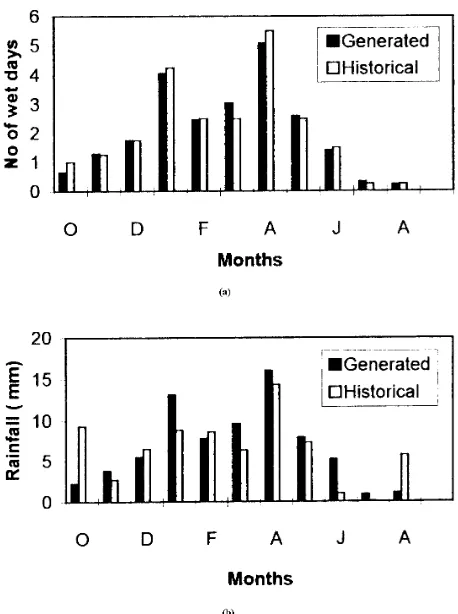
To generate a daily rainfall series, which represents both the occurrence and the magnitude of the historic rainfall at each station, as well as preserving the spatial correlation among the stations, a number of trials, are considered. The most suitable one that is the use of the last 4 years of records at each station is discussed here. The last 4 years of records at each station is used because at the Podeh Chah station the daily rainfall is only available for the last 4 years. A threshold of 0.1 mm of rainfall is considered to define the sequence of wet and dry days. Then 20 sets of Z years data are generated using the methods discussed in the previous sections. Where Z is the length of historic data, in years, used to determine the transition probabilities, which is 4 years for all three stations. The average monthly values of 20 sets of Z years data are obtained both for occurrence and magnitudes, as suggested by Jimoh and Webster [8]. The generated data are compared with historic data of which only the results for the Zahedan station are presented in Figures 3a and b. The reasons for selecting the Zahedan station for discussing the results is that the historic data is thought to be more accurate and longer historic records are available.A comparison of the results in Figures 3a and b indicates that the both monthly number and depth of wet days obtained from 20 sets of Z years follows closely the historic data.
However, in the area of study the rainfall storms are often of frontal type, as discussed by Khazai [4]. This means that rainfall often covers whole the catchment on the same day. Furthermore the Zahedan catchment is not so large and has an area of 1280 km2. Therefore, there is a good spatial correlation in rainfall occurrence among the rain gauges within the catchment. To show this, we can use the available rainfall data that are 0.87 and 0.94, respectively. These values are reasonable and indicate that in the rainy days, often all the three stations receive rainfall. This is also confirmed by visual examining the historical rainfall records. The spatial correlation of the generated data was also examined by obtaining the cress correlation coefficient between the generated rainfalls in Zahedan
Figure 3. Comparison of generated rainfall occurrence and amounts with historical data for Zahedan station: (a) Rainfall Occurrence and (b) Rainfall Depth.
and Gorband stations and between Gorband and Podeh Chah station using the generated rainfall data, which are 0.84 and 0.92 respectively. These values indicate that there is a reasonably good spatial correlation among the generated data for the stations.
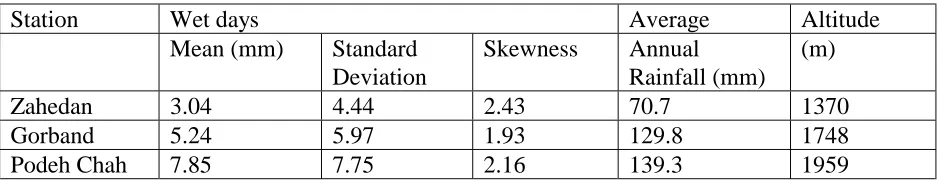
Thus, based on this method 20 years of rainfall data is generated for the Zahedan, Gorband and Podeh Chah stations. The statistical parameters for the three stations some of which are used for the generation of magnitude of daily rainfall, as well as the altitudes of the stations are shown in Table 1.
To estimate rainfall for subcatchments in the highland area with no rain gauges, a two sites data generation technique is used. This is discussed in the next section.
Generating Daily Rainfall for Arbitrary
Stations in the Highland Area
To generateTABLE 1.Statistical Parameters Obtained from 4 Years Records (1991-92 to 1994-95) and the Altitudes of Zahedan, Gorband and Podeh Chah Stations.
Station Wet
days
Average Altitude
Mean
(mm)
Standard
Deviation
Skewness Annual
Rainfall (mm)
(m)
Zahedan 3.04
4.44
2.43
70.7
1370
Gorband 5.24
5.97
1.93
129.8
1748
Podeh Chah
7.85
7.75
2.16
139.3
1959
cross-correlation generation model presented by Fiering [14] is used. The model preserves the means, variances, skewnesses and cross-correlation of the two sites. In this technique the site with historical or available generated rainfall series is selected as a reference site. If we assume that site b is the reference site and site g is subordinate to site b, then the following formula can be used to generate values of site g based on the values at site b.
Pg Pg r P P R r
g
b
b b N g
= + (σ )( − )+ ( − )
σ σ 1
2 1
2 (5)
where,
g and b refer to sites
P is the daily rainfall
P
is the average rainfall of wet daysσ is standard deviation of rainfall of wet days
r is cross correlation between the sites in the same time period.
RN is normal random variable with zero mean and unit variance. In the Zahedan catchment, the highland area has a great influence on recharging the aquifer located in the plain, as discussed by Khazai [4]. Therefore, it is necessary to have a reasonably good spatial coverage of rainfall gauges in the highland area by assigning some arbitrary stations. In the Zahedan catchment, the highland area has been divided into 8 subcatchments, with rainfall data available for the Podeh Chah station, which is located in subcatchment 7. Daily rainfall data is generated for a period of twenty years using the first-order Markov model and the Gamma distribution for Podeh Chah station. Daily rainfall is then generated for the remaining subcatchments
i.e. 1 to 6 and 8. To do this, the Podeh Chah station is considered as a reference site and then the procedure, which is discussed as below, is carried out.
To carry out the generation it is necessary to have an estimate of the wet day means and standard deviations for the arbitrary rain gauges, which are assumed for the subcatchments. This is obtained by considering the mean of wet days and the altitudes of the Zahedan, Gorband and Podeh Chah stations. Table 1 shows the mean values of wet days, average annual rainfall for period of 1991-92 to 1994-95 and the altitude of the three stations. As can be seen in the table rainfall amounts are higher at the stations with greater altitudes. Therefore an estimate of the wet days
0.9 is
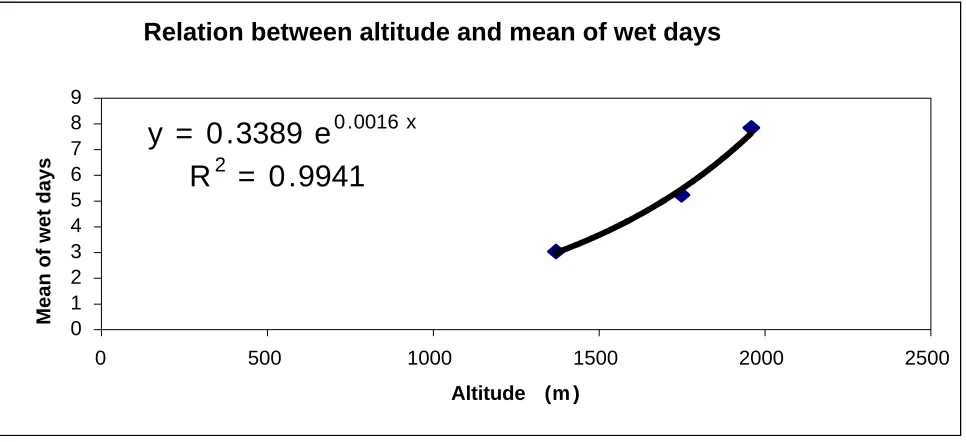
mean magnitude at subcatchments with arbitrary gauges is based on the rainfall and altitude relationship using Excel regression analysis facilities (as shown in Figure 4). In the relationships shown in Figure 4, y is the mean of wet day in mm, x is altitude in meter and R2 is the regression coefficient.For the sake of simplicity and in the absence of any other information, the value of standard deviation for all the arbitrary rain gauges are assumed to be equal to the standard deviation of the Podeh Chah station.
The generation of daily rainfall data for the arbitrary stations in the highland area is carried out as follows:
a) In each of the ungauged subcatchments an arbitrary rain gauge is assigned at some location. The arbitrary rain gauges are located at approximately the average subcatchments altitudes.
Relation between altitude and mean of wet days
y = 0 .3389 e
0 .0016 xR
2= 0 .9941
0 1 2 3 4 5 6 7 8 9
0 500 1000 1500 2000 2500
Altitude (m )
Mean of wet days
Figure 4. The relation between the altitude and mean of wet days in Podeh Chah station based on period of 1991-92 to 1994-95.
TABLE 2. Estimated Means of Wet Days for Relevant Altitudes.
Subcatchment
1 2 3 4 5 6 8
Altitude
(m)
1650 1800 1900 2000 1600 1700 1800
Wet Days:
Estimated Mean (mm)
4.75
6.04
7.08
8.31
4.38
5.14
6.04
TABLE 3.The Statistical Parameters Based on 20 Years Generated Data for the Available and Arbitrary Stations within the Zahedan Catchment
Station Wet
day
Average
Mean
(mm)
Standard
Deviation
Skewness Annual
(m)
Zahedan 2.76
3.93
2.98
63.11
Gorband 5.19
6.37
3.36
131.46
Podeh Chah
7.33
7.51
2.12
143.58
Subcatchment 1
6.83
6.82
2.42
100.80
Subcatchment 2
7.29
7.13
2.28
119.22
Subcatchment 3
7.44
6.71
2.34
135.37
Subcatchment 4
8.40
7.34
2.30
159.55
Subcatchment 5
7.28
6.76
2.22
101.05
Subcatchment 6
6.79
6.53
2.47
104.91
c) Based on the rainfall and altitude relationship (Figure 4) an estimate of the mean values of wet days for the assumed rain gauges is obtained which are shown in Table 2.
d) Considering the cross correlation coefficient values obtained between the rainfall in Zahedan and Gorband procedure stations and between Gorband and Podeh Chah station as presented in the previous section, a value of assigned to r. e) The random variable, RN, with zero mean and unit variance is generated based on the illustrated f) In Figure 2 and using the NORMSINV command in Excel. The NORMSINV function returns the inverse of the standard normal cumulative distribution.
The above information is applied to Equation 5 and 20 years of daily rainfall are generated for the assumed rain gauges in the highland area using Podeh Chah as a reference site. Table 3 shows the mean, standard deviation as well as the average annual rainfall of the generated data for a period of 20 years at the real and arbitrary stations.
A comparison of the results given in Tables 3 and 1 shows that there are some discrepancies between mean, standard deviation and skewness of wet days of generated and historical data for the Zahedan, Gorband and Podeh Chah stations. The reason is probably due to the short period of available data, which was used as a base for generation. The value of average annual rainfall of the generated data in Table 3 is close to the historical values in Table 1. There is a bigger discrepancy between the generated annual rainfall for Zahedan station in Table 3 and the historical values in Table 1. However, the average annual rainfall of the generated data for 20 sets of 4 years for Zahedan station match closely the historical ones that are 73.14 and 70.72 respectively. Thus it
can be said that the length of the generated data, which is selected for comparison, is also important.
At the arbitrary stations, the mean of generated wet days in subcatchments 3 and 4 in Table 3 shows a better match with the estimated values in Table 2. However, in the other arbitrary stations there are discrepancies between the mean of wet days of the generated data and estimated ones. The generated values are often higher. The reason may be as follows:
a) The random values with zero mean and unit variance may have a negative value. This gives an opportunity either to have or not to have rain at an arbitrary station while there is rain in the reference station, which is Podeh Chah. This effect often causes the smaller values of rainfall to be omitted which results in an increase in the mean of generated rainfall at the arbitrary station.
However, to further assess the validity of generated rainfall for the arbitrary stations, a regression analysis was carried out to obtain a relationship between the total average annual rainfall of historic data and altitudes of the available rain gauge stations, using Excel facilities. Based on this relationship and having the altitudes of the arbitrary stations, an annual value of rainfall is estimated for each of the arbitrary stations.
The results are compared with the average annual of the generated data for the arbitrary stations in Table 4. As is seen in the table, the average annual rainfall of the generated rainfall is in some cases lower and in other cases higher than the estimated ones. However, the differences are generally reasonable. The standard deviation and the skewness of the generated data are reasonably close to the reference station, Podeh Chah.
TABLE 4.Comparison of Estimated Average Annual Rainfall, Based on Regression Analysis, and Generated Ones for the Arbitrary Stations.
Subcatchment
1
2
3
4
5
6
8
Estimated
(mm)
102.24 122.40 138.01 155.60 96.28 108.56 122.40
Generated
(mm)
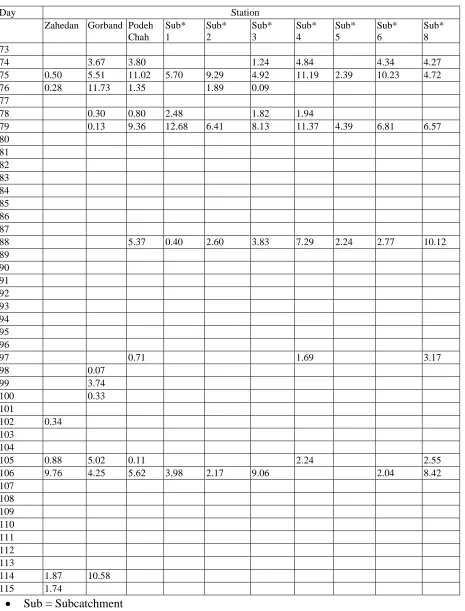
TABLE 5.Generated Daily Rainfall (mm) for the Available and Arbitrary Station for Days 73 to 115 of a Year.
Day Station
Zahedan Gorband Podeh
Chah
Sub* 1
Sub* 2
Sub* 3
Sub* 4
Sub* 5
Sub* 6
Sub* 8
73
74 3.67 3.80 1.24 4.84 4.34 4.27
75 0.50 5.51 11.02 5.70 9.29 4.92 11.19 2.39 10.23 4.72
76 0.28 11.73 1.35 1.89 0.09
77
78 0.30 0.80 2.48 1.82 1.94
79 0.13 9.36 12.68 6.41 8.13 11.37 4.39 6.81 6.57
80
81
82
83
84
85
86
87
88 5.37 0.40 2.60 3.83 7.29 2.24 2.77 10.12
89
90
91
92
93
94
95
96
97 0.71 1.69 3.17
98 0.07
99 3.74
100 0.33
101
102 0.34
103
104
105 0.88 5.02 0.11 2.24 2.55
106 9.76 4.25 5.62 3.98 2.17 9.06 2.04 8.42
107
108
109
110
111
112
113
114 1.87 10.58
115 1.74
To check whether the generated daily rainfall both in the available and the arbitrary stations has a good cross correlation within the catchment, Table 5 was prepared. As can be seen in the table there is generally a good cross correlation among the stations within the catchment.
In general, considering the purpose for which the generated data is used, it is believed that the generated daily rainfall is reasonably good.
CONCLUSION
This paper describes the techniques used to generate daily rainfall both for the existing stations as well as arbitrary stations within the Zahedan catchment. In this respect the following is worth mentioning:
a) The generated average monthly number of wet days using a first-order Markov model for the available stations matches the historical data closely.
b) The results of the chi-square tests indicate that the gamma distribution can describe the magnitude of rainfall on wet days in the study area.
c) The average monthly-generated rainfall amounts using a Gamma distribution for the available stations are generally good. However, the discrepancies, which exist, may be due to insufficient length of available historic data used for the generation.
d)
The generation of daily rainfall for the arbitrary stations in the ungauged subcatchments of the highland area is acceptable, considering the purpose for which the data is generated.e) The generated daily rainfall for the available and arbitrary stations shows a satisfactory cross correlation.
Thus, the generation process can be extremely useful in supplementing the data in arid region where shortage of data is a major concern in ground water resources assessment.
ACKNOWLEDGEMENTS
The helpful advice and comments of Professor M. J. Hamlin are warmly acknowledged.
REFERENCES
1. E. Khazai and A. E. F. Spink, “A Catchment Water Balance Model in Estimating the Groundwater Recharge in the Arid and Semi-Arid Regions of Iran”, Proceeding of the 8th International Conference on Rainwater Catchment Systems, April 25-29, Tehran, I.R. Iran (1997), 16-26.
2. D. R Dawdy and T. O’Donnell, “Mathematical Models of Catchment Behavior”, J. Hydraul. Div. ASCE, Vol. 91, HY4, (1965), 123-137.
3. M. Franchini and M. Pacciani, “Comparative Analysis of Several Conceptual Rainfall-Runoff Models”, J. Hydrol., Vol. 122, (1991), 161-219.
4. E. Khazai, “A Conceptual Model Representing Arid Regions Catchment with Emphasis on Groundwater Recharge”, University of Birmingham, U.K., Unpubl. Ph.D. Thesis, (1997).
5. T. A. Buishand, “Some Remarks on the Use of Daily Rainfall Models”, J. Hydrol., Vol. 36, (1978), 295-308. 6. M. J. Hamlin and D. H. Rees, “The Use of Rainfall
Forecasts in the Optimal Management of Small-Holder Rice Irrigation of Case Study”, Hydrological Sciences, Vol. 32 (1), (1987), 15-29.
7. K. R. Gabriel and J. Neumann, “A Markov Chain Model for Daily Rainfall Occurrence at Tel Aviv”,Quart. J. Roy. Met. Soc., Vol. 88, (1962), 90-95.
8. O. D. Jimoh and P. Webster, “The Optimum Order of a Markov Chain Model for Daily Rainfall in Nigeria”, J. Hydrol., Vol. 185, (1996), 45-69.
9. R. D. Stern and R. Coe, “A Model Fitting Analysis of Daily Rainfall Data”, J. Roy. Statist. So., Vol. A147, (1984), 1-34.
10. R. T. Clark, “Mathematical Models in Hydrology”,
Irrigation and Drainage, Paper 19, FAO, Rome, (1973), 1-84.
11. C. T. Haan, “Statistical Methods in Hydrology”, Iowa State University Press, (1979).
12. D. H. Rees and M. J. Hamlin, “The Allocation of Water for Irrigation inTtimes of Shortage”, IAHS Publ., No. 147, (1983).
13. N. T. Kottegoda, “Stochastic Water Resources Technology”, MacMillan, London, (1980).
![Figure 2. Procedure for generating a random observation from a probability distribution (Reproduced from Haan [11])](https://thumb-us.123doks.com/thumbv2/123dok_us/245379.2019241/4.595.316.536.83.434/figure-procedure-generating-random-observation-probability-distribution-reproduced.webp)