ESTIMATION OF HYDRODYNAMIC FORCE ON
ROUGH CIRCULAR CYLINDERS IN RANDOM WAVES
AND CURRENTS
M. Naghipour
Faculty of Engineering, Mazandaran University Babol, Iran, [email protected]
(Received: October 2, 1998 – Accepted: February 3, 2000)
Abstract Most of the Codes of Practice (API, BSI, DnV, NPD) uses Morison's equation to estimate
hydrodynamic loads on fixed and moving offshore structures. The significant difference in the prediction of the loads mainly arises from the assumption of the values of hydrodynamic coefficients. In this paper by analysing a full scale set of data in large KC's numbers collected from Delta Wave Flume in the Netherlands the effects of random waves (JONSWAP spectrum) and uniform current over the artificially rough cylinder have been investigated. The prediction of water particle kinematics has been made from the surface elevation measurements using Stokes fifth order wave theory. By using the Weighted Least Squares technique the hydrodynamic coefficients have been estimated. A comparison between measured force and predicted force shows that although the accuracy of prediction over the whole data is about 90%, the errors on the local peaks are significant (24%) the case which is of interest in the ultimate limit state involving a single extreme wave.
Key Words Hydrodynamic Coefficients, KC’s Number, Random Waves, Stokes Theory
ﻩﺪﻴﻜﭼ
ﺮﻴﻈﻧﺎﻫﻪﻣﺎﻧﻦﻴﺋﺁﺐﻠﻏﺍ API, BSI, DnV, NPDﺮﺑﺩﺭﺍﻭﻲﻜﻴﻣﺎﻨﻳﺩﻭﺭﺪﻴﻫﻱﺎﻫﻭﺮﻴﻧﻦﻴﻤﺨﺗﻱﺍﺮﺑﺍﺭﻥﻮﺴﻳﺭﻮﻣﻪﻟﺩﺎﻌﻣ
ﺪﻨﻳﺎﻤﻧﻲﻣﻪﻴﺻﻮﺗﻲﻳﺎﻳﺭﺩﻙﺮﺤﺘﻣﻭﺖﺑﺎﺛﻱﺎﻫﻩﺯﺎﺳ .
ﻲﻣﻩﺪﻫﺎﺸﻣﺎﻫﻪﻣﺎﻧﻦﻴﺋﺁﺯﺍﻡﺍﺪﻛﺮﻫﻱﺮﻴﮔﺭﺎﻜﺑﺭﺩﻪﻛﻱﺍﻩﺪﻤﻋﻱﺎﻬﺗﻭﺎﻔﺗ
ﺨﺗﻭﻪﺒﺳﺎﺤﻣﻩﻮﺤﻧﺯﺍﻲﺷﺎﻧﺎﺗﺪﻤﻋ،ﺩﻮﺷ
ﺖﺳﺍﻲﻜﻴﻣﺎﻨﻳﺩﻭﺭﺪﻴﻫﺐﻳﺍﺮﺿﻦﻴﻤ .
ﻲﻌﻗﺍﻭﺱﺎﻴﻘﻣﺎﺑﻲﺸﻳﺎﻣﺯﺁﻱﺎﻫﻩﺩﺍﺩﻪﻟﺎﻘﻣﻦﻳﺍﺭﺩ
ﺭﺩ
KC ﻲﻓﺩﺎﺼﺗﺝﺍﻮﻣﺍﺮﻴﺛﺎﺗﺖﺤﺗﺮﺑﺯﺢﻄﺳﺎﺑﻲﻳﺎﻫﺭﺪﻨﻠﻴﺳﻱﻭﺭﮒﺭﺰﺑﻱﺎﻫ )
ﭖﻮﺴﻧﺎﺟﻒﻴﻃ (
ﻝﺎﻧﺎﻛ ﺭﺩﻪﻛﺎﻳﺎﭘﻥﺎﻳﺮﺟﻭ
ﺖﺳﺍﻪﺘﻓﺮﮔﺭﺍﺮﻗ ﻞﻴﻠﺤﺗﻭﻪﻳﺰﺠﺗﺩﺭﻮﻣ،ﻩﺪﺷﻡﺎﺠﻧﺍﺪﻨﻠﻫﺭﺩﻊﻗﺍﻭﺎﺘﻟﺩﻲﻜﻴﻟﻭﺭﺪﻴﻫ .
ﺗﺎﻤﻨﻴﺳ ﻱﺭﻮﺌﺗﺯﺍﻩﺩﺎﻔﺘﺳﺍﺎﺑﺏﺁﺕﺍﺭﺫﻚﻴ
ﻲﻜﻴﻟﻭﺭﺪﻴﻫ ﺐﻳﺍﺮﺿ ،ﻲﻧﺯﻭﺕﺎﻌﺑﺮﻣ ﻦﻳﺮﺘﻤﻛﺵﻭﺭﻪﺑ ﺲﭙﺳﻭ ﻩﺪﺷﻩﺩﺯﻦﻴﻤﺨﺗ ﺏﺁﺢﻄﺳ ﻱﺮﻴﮔﻩﺯﺍﺪﻧﺍ ﺯﺍﺲﻛﻮﺘﺳﺍ ﺝﻮﻣ
ﺖﺳﺍﻩﺪﻳﺩﺮﮔﻪﺒﺳﺎﺤﻣ .
ﻞﻛﻦﻴﻤﺨﺗﺖﻗﺩﻪﭼﺮﮔﺍﻪﻛﺪﻫﺩﻲﻣﻥﺎﺸﻧﻩﺪﺷﻩﺩﺯﻦﻴﻤﺨﺗﻭﻩﺪﺷﻱﺮﻴﮔﻩﺯﺍﺪﻧﺍﻱﺎﻫﻭﺮﻴﻧﻦﻴﺑﻪﺴﻳﺎﻘﻣ
ﺩﻭﺪﺣ ﺎﻫﻩﺩﺍﺩ
90
% ﻭ،ﺖﺳﺍ ﺍﺭﺝﻮﻣﻚﺗﻦﻳﺮﺘﮔﺭﺰﺑﻭﻩﺩﻮﺑﻱﺪﺣﺵﻭﺭﻪﺑﻲﺣﺍﺮﻃﺭﺩﻪﺟﻮﺗﺩﺭﻮﻣﻪﻛﻚﻴﭘﻁﺎﻘﻧﻱﺎﻄﺧﻲﻟ
ﻪﺟﻮﺗﻞﺑﺎﻗﻱﺭﺍﺪﻘﻣ،ﺪﻫﺩﻲﻣﺭﺍﺮﻗﻙﻼﻣ )
ﺩﻭﺪﺣ
24
(% ﺖﺳﺍ .
INTRODUCTION
There has been a considerable volume of experimental research undertaken to estimate the force coefficients in Morison's equation [1], which parallels the growth in the number of tubular jacket structures used for offshore oil and gas
the scale of laboratory experiments is one way to achieve post-critical flow conditions, however this requires very large scale facilities and such flow conditions have only been achieved at low Keulegan-Carpenter Numbers (KC's) for smooth circular cylinders, i.e. relatively large cylinder diameters compared to the amplitude of the oscillatory flow. Fortunately the surface condition of tubular offshore is rarely completely smooth and adding surface roughness reduces the Re of the "critical" region and allows post-critical flow conditions to be achieved for a wide range of KC's in large facilities.
The 3-dimensional random waves found offshore can be reproduced in multi-directional wave basins in the laboratory but this is usually on too small a scale to achieve post-critical flow conditions for large a wide range of KC for circular cylinders unless the relative roughness coefficient (k = average roughness height / cylinder diameter) is very large. To achieve the required Re experiments have been undertaken in various flow conditions using various techniques including:
• steady flow obtained using a cylinder suspended beneath a carriage in a towing tank, oscillating water in a large U-tube past a fixed cylinder [2]
• mounting cylinder on a linearly oscillating underwater carriage[3]
• moving cylinders using a bi-directional carriage [4] , [5]
• regular and random long-crested waves in a 2-dimensional wave flume, e.g. [6].
The last provides the most realistic representation of offshore conditions currently available in the laboratory and the experiments described and discussed in this paper were undertaken in a large 2-D wave flume.
Offshore the wave particle kinematics may be augmented by current. In the laboratory this can be simulated either by circulating the water in the wave flume or by attaching the test cylinder to a
moving carriage. The former is not very practical at large scale and in the experiments described in this paper the later approach has been used. Such an approach means of course the current direction must be collinear with the wave direction or directly opposed to it and hence will not represent many of the conditions likely to be experienced offshore.
In the laboratory it is possible to measure the wave particle velocity beside the cylinder. These measurements can be differentiated with respect to time to find the corresponding wave particle acceleration. It is these measurements, together with the measured force on the cylinder which are generally used when estimated the drag and inertia coefficients (Cd and Cm) for Morison's equation. However such measurements are not available for offshore wave fields and only estimates of wave height and corresponding period will be available. Thus the particle kinematics for offshore conditions must be estimated using some wave theory. Such estimates may have both a random error and a bias according to the wave theory used. Now in the experiments described in this paper both the wave surface elevation and wave particle velocity have been measured. Thus it has been possible to compare measured particle kinematics and those predicted by various wave theories. In addition it has been possible to estimate Cd and Cm using both measured and predicted values. In order to estimate predictive accuracy a measure is needed of how well the predicted force maps onto the independently measured force. In this paper the root mean square error in the prediction of the maximum and minimum (maximum negative) force normalised by the measured force is used as one measure of predictive accuracy. To avoid the influence of irrelevant small waves only the fit to waves of above average height are considered. The normalised mean bias in this fit is used as the other measure of predictive accuracy.
measure of the uncertainty and bias involved in using Morison's equation for the prediction of in-line forces which should be helpful in structural reliability calculations and structural assessments. The next section of the paper describes the experiments that were undertaken as part of an EC/MTD funded project in the Delft Hydraulics Laboratories (DHL) long wave flume at DeVoorst in Holland. The third section describes the Weighted Least Squares Method for the prediction of force coefficients from experiment data. The fourth section deals with the prediction of wave particle kinematics. The fifth section describes assessing predictive accuracy. Finally some conclusions are drawn.
DESCRIPTION OF THE EXPERIMENTS
During September and October 1993 a series of experiments were made to examine the wave loading on two large scale circular cylinders in the Delft Hydraulic Laboratory’s Delta wave flume in the Netherlands (DHL). This flume is 230m long, 5m wide, 7m deep and during all tests was filled with water to a depth of about 5m. The waves were
generated by a programmable, hydraulically driven, piston type wave maker and their energy was dissipated at the other end of the flume through the use of a 1:6 sloping, concrete beach. This facility is capable of generating regular and random waves with a range of periods of about 3 to 10 seconds and wave heights up to about 2m over most of the range of periods.
For the random wave experiments the JONSWAP, [7] and [8] spectrum was used and the results presented in this paper are for experiments in long crested random waves with a significant wave height of 1.5m and a peak period of 5.9 second. For simulating the effects of current and combined wave/current flows the flume is equipped with a 8m by 6m towing carriage that runs on a set of rails on the top of the flume walls and can attain a steady velocity of 1m/s, with the maximum towing distance dependent upon the test set up. In this experiment the carriage speeds were
±
1m/s and±
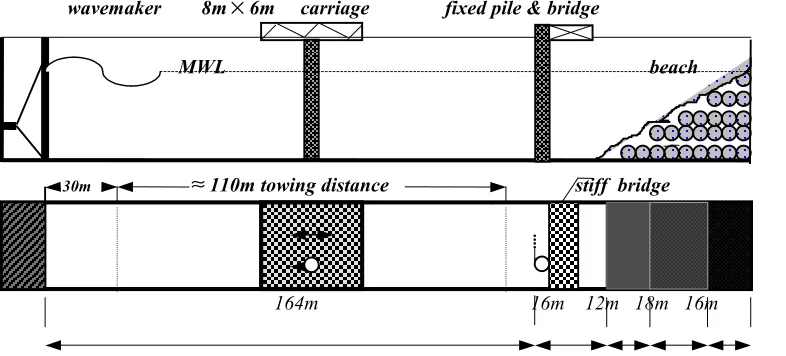
0.5m/s and the towing distance was approximately 110m. Figure 1 shows a schematic longitudinal section of the flume with a cylinder mounted on the moving carriage, a fixed cylinder, the beach and the wave-maker.The two vertical cylinders used for the
wavemaker 8m
×
6m carriage fixed pile & bridgeMWL beach
(a)
30m
≈
110m towing distance stiff bridge(b)
164m 16m 12m 18m 16m
TABLE 1. Details of All Experiments Analysed (R is Dean reliability ratio [10]).
RUN Data Current Pile Data Wave R KC
No name (m/sec) Dia. (mm) No No min mean max min mean max
Run1 v5fr01i 0 513 55040 291 0.03 0.74 1.46 0.2 5.5 17.5
Run2 v5cr22i 1 513 22536 130 0.72 3.79 15.5 1.92 13.5 25.3
Run3 v5cr22i -1 513 22560 102 3.22 5.66 24.8 1.43 17.4 32.3
Run4 v2f01i 0 216 54980 286 0.08 1.72 3.21 0.4 12.8 37.9
Run5 v2cr03i 0.5 216 26766 152 0.99 3.63 6.0 0.75 21.8 45.9
run6 v2cr03i -0.5 216 26953 141 0.63 5.18 10.5 1.92 22.9 57
experiments described in this paper had base diameters of 0.21 m (small) and 0.5 m (large) and were mounted in turn on the towing carriage and at fixed location in the flume. Both cylinders were manufactured from stainless steel and were covered with the roughness pattern that was originally developed by Wolfram [9]. This roughness consists of a pseudo-random arrangement of three different sizes of right square pyramids which in each case have heights of the same dimensions as the base. The roughness elements were cast in fibreglass in the form of semi-circular shells which were strapped to the cylinder giving an effective roughness ratio (k/D) of 0.038 and corresponding effective diameters for the large and small rough cylinders of 0.513m and 0.216m respectively.
The details of the six experiment runs considered here are given in Table 1 from which it can be seen that there were experiments with both the small and large cylinders stationary, with a
current in the wave direction and a current opposing the wave direction. The currents were achieved by translating the cylinder on the moving carriage away from the wavemaker and towards the wavemaker respectively. Several translations needed to be patched together to produce a complete run of about 10 minute.
WEIGHTED LEAST SQUARES METHOD
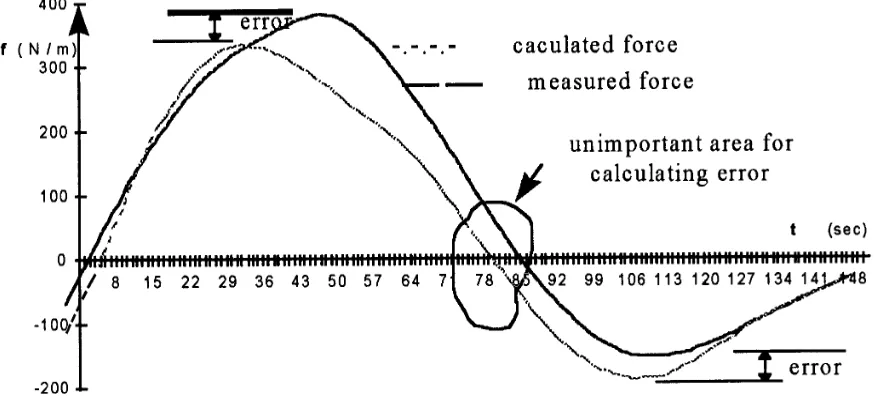
Figure 2. The error between the peaks of the measured and predicted force.
structures. The weighted least square formulation is:
0
0
1
)
(
1
)]
25
.
0
|
|
5
.
0
(
[
)
(
2 2 2 2 2=
=
=
=
+
−
=
−
=
∑
∑
M D f k m f k m M D m k m e m k m k m fC
E
and
C
E
e
f
N
e
f
N
E
u
C
D
u
u
DC
f
f
f
f
f
f
e
∂
∂
∂
∂
ρπ
ρ
&
(1)where
f
m , u ,u
&
are the time series of measured force, water particle velocity and accelerationrespectively. Frequently the acceleration is not measured directly but computed from velocity measurements. In other cases both are computed
from wave surface elevation . The terms
e
f,
f
e,
E N
,
define the error of in the estimatedforce, the estimated force, mean square error and number of data from which the coefficients are evaluated respectively. The parameter k (an arbitrary positive number) is considered as a constant which can be selected to minimise the error in the critical peak force areas (Figure 2). The coefficients are then obtained as below:
C
f
fu u
f u
f
fu
f u u u
D
f u
f u
f uu u
C
f
fu
f u
f
fu u
f uu u
D
f u
f u
f uu u
D
k k k k
k k k
M
k k k k
k k k
=
−
−
=
−
−
∑
∑
∑
∑
∑
∑
∑
∑
∑
∑
∑
∑
∑
∑
2 2 2 2 2
2 4 2 2 2 2
2 2 4 2 2
2 2 2 2 4 2 2
0 5
0 25
| |
&
&
| |
&
.
(
&
(
&
| |) )
&
| |
&
| |
.
(
&
(
&
| |) )
ρ
ρ π
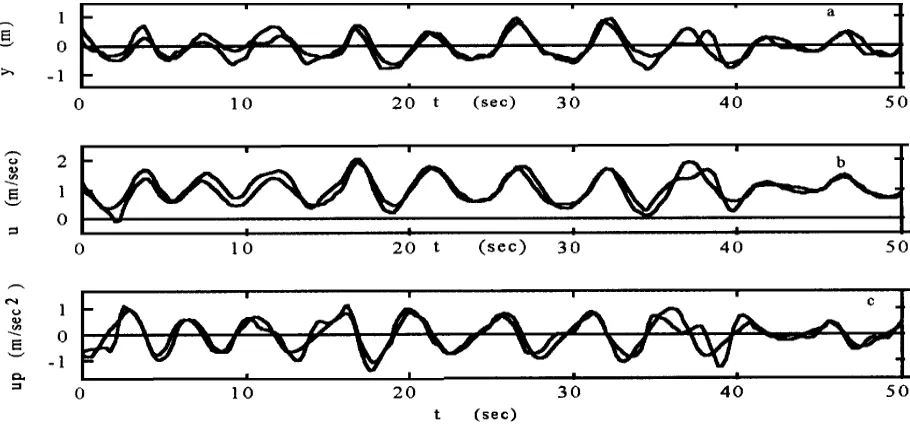
Figure 3. Comparison between measured and predicted (a) surface elevation
(b) horizontal velocity and (c) acceleration by Stokes 5th theory (Run2).
It has been found that the constant k can be optimised in an iterative manner to give a minimum predictive error in the peak force regions. In this paper k = 2 has been selected.
ESTIMATING WAVE PARTICLE KINEMATICS FROM WAVE SURFACE
MEASUREMENTS
The computation of water particle kinematics is one of the most important tasks in the determination of force on slender offshore structures where Morison's equation is used. Stokes' theory is widely used in the design and analysis of offshore structures, and in this paper fifth-order Stokes theory is considered (Figure 3). For fifth-order Stokes theory, the Skjelbreia and Hendrickson [11] method has been compared with the Fenton method [12]. In addition to the documented error in the Skjelbreia and
Hendrickson method [13], the theory does not explicitly include the effects of current when it exists with the waves. In this study because the current exists in most of the experiments, Fenton's method has been used to predict the wave kinematics from surface elevation. The details of the description and formulation of this method are given by [14] and are not repeated here.
Each random wave in a record has been replaced with a single deterministic wave, then the corresponding velocity and acceleration time series have been obtained through wave by wave analysis using wave theory in turn. This predicted kinematics has been compared with the measured ones.
two-dimensional wave flumes, there are several reflection analysis methods that can be used in regular and irregular wave regimes e.g. [15], [16], [17] and [18].
Guza [19] developed a time domain method to decompose the long waves into seaward and shoreward propagating components by using a pressure gage and current meter located on the same vertical line in the water column. The detail of this method is given by Hughes [20] and in this paper that method has used for the decomposition of surface elevation time series into the incident and reflected wave train. It can be shown that the incident and reflected wave train (
η
i andη
r) are givenη
i tη
t u td g
( )= 1[ ( )+ ( ) ]
2 (3)
η
r tη
t u td g
( )= 1[ ( )− ( ) ]
2 (4)
where g is acceleration due to gravity, d is still water depth and u(t) is the horizontal velocity time series. By using the Stokes' fifth order theory (Fenton method) and using the incident and reflected wave time series the horizontal wave particle kinematics are estimated.
ASSESSING PREDICTIVE ACCURACY
In a statistical sense a good estimator should be unbiased and of minimum variance. This is equally important when estimating the forces on offshore structures and in this paper two corresponding parameters are used to assess how well a predicted force time series compares with the corresponding measured force time series. These parameters are the mean normalised error (MNE) and root mean square error (RMSE) are given by:
MNE
N
f
f
f
m i e i m i i N
=
−
=∑
100
1(
)
( )
(
)
(5)2
1
(
)
)
(
)
(
1
100
∑
=
−
=
Ni m i
i e i m
f
f
f
N
RMSE
(6)where
f
m is maximum of absolute value of measured force ,f
e is the same asf
m but for predicted force and N is the number of waves of above average height.The parameters above can be unduly influenced when
f
m is small and the absolute error is large so it is desirable not to consider small waves and their corresponding forces when predicting the measured time series. For jacket type offshore structures the ultimate wave loading involves very high KC and most of the fatigue damage occurs in waves of at least moderate KC (typically above about 7-10). Therefore it was decided to see how well the measured force due to waves of above average height could be predicted.CONCLUSIONS
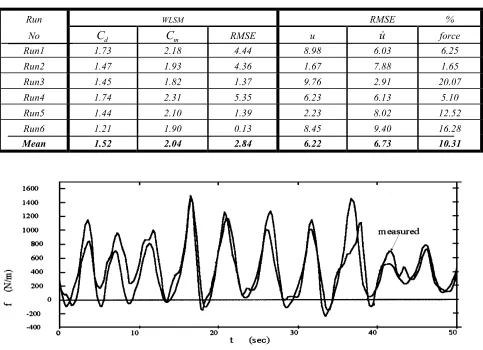
TABLE 2. Accuracy of Prediction of Water Particle Velocity, Acceleration and Hydrodynamics Coefficients, and Morison Force in the Random Waves.
Run WLSM (2) %
u
error %u
&
error force errorNo
C
dC
m MNE RMSE MNE RMSE MNE RMSE MNE RMSERun1 1.73 2.18 -1.60 11.18 8.53 18.45 9.67 18.21 17.18 23.45
Run 2 1.47 1.93 4.58 9.00 -0.45 8.36 12.57 20.82 -4.65 18.31
Run3 1.45 1.82 0.62 7.28 7.77 10.70 14.06 21.72 15.34 19.50
Run4 1.74 2.31 -2.68 15.36 6.14 19.34 12.76 19.52 13.64 26.85
Run5 1.44 2.10 -2.66 12.08 4.89 16.27 24.01 29.31 7.34 29.18
Run6 1.21 1.90 0.06 10.27 13.52 15.76 15.44 23.87 26.90 29.63 Mean 1.52 2.04 -0.28 10.86 6.73 14.81 14.75 22.24 12.63 24.49
TABLE 3. Accuracy of Prediction of Water Particle Velocity, Acceleration and Hydrodynamics Coefficients, and Morison Force in the Random Waves for Whole Data.
Run WLSM RMSE %
No
C
dC
m RMSE uu
&
forceRun1 1.73 2.18 4.44 8.98 6.03 6.25 Run2 1.47 1.93 4.36 1.67 7.88 1.65 Run3 1.45 1.82 1.37 9.76 2.91 20.07 Run4 1.74 2.31 5.35 6.23 6.13 5.10 Run5 1.44 2.10 1.39 2.23 8.02 12.52 Run6 1.21 1.90 0.13 8.45 9.40 16.28 Mean 1.52 2.04 2.84 6.22 6.73 10.31
clear trend which showed that the addition of current significantly decreased the drag coefficient and to a lesser extent the inertia coefficient. For KC values above around 10 use of single mean drag and inertia coefficients (about 1.7 and 2.2 respectively) for heavily marine roughened cylinders in waves without current seems satisfactory. When current is present both coefficients should be significantly less.
It has been shown through the experiments that using Morison's equation for the prediction of maximum forces when random waves are applied to vertical rough cylinders is accomplished with error of about 24% of which most contribution is related to the prediction of particle kinematics and less from estimation of Cd and Cm (Figure 4). However this is less than 10% when the error is averaged over the whole force time histories rather than considering the error at the locations of maxima on the measured force time histories (see Tables 2 and 3).
REFERENCES
1. Morison, J. R., O'brien, M. P., Johnson, J. W., and Schaaf, S., “The Force Exerted by Surface Wave on Piles”, Transactions of the American Institute of
Mining and Metallurgical Engineers, Vol. 189, (1950),
147-154.
2. Sarpkaya, T. and Isaacson, M., “Mechanics of Forces on Offshore Structures”, Van Nostrand Reinhold Company Inc., New York, (1981).
3. Wolfram, J., “A Novel Underwater Hydrodynamic Experiment Facility and First Results with Marine Growth Covered Cylinders”, (Part B), Trans. of Royal
Institution of Naval Architects, London, (1992).
4. Rodenbusch, G., and Gutierrez, C. A., “Forces on Cylinders in Two-Dimensional Flows”, Technical Progress Report, BRC 13-83, Shell Development Co., (1983).
5. Chaplin, J. R., “Non-linear Forces on Horizontal Cylinders in the Inertia Regime in Waves at High Reynolds Numbers”, Proc. 5th Int. Conf. on Behaviour
of Offshore Structures, (1988), 505-518.
6. Bearman, P. W., Chaplin, J. R., Graham, J. M. R., Kostense, J. K., Hall, P. F. and Klopman, G., “The
Loading on a Cylinder in Post-Critical Flow Beneath Periodic and Random Waves”, Behaviour of Offshore Structures, (1985a), 213-225.
7. Hasselmann, K., et al., “Measurements of Wind-Wave Growth and Swell Decay During the Joint North Sea Wave Project (JONSWAP)”, Deutschen.
8. Hydrographischen Zeitschrift, No., A, (1973), 27-95. Chakrabarti, S. K, “Technical Note: On the Formulation of Jonswap Spectrum”, Applied Ocean Research, Vol. 6, No. 3, (1984), 175-176.
9. Wolfram, J., “Marine Fouling and Fluid Loading”,
Final Report on Project FLE6, MTD Programme
(Fluid Loading in Offshore Engineering) (1987). 10. Naghipour, M., “The Accuracy of Hydrodynamic Force
Prediction for Offshore Structures and Morison's Equation”, Thesis Submitted for PhD, Heriot-WattUniversity, Edinburgh, (1996).
11. Skjelbreia, L. and Hendrickson, J., “Fifth Order Gravity Wave Theory”, Proceedings of the 7th Conference of
Coastal Engineering, (1961), 184-196.
12. Fenton, J. D., “A Fifth-Order Stokes Theory for Steady Waves”, Journal of Waterway, Port, Coastal, and Ocean Engineering, Vol. 111, No. 2, (1985), 216-234. 13. Nishimura, H., Isobe, M., and Horikawa, K.,
“Higher-Order Solution of the Stokes and Cnoidal Waves”, J.
Fac. of Engrg., Univ. of Tokyo, Series B, 34, Tokyo,
Japan, (1977), 267-293.
14. Sobey, R. J., Goodwin, P., Thieke, R. J. and Westberg, Jr., “Application of Stokes, Cnoidal and Fourier Wave Theories”, Journal of Waterway, Port, Coastal, and Ocean Engineering, Vol. 113, No. 6, (1987), 565-587. 15. Goda, Y. and Suzuki, Y., “Estimation of Incident and
Reflected Waves in Random Wave Experiments”, Proc.
of the 15th Coastal Engineering Conference, ASCE,
Vol. 1, (1976), 828-845.
16. Qijin, F., “ Separation of Time Series on Incident and Reflected Waves in Model Test with Irregular Waves”,
China Ocean Engineering, Vol. 2, No. 4, China Ocean
Press, (1988), 45-60.
17. Mansard, E. P. D. and Funke, E. R., “The Measurement of Incident and Reflected Spectra Using a Least Squares Method”, Proc. of the 17th Coastal Engineering
Conference, ASCE, Vol. 1, (1980), 154-172.
18. Hughes, S. A., “Estimating Laboratory Oblique Wave Reflection”, International Symposium: Waves Physical
and Numerical Modelling, Canada, Vol. 1, (1994),
206-215.
on Steep and Shallow Beaches”, Proc. of the 19th
Coastal Engineering Conference, ASCE, Vol. 1,
(1984), 708-723.
![TABLE 1. Details of All Experiments Analysed (R is Dean reliability ratio [10]).](https://thumb-us.123doks.com/thumbv2/123dok_us/245667.2019268/4.595.59.537.112.375/table-details-experiments-analysed-r-dean-reliability-ratio.webp)