014 2 , 8 d management studies Vol.2, no. SINGAPOREAN JOuRNAl Of buSINESS EcONOmIcS, AN
1
MEASURING NIGERIAN STOCK MARKET VOLATILITY
Osazevbaru, Henry Osahon (Ph.D)
Department of Accounting and Finance,Delta State University, Abraka,Nigeria
Abstract
The contribution of stock market to the growth process of any economy is not in doubt. However, volatility in stock market can trigger a rise in cost of capital which is capable of affecting economic growth negatively. This has implication for portfolio allocation, asset pricing and market risk measure. This paper is concerned with these issues and aims at empirically testing for the presence or otherwise of volatility clustering in the Nigerian stock market. Using time series data of share prices for the period 1995 to 2009, the Autoregressive Conditional Heteroscedasticity (ARCH) model and Generalized Autoregressive Conditional Heteroscedasticity (GARCH) model were estimated. The estimates indicate that the market exhibits volatility clustering. The rate at which the response function decays is found to be 1.1783 and quite high. It is suggested that aggressive trading on a wide range of securities be encouraged as this will increase market depth and hence reduce volatility.
Keywords: Nigerian stock market, Volatility, Arch effect, GARCH model, African emerging markets.
Introduction
2
The fore-going position aligns with the positive linkage school of thought on importance of capital markets for economic growth and development. It is the view of this school of thought that a well functioning capital market will precipitate long term economic growth (Alile, 1984; Atje and Jovanovic, 1993; Oyijide, 1994). The other opposing school of thought however, says that the alleged positive linkage between capital market development and economic growth is not proven and at best is ambiguous (Dimirguc-Kunt and Levine, 1996; Shleifer and Summer, 1988). Contributing to this discourse, Nyong (1997) found that there is bi-directionality causality between capital market development and economic growth in Nigeria. In the bi-directional relationship, economic growth dominates in the direction of causality and his evidence did not validate the expected positive relationship.
Although issues of volatility are not limited to emerging economies, its effects are more devastating in such economies because of their fragile nature. Emerging economies are not insulated from internal and external perturbations and so, shocks are quickly transmitted into the macro-economy. In most of these economies, economic development has gone side by side with financial market development. Therefore, the effects of relevant economic and political events on the stock market and vice-versa can be easily experimented on. Given the recent history of financial crises in developing economies, an understanding of factors that affect financial markets becomes of extreme priority. Specifically for Nigeria, Osaze (2000) notes that capital market ranks behind money market in terms of attractiveness to business organizations as a source of finance. He added that not less than 60% of total savings is in the money market. This situation portends danger for the economy because the money market is not designed to provide development funds for business organizations. The basic empirical question is: why this dominance of money market over capital market? A plethora of studies on the Nigerian capital market have attempted an investigation into this problem. This study contributes to this intellectual discourse by examining the volatility of the Nigerian stock market as a possible research avenue for understanding stock market development and economic growth.
The general objective of this article therefore, is to examine if the Nigerian stock market exhibits volatility clustering or volatility pooling wherein large changes in returns tend to be followed by large changes and small changes by small changes, thus leading to contiguous periods of volatility and stability (“wild” and “calm” periods as it is often called). In a volatile stock market, the expected value of the magnitude of the disturbance terms can be greater at certain periods than others. This fact requires models that are capable of dealing with variance of the price or return series. Against this backdrop, the paper models stock returns using autoregressive conditional heteroscedasticity (ARCH) and generalized autoregressive conditional heteroscedasticity (GARCH) models. It is hoped that the findings of the paper will be of immense benefit for policy formulation.
3
impulse response function decays. This study intends to fill these gaps and in that process contributes to the growing literature on the subject particularly in Nigeria and African markets in general.
The rest of this article is organized into four sections. Section 2 examines the literature review including profile of the Nigerian stock market, while section 3 provides an exposition of data employed and methods of analysis. In section 4, data are analyzed and results discussed and section 5 summarizes the paper with some concluding remarks.
Literature Review and Theoretical Framework
Finance theory offers explanation of the causes of volatility in stock markets. The explanation is hinged on the fact that stock market volatility is related to business cycle (Mele, 2008). However, no one theory has been found to exhaustively explain business cycle. But the revolutionary macro-economic ideas of Keynes (1936) points to the importance of the forces of aggregate demand in determining business cycle. This foundation led to the formulation of internal theories of business cycle of which the multiplier acceleration theory pioneered by Samuelson (1939) is one. This theory posits that high output growth induces investment and high investment in-turn induces more output. This reciprocal process continues until the capacity of the economy is reached at which point the growth rate of the economy slows down. This slow growth will force investment spending and inventory accumulation to reduce culminating into economic recession. When the trough is reached, the process works in the reverse order to stimulate recovery (Lucas, 1981; Moore, 1983).
Using this framework, Mele (2008) states that stock market volatility is largely countercyclical, being larger in bad times than in good times. Accordingly, stock expected returns lower much less during expansions than they increase during recessions. The reason for this is because the investors’ required return is not only countercyclical but also asymmetrically related to the development of the business cycle which happens when risk- premia (i.e the investors expected return to invest in the stock market) increase more in bad times than they decrease in good time. Again, drawing from the internal theories of business cycle, Umstead (1977) states that stock prices are determined by expectations which unfortunately are not directly measurable. He however, noted that if these expectations are rational, then they can be derived from existing measures of the economy. Thus, expectations are formed in a systematic relationship to the leading elements of economic activity. Apparently, business cycle related information does not become available in discrete bits which the market place instantaneously absorbs with perfect efficiency. But rather this information unfolds gradually in cyclical pattern overtime. Stock prices, to some degree, appear to respond in a predictable manner to this cyclical flow of information. Garry (1990) provides further rationalization of this position from Dow theory; that there are regular cycles in the economy. He stated that if the economy does go through regular cycles and stock prices mirror the economy, then it seems plausible that stock prices go through predictable cycles too and it is to the investor’s advantages to know which direction the cycle is going.
4
factors (behavioural finance model) as cultural changes and increasingly optimistic forecasts by analysts. Veronesi (1999) and Brennan and Xia (2001) see this as learning induced phenomenon. They opined that the growth rate of the economy is unknown and investors attempt to infer it from a variety of public signals. This inference process makes asset prices to also depend on the investors guesses about the dividend growth rate and thus induces higher return volatility. Roll (1984) posits that volatility is affected by market micro-structure while Glosten and Milgrom (1985) explained it by the liquidity provision process wherein when market makers infer the possibility of adverse selection, then they adjust their trading ranges which in turn increases the band of oscillation.
Other causes of market volatility are: the improved speed and efficiency with which financial transactions are carried out, the increased inter-dependence and inter-connectivity of stock markets (which can come through cross-border listing) and the greater homogeneity of investors’ behaviour. These factors largely relate to the speed at which the stock market accommodates shocks and impute the relevant information into prices. While these factors may lead to a higher level of volatility, they produce different characteristics of volatility dynamics. For instance, a market where the information get incorporated faster into the price must revert to the normal level of volatility faster and must have a reduced persistence of volatility shocks. In sum, factors driving market volatility would correspond to the stage of the domestic market and to its degree of integration with other markets.
Overview of the Nigerian Stock Market
Perhaps, it is not completely out of place to recapitulate some latent and obvious facts about the Nigerian stock market. Following the enactment of the Government and other Securities (Local Trustees Powers) Act in 1957 and the setting up of the Barback Committee to examine the ways and means of fostering a stock market in Nigeria, the Lagos Stock Exchange was established in September 15, 1960. However, it started operation on June 5, 1961. Further developments in the macro-economy and the financial system led to: renaming of the Lagos Stock Exchange as the Nigerian Stock Exchange (NSE) so as to have trading floors in different parts of the country, the establishment of the second-tier securities market, the setting up of Securities and Exchange Commission as the apex regulatory body, the launching of internet system (CAPNET) to provide the infrastructural support for internationalization and introduction of an automated clearing and settlement system (Okereke-Onyuike, 2001; NSE, Presentation Note, 2002; NSE Fact book, 2006).
5
to 33 securities in 1975 and then to 91 securities in 1980. From this number, it increased to 131 securities in 1990, 181 securities in 1995 and 195 securities in 2000. In 2005, the number was 214 securities from where it grew marginally to 217 securities in 2010 (Nigerian Capital Market Statistical Bulletin, 2010). Sadly however, most of these securities are not actively traded; only an average of less than 50% is traded on daily. In spite of the increase in market capitalization and listed securities, studies have indicated that the Nigerian stock market has not been aggressive in growth due to unstable macroeconomic environment, poor regulation and supervision system, limited range and paucity of securities, inactive bond market and dwindling investors’ confidence (Osaze, 2000; Donwa and Odia, 2010). These issues are impetus for further investigations of the Nigerian stock market. It is however hoped that the religious implementation of the capital market reform policies will put the market on a sound pedestal.
Data Employed.
The sample data used for this study are the daily and monthly closing prices of the NSE All Share Index over the period January 2, 1995 to December 31, 2009. The data were sourced from NSE official list, Central Securities Clearing Systems (CSCS) Ltd official list and www.africanfinancialmarkets.com. The returns data were derived from the price data using the expression:
= 100
Where, is the return at time t, Pt is the price at time t; Pt-1 is the lagged price and is
the natural logarithm.
Specification of Models
Using a univariate analysis framework, the study adopts the suggestion of Brooks and Burke (2003) that the ARCH and GARCH models are sufficient to capture all of the volatility clustering and unconditional returns distribution with heavy tails that is present from financial time series data. These often characterize stock data of emerging stock markets. The idea in ARCH and GARCH models is to investigate the position of conventional econometric analysis that the variance of the disturbance term is constant overtime (commonly referred to as the homoscedasticity assumption). This assumption permits the use of the estimated regression equation to make forecast of the dependent variable. However, practically all financial time series tend to exhibit varying variance; in which case, the homoscedasticity assumption becomes limiting. Therefore, it becomes more appropriate to examine patterns that allow the variance to depend upon its history (Dimitrios and Hall, 2007). This is the thrust of the ARCH and GARCH models. Accordingly, the paper implemented the ARCH model (usually credited to Engle, 1982) and GARCH model (usually credited to Bollerslev, 1986). However, before estimating the ARCH (and of course GARCH) models, it is important to check for the presence of Arch-effect. The Arch-effect tests whether the coming of news to the market affects the variance of the market. This requires estimating the model:
U2t = β0+ β1 U2t-1 ………. (1)
Where: U2t is the variance of the error term at time t and in this context is the news about
volatility in the current period. U2t-1 is the lag value of the variance of the error term and conveys
news about volatility from the previous period. β0 and β1 are parameters measuring intercept and
slope respectively. The statistical significance of the estimated β1 can be judged by the usual
6
Arch-effect is found to be present, then an ARCH (1) model can be estimated. The general form of an ARCH (1) model is:
Rt = ∝0 + ∝1Rt-1 + Ut ……….. (2a)
Ut/Φt ≅ iid N (0, ht)
ht = 0 + 1U2t-1 ………(2b)
Equation (2a) is called the mean equation and it is essentially a general form of an autoregressive ordinary least square model for return. It states the return at time t to be a function of previous value of return. Ut is the error term and Φt is the information set that is available at
time t. Thus, the error term, given the available information set (Ut/Φt) is independently and
identically distributed with zero mean and variance ht. Equation (2b) is the variance equation
which captures the time varying behaviour of the Ut. The reason for having mean equation and
variance equation is because we are interested in modeling simultaneously the attitude of investors not only towards expected returns (or mean returns), but also towards risk and uncertainty. The ARCH (1) model states that when a big shock happens in period t-1, it is more likely that the value of Ut will be bigger as well. In other words, when U2t-1 is large or small, the
variance of the next innovation Ut is also large or small. If the estimate 1 in equation (2b) is
positive and significant, there is volatility clustering.
On methodological ground, it can be argued that the variability of the return series changes slowly or is expected to change more slowly than in the ARCH (1) model. In which case, having one lag value is insufficient. If this is the case, an ARCH (q) model becomes useful. However, ARCH (q) models are quite often difficult to estimate because they often yield negative estimates of i. Again, ARCH model looks more like a moving average specification
than an auto-regression. To resolve this, the GARCH model becomes very potent. For this reason, the GARCH (1 1) model below is estimated.
Rt = ∝0 + ∝1Rt-1 + Ut ………. (3a)
Ut/Φt-1 ≅ iid N (0, ht)
ht = 0 + 1U2t-1+ δht-1 ……….(3b)
Where, 0˃0, 1 > 0, δ >0
Equation (3a) is the mean equation and (3b) the variance equation. The variance equation says that the value of the variance scaling parameter, ht now depends both on past values of the
shocks which are captured by the lagged square residuals term and on past values of itself captured by lagged ht. Now, if the estimate of δ and 1 are significant and positive, then there is
volatility clustering. All these models will be run on Eviews 7.0
Empirical Results and Discussion
Table 1 presents the summarized descriptive statistics.
7
Daily Data Monthly Data Daily Data Monthly Data
Mean Maximum Minimum Standard deviation Skewness 0.019544 16.76577 -16.17565 1.067594 -0.190524 0.018629 1.410801 -1.253321 0.301893 0.184317 Kurtosis Jarque-Bera Probability
No of
observations 99.94970 1532884 0.000000 3914 7.970927 186.3451 0.000000 180
Source: Author’s estimates
Table 1 shows the basic statistics that help describe both daily returns data and monthly returns data. There is in general a large difference between the maximum and minimum returns indicating a high level of fluctuations. This is confirmed by the standard deviation values. In order to determine the symmetrical distribution of the data, the skewness value was measured and found to be negative for daily data, but positive for monthly data. Implicitly, there is greater tendency for daily returns to fall while monthly returns to rise. This result could be due to stock market calendar anomalies wherein the impact of “Monday effect” (a day of the week effect) is diametrically opposite of “January effect” (month of the year effect). However, both the daily data and the monthly data show extreme tails indicating that there are non-symmetric returns. Again, for both data, the degree of excess or kurtosis is large; exceeding the benchmark value of three and suggestive of leptokurtic distribution. The probability value of zero for the Jarque-Bera statistic shows that the estimate is statistically significant at 1% level and therefore the distributions are not normal.
The stationarity of both series was tested using the Augmented Dickey-Fuller (ADF) unit root test. In their level form, they had unit root and therefore non-stationary. But the series became stationary at first difference indicating that they are integrated of order 1 and that an auto-regressive model of order 1 is appropriate to the data.
Table 2: Results of test for Arch effect on Monthly Data
Variable Coefficient t-statistic Probability
C
RESID (-1)2
0.071581 0.153976 4.237885 2.073317 0.0000 0.0396** ** 5% level.
ARCH LM Test: F-statistic 4.298645 Prob. F (1,177) 0.0396 Obs* R-squared 4.244143 Prob. Chi-square (1) 0.0394
Source: Author’s estimates
As stated previously, Arch-effect is present if the coefficient of the lagged value of residual squared (U2t-1) is positive and if the estimate is statistically significant. From the results
in table 2, the coefficient of U2t-1 is positive. Also, on the basis of the t-test as well as F-test and
Chi-square test, the estimate is significant at the 5% level. Therefore, the null hypothesis that there is no arch-effect is rejected. As a result, it is concluded that Arch-effect is present.
8
Table 3 Results of ARCH (1) Model for Market Volatility on Monthly Data Mean Equation
Variable Coefficient Z-statistic Probability
C RET (-1) -0.000185 0.309923 -1.293025 4.415652 0.1960 0.0000*** Variance Equation C
RESID (-1)2
0.000345 0.862059 11.96762 4.970231 0.0000*** 0.0000***
*** 1% level.
Source: Author’s estimates
From the results in table 3, the estimate ∝1, that is, the coefficient of the lagged value of return
in the mean equation is statistically significant at the 1% level. Also, in the variance equation,
1, the coefficient of the lagged value of residual squared, is positive and statistically significant.
According to the decision rule, if 1 is positive and significant, there is volatility clustering. On
the basis of this, the conclusion is that stock market returns in Nigeria exhibit volatility clustering. Knowledge of such periods of high volatility is important to risk-averse investors.
This analysis is extended further to accommodate a scenario where the variability in the series changes more slowly than in the ARCH (1) model especially in emerging markets. Consequently, a GARCH (1 1) model is implemented using equations (3a) and (3b). This allows the variance scaling parameter to depend on both the past value of the shock and past value of itself.
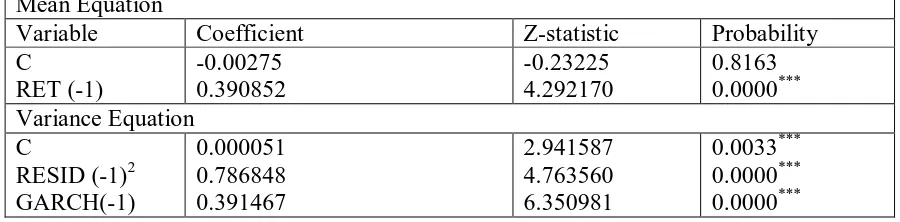
Table 4 Results of GARCH (1.1) Model for Market Volatilityon Monthly Data Mean Equation
Variable Coefficient Z-statistic Probability
C RET (-1) -0.00275 0.390852 -0.23225 4.292170 0.8163 0.0000*** Variance Equation C
RESID (-1)2 GARCH(-1) 0.000051 0.786848 0.391467 2.941587 4.763560 6.350981 0.0033*** 0.0000*** 0.0000***
*** 1% level
Source: Author’s estimates
From table 4, the estimate 1, that is, the coefficient of the lagged square residual is positive and
statistically significant at the 1% level. Also, the estimate δ, the coefficient of the lagged value
9
decision rule in using this model is that if the estimate of 1 and δ are significant and positive,
then there is volatility clustering. Clearly, the results show that both estimates are significant and positive. Therefore, the Nigerian stock market exhibits volatility clustering.
Again, the sum of 1 and δ is an estimate of the rate at which the response function
decays on a monthly basis. This rate, 1.178328 is very high and is symptomatic of response function to shock dying very slowly. Thus, if there is a new shock, it will have impact on return for a long period. In this type of market, old information is more important than recent information and makes the market highly predictable. A predictable stock market is inefficient according to the Efficient Market Hypothesis; as it allows an investor to earn abnormal return without assuming the commensurate level of risk (for more discussion on the efficient market hypothesis, see Fama, 1970, 1991; Inanga and Emenuga, 1997; Olowe,1999). This can affect efficient resource allocation and encourage share price manipulation. This perhaps explains why cases of share price manipulation are rampant in the Nigerian stock market. Again, it signifies that technical analysis can be profitably employed in the Nigerian stock market. This result agrees with Ogum et al (2005) and Frimpong and Oteng-Abayie (2006) who found high response - function (0.92188) for Ghana Stock Exchange (another emerging stock market). In sum, the results of both ARCH (1) and the GARCH (1 1) models show that the market exhibits volatility clustering. Thus, either of these models could account for volatility clustering in Nigerian stock market. However, the study found that on the basis of model selection criteria using Akaike Information criterion (AIC), Schwarz Bayesian Criterion (SBC) and Hannan and Quin Criterion, the GARCH (1 1) is better than the ARCH (1) model. This is because the values in these selection criteria are smaller in the GARCH than in the ARCH model. This result corroborates with Frimpong and Oteng-Abayie (2006), that the GARCH (1 1) model outperformed other models when applied to African stock markets, confirming Brooks and Burke (2003). The result of this study is therefore justified on methodological ground by these prior studies.
This study also estimates the models for test of volatility clustering using daily returns data. Like in the monthly data, Arch-effect is found to be present and the study proceeds to estimate ARCH (1) and GARCH (1 1) models. The results are presented in the table 5.
Table 5 Results of ARCH (1) and GARCH (1 1) Models for Market Volatility on Daily Returns Data
Model ARCH(1) GARCH(1 1) Mean Equation
C
RET (-1)
-0.000885(-25.744)*** -0.109578(-32.1142)***
-0.000111(-1.30728) 0.152746(12.7758)*** Variance Equation
C
RESID (-1)2 GARCH(-1)
0.000033(186.76)*** 1.662325(78.4811)*** -
0.000007(56.4049)*** 0.066528(47.4941)*** 0.936679(1225.36)***
Source: Author’s estimates
Note: Z - statistic in brackets. ***, denotes 1% level
10
To identify the sources of volatility, we need to examine the ARCH (1) and GARCH (1 1) graph produced for the time frame under study. It can be seen that the volatility from 2006 is higher than volatilities in other periods. Further investigation reveals that this period of high volatility is the period following financial liberalization culminating in the recapitalization of banks, stock broking firms and insurance companies. Therefore, financial liberalization and economic policy decisions are sources of volatility in the Nigerian stock market. This result is consistent with Kassimatis (2000) and Bekaert and Harvey (2003) who made special reference to episodes of financial liberalization and economic policy decisions as causes of changes in the volatility of emerging stock markets. The explanation of the sources of volatility provided by this study is also supported by previous study on the efficiency of the Nigerian stock market by Okpara (2010). He found the market to be weak-form inefficient in some years which include; 1987 to 1988, 1995 and 2003 to 2004. He attributed this to financial deregulation in 1987, the privatization of public enterprises in 1988 and the internationalization of the Nigerian stock in 1995. Clearly, all these are elements of financial liberalization
The volatility of the Nigerian stock market found by this study can also be attributed to patterns of investors’ behaviour. The high impulse-response function found by this study is symptomatic of a unique pattern of investors’ behaviour. Nigerian investors are found to be driven more by behavioural finance factors (sociological and psychological factors) than fundamental factors of listed companies. The paper identifies the fact that periods of high volatility are periods when investors simply follow the “herd” (as explained in Herd instincts theory and Prospect theory of Kahneman and Tverskey, 1986; Chandra, 2006), that is, take cues from the actions of others. Information cascades, therefore, lead investors to overreact to both good and bad news. In Nigeria, it is a common feature to see individual investors taking cues from institutional investors and insider trading activities. This herd attitude creates buying and selling pressures which encourages volatility.
Summary and Conclusion
11
References
Alile, H. I. (1984) “The Nigerian Stock Exchange: Historical Perspective, Operations and Contributions to Economic Development”, Bullion Central Bank of Nigeria, Silver Jubilee Edition Vol.II, pp 66-68.
Arestis, P; Demetriades, P. O. and Luintel, K.B. (2001) “Financial Development and Economic Growth: The Role of Stock Markets”, Journal of Money, Credit and Banking, 33 (2) pp 16-41.
Atje, R. and Jovanovic, I. (1993) “Stock Market and Development”, European Economic Review, 37 pp 632-640.
Bekaert, G. and Harvey, C.R. (2003) “Emerging Market Finance”, Journal of Empirical Finance, 10 pp 3 – 55.
Bollerslev, T. (1986) “Generalized Autoregressive Conditional Heteroscedasticity”, Journal of Econometrics, 31 pp 307-327.
Brennan, M. J. and Xia, Y. (2001) “Stock Price Volatility and Equity Premium”, Journal of Monetary Economics, 47 pp 249 – 283.
Brooks, C. and Burke, S. P. (2003) “Information Criteria for GARCH Model Selection: An Application to High Frequency Data”, European Journal of Finance, 9 (6) pp 557-580. Chandra, P. (2006) Investment Analysis and Portfolio Management. New Delhi: Tata
McGraw-Hill Ltd, 2nd edition.
Dimirguc-Kunt, A. and Levine, R. (1996) “Stock Market Development and Financial Intermediaries: Stylized Facts”, The World Bank Economic Review, 10 (2) pp 241-265. Dimitrios, A. and Hall, G.S. (2007) Applied Econometrics: A Modern Approach New York:
Macmillan, Revised edition.
Donwa, P. and Odia, J. (2010) “An Empirical Analysis of the Impact of the Impact of the Nigerian Capital Market on Her Socio-Economic Development”, Journal of Social Sciences, 24 (2) pp 135-142
Engle, R. F. (1982) “Autoregressive Conditional Heteroscedasticity with Estimates of the Variance of U.K. Inflation”, Econometrica, 50 pp 987-1008.
Engle, R. F. and Ng, V. K. (1993) “Measuring and Testing the Impact of News on Volatility”, Journal of Finance, 48 (1) pp 1749-1778.
Eskandar, T. (2005) “Modeling and Forecasting Egyptian Stock Market Volatility Before and After Price Limits”, The Economic Research Forum Working paper #0310, September. Frimpong, J. M; and Oteng-Abayie, E. F. (2006) “Modeling and Forecasting Volatility of
Returns on the Ghana Stock Exchange Using Garch Models”, America Journal of Applied Sciences, 3 (10) pp 2042 - 2048.
Garry, S. (1990) Investment USA: Scottforesman/Little Brown Higher Education.
Glosten, L. R; and Milgrom, P. R. (1985) “Bid, Ask and Transaction Prices in a Speculative Market with Heterogeneously Informed Traders”, Journal of Financial Economics, 14 (1) pp 71 - 100
Hongyu, P and Zhichao, Z (2006) “Forecasting Financial Volatility: Evidence from Chinese Stock Market”, Working Paper in Economics and Finance, No.06/02, University of Durham.
Kahneman, D; and Tversky, A. (1986). “Choices, Values and Frames”, American Psychologist, 6 pp 341-350.
12
Lucas, E.R. (1981) Studies in Business-Cycle theory. Cambridge Mass: MIT Press.
Mala, R. and Reddy, M. (2007) “Measuring Stock Market Volatility in an Emerging Economy”, International Research Journal of Finance and Economics, 8 pp126-133.
Mele, A. (2008) “Understanding Stock Market Volatility: A Business Cycle Perspective” Working Paper, London School of Economics. April.
Moore, H.G. (1983) Business Cycles, Inflation and Forecasting. Ballinger Cambridge 2nd edition.
Nigerian Capital Market Statistical Bulletin, 2010, 2
Nigerian Stock Exchange and You: Presentation Notes 2002 Nigerian Stock Exchange Fact Book, 2006.
Nyong, M. O. (2003) “Predictability and Volatility of Stock Returns in Three Emerging Markets: Nigeria, South Africa and Brazil”, Nigeria Journal of Economics and Development Matters, 2 (1) pp 12-29
Nyong, M.O. (1997) “Capital Market Development and Long-run Economic Growth: Theory, Evidence and Analysis”, First Bank Review, December pp 13-38.
Ogum, G; Beer, F and Nouyrigat, G. (2005) “Emerging Equity Market Volatility: An Empirical Investigation of Markets in Kenya and Nigeria”, Journal of African Business, 6 (1&2) pp139-154
Okereke-Onyiuke, N (2001) “The Nigerian Stock Exchange as a Vehicle for Capital Mobilization and Allocation to Productive Sectors” Being a paper presented to participants of senior executive course No 23 of the National Institute for Policy and Strategic Studies, Kuru, Plateau State. March 16, p12.
Okpara, G. C. (2010) “Analysis of Weak-Form Efficiency on the Nigerian Stock Market: Evidence from GARCH Model”, The International Journal of Applied Economics and Finance, 4 pp 62-66
Osaze, E. B. (2000) The Nigerian Capital Market in the African and Global Financial System. Benin City: Bofic Consulting Group limited.
Oyejide, T.A. (1994) “The Financial System and Economic Growth in the Context of Political Transition”, Central Bank of Nigeria Economic and Financial Review, 12 (3) pp 260-267.
Porteba, J. M. (2000) “Stock Market Wealth and Consumption”, Journal of Economic Perspectives, 14 (2) pp 99-118
Roll, R. (1984) “A Simple Implicit Measure of the Effective Bid-Ask Spread in an Efficient Market”, Journal of Finance, 39 (4) pp 1127- 1139.
Shiller, R. J. (2000) Irrational Exuberance. Princeton: Princeton University Press.
Umstead, A. D. (1997) “Forecasting Stock Market Prices” Journal of Finance, 32 (2) pp 427-447.
13
14