I n t e r n a t i o n a l J o u r n a l o f E n g i n e e r i n g R e s e a r c h a n d S p o r t s S c i e n c e Page 1
K. Deepika M.Tech, E.C.E, MGIT, Hyderabad, India S. Praveena Asst. professor, E.C.E, MGIT, Hyderabad, India
ABSTRACT
Segmentation and classification of high resolution satellite imagery is a challenging problem due to the fact that it is no longer meaningful to carry out this task on a pixel-by-pixel basis. Segmentation is done by clustering algorithms and classification is done using neural network classifier. Neural network classifier for regions of trees, shades, buildings and roads in a given image. It starts with the single step preprocessing procedure to make the image suitable for clustering. The pre-processed image is clustered using the Artificial Bee Colony (ABC) algorithm that is developed by modifying the ABC with FCM to obtain the effective clustering satellite image and classified using neural network. After applying Modified ABC method it is found that classification accuracy is improved for all regions.
__________________________________________________________________________________________________________ I. INTRODUCTION
Remote sensing can be used in creation of mapping products for military and civil applications, evaluation of environmental damage, monitoring of land use, radiation monitoring, urban planning, growth regulation, soil assessment and crop yield appraisal. It is also used for mapping and classification of land cover features and acts as a substitute for traditional methods that perform land cover features namely vegetation, soil, water and forests and acts as a substitute for traditional methods that perform land cover classification using expensive and time intensive field surveys. In recent years, research has progressed in computer vision methods applied to remotely sensed images such as segmentation, object oriented and knowledge based methods for classification of high-resolution satellite imagery. It includes the attribution of segments, that is, the assignment attributes which usually express geographic information, e.g. textural, shape and neighborhood properties. High resolution remote sensing image segmentation is a big challenge in terms of potential applications, and also due to difficulty of the task. Image, classification methods may be grouped into two main categories depending on the image primitive used, via pixel based or object based methods. Pixel based methods classify individual pixels without taking into account any spatial information of the pixel, only the spectral patterns are used. On the other hand, object based methods attempt to group pixels into objects by an image segmentation process based on the spectral, spatial and contextual information inherent in these objects to classify the whole image. It has emerged as a superior way of doing image classification. One of its strength is the ability to extract real world objects, proper in shape and accurate in classification. It eliminates the mixed pixel problem suffered by most pixel based methods. This is because the image is classified on an object level and usually more information is used. Object based methods are also able
to handle high resolution satellite imagery which aggravates the classification process for most pixel based methods. Classification techniques include conventional statistical algorithms, such as discriminate analysis and the maximum likelihood classification, which allocate each image pixel to the land cover class in which it has the highest probability of membership. One of the major disadvantages of these classifiers is that they are not distribution free. In the same way, traditional pixel-based classification methods have difficulty with high resolution satellite imagery, resulting in a “salt and pepper” appearance. So design of an efficient segmentation approach for satellite images is necessary to achieve the high efficiency in real time object tracking based applications. Segment-based classification approaches are often rule-based or knowledge-based methods relying on classification rules developed by human experts. This approach can yield good results if the characteristics of the dataset are stable and if the classification problem can be well defined by the rules.
II. PROPOSED MODIFIED ARTIFICIAL BEE COLONY
One of the SI (Swarm Intelligence) approach is taken to further enhance the classification accuracy. ABC algorithm is one of the SI approach. ABC algorithm and FCM are combined to improve the classification accuracy of satellite images. The detailed explanation of ABC-FCM algorithm is given below.
2.1 Training Phase
In the training phase, different shapes of roads, trees, shades and buildings region images are taken.
For each image do the preprocessing using median filter. Extract the layers such as H (Hue), S(Saturation), L(Lightness), T(Tint), A, B(Color opponent dimensions), U and V( U, V from LUV color space). For each layer calculate maximum value of histogram and mean value of cluster pixels
MODIFIED ABC ALGORITHM
I n t e r n a t i o n a l J o u r n a l o f E n g i n e e r i n g R e s e a r c h a n d S p o r t s S c i e n c e Page 2
in that layer. Three neural networks are taken to train the building, road and shade regions separately. For each neural network give the corresponding feature values to train it.
2.2 Testing Phase
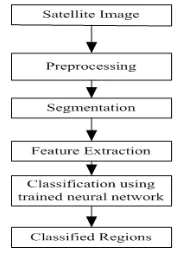
The testing phase is completely organized in three steps as shown in fig 2.1.
1. Pre-processing
2. Segmentation using proposed algorithms ABC-FCM 3. Classification using Feed Forward Neural Network Classifier
Fig 2.1 Process of Testing Phase A. Pre-processing
Under the pre-process, the input satellite image is applied to median filter. The output of median filter is used for segmentation process. Then, the filtered image is converted into its HSL (Hue, Saturation, and Lightness), TSL (Tint, Saturation, Lightness) and LAB (Lightness, color opponent dimensions) color spaces. The H, T, L layers are extracted from the image. These layers are used in segmentation process. For image segmentation we can use any proposed hybrid algorithms as per requirement but in this chapter we are using ABC-FCM. The clusters formed from the H, T and L layers are then merged with one another. Merging process is discussed. Here the same process is done on clustered layers. Each merged group is then given for the feature extraction process. The feature extraction process is done in the same way as in the training phase on each merged group i.e. the H, S, L, T, A, B, U and V layers are extracted from each merged group and so on.
B. ABC-FCM Algorithm
The segmentation process is done based on ABC-FCM algorithm. Consider the ABC-ABC-FCM algorithm is applied on H layer. The process is as follows: initially fixed numbers of initial solutions (food sources) are generated randomly by giving lower bound and upper bound. Each solution would contain the centroids based on the required number of clusters. The Fig shows the sample solutions generated randomly.
Sample Solutions
S denotes the solution (food source); I denote the total number of solutions generated; C denotes the centroid in the solution; and J denotes the total number of centroids generated. After initial solutions are generated, the fitness is calculated for each solution. The calculation of fitness is as follows: initially the centroids in each solution are taken for clustering process and the clustering is done based on the minimum distance. The fitness is then calculated based on the
In the above equation fiti denotes the fitness of ith solution, where i=1, 2 ---J; and xa denotes ath pixel x in jth cluster; and
j=1, 2 ---J;
A is the total number of pixels in jth cluster, where; and Cj denotes the centroid Cof jth cluster.
D. Employed Bee Operation
The employed bee then makes modification on the solution in its memory based on the local visual information and then calculates the nectar amount (fitness) of the new solution. If the nectar amount of the new solution is better than the old one, the bee would memorize the new one and forgets the old one. Otherwise it would keep the position of the old one in its memory. The employed bee operation is performed on each solution. To produce a candidate food position from old one in memory, the ABC uses the eq(2.3):
In the above equation,
k
1
,
2
,....,
I
and
J
j
1
,
2
,....,
are randomly chosen index. Thoughk
is determined randomly, it is different fromi
. i.e., Sij denotes thejth centroid of
i
thsolution S; and Skj denotes the jth centroid of
kth solution of S. The Φij in the above equation is a random
number between (-1,1) and it controls the production of neighbor food sources around Sij and represents the
comparison of two food positions visible to a bee. Using the above equation the jth centroid of ith solution
S
would get altered. We can alter two or more centroids based on the above equation and we would get a new solution. From the above formula the perturbation on the position Sij decreases asthe difference between the parameters Sij and Skj decreases.
Therefore the step length is adaptively reduced as the search approaches to the optimum solution in the search space. After the employed bee operation is performed on each solution, the fitness is calculated for each newly formed solution. If the nectar amount of the newly formed solution is better than the old one, the employed bee would memorize the new one and forgets the old one. The employed bees then share the nectar (fitness) information with the onlooker bees on the dance area.
E. Onlooker Bee Operation
I n t e r n a t i o n a l J o u r n a l o f E n g i n e e r i n g R e s e a r c h a n d S p o r t s S c i e n c e Page 3
In the above equation Pri is the probability of ith
solution; max (fit) is the maximum fitness value among all the solutions; and fiti is the fitness value of ith solution. After
calculating the probability of ith solution, the onlooker bee would check whether Pri>rand, where rand is a randomly
generated number between zero and one. If it so, the onlooker bee would produce a new solution instead of this ith solution. The new solution is formed based on the operation performed by the employed bee i.e. based on
S
ijnew calculation. Then itwould calculate the fitness (nectar amount) for the newly generated solution and compare with the old one. If the fitness of the newly formed solution is better than the old one, it would memorize the new one and forgets the old one.
F. Scout Bee Operation
The food source of which the nectar is abandoned by the bees is replaced with a new food source by the scouts i.e. the solutions which are not altered by any one of operations (which are employed bee operation and onlooker bee operation) is replaced by a new solution using scout bees. Consider ith solution is not altered using either of employed bee operation and onlooker bee operation, the scout bee operation is performed on the ith solution can be found out from eq (2.5):
In the eq(2.5) Sji is the jth centroid of ith solution;
j
S
min is the minimum jth centroid value among all the solutions; rand (0, 1) is the random value between 0 and 1; andS
maxj is the maximum jth centroid value among all the solutions. The scout bee operation is performed only if there has any abandoned solution. ABC operation is repeated until the iteration number set and a solution that has best fitness in the final iteration is taken for the FCM operation.2.3 Classification
The feature extraction process is done in the same way as in the training phase on each merged group i.e. the H, S, L, T, A, B, U and V layers are extracted from each merged group to calculate the feature values. The feature values from the feature extraction process of each merged group are then given to the trained neural network to classify the regions. In our training process we use three neural networks to classify the regions. The process of classification is as follows: the feature value of the first merged group is given to the first neural network to check whether it has building region or not, because the first neural network is trained to identify building region. If not, the feature value is then given to the second neural network to check whether it has road region, because the second neural network is trained for road region. If not, the feature value is given to the third neural network to check whether it has shade region, because the third neural network is trained for shade region. If not, the system would take it as
tree region. Similarly, the feature value obtained for each merged group is given to the trained neural network to classify the regions.
III. EVALUATION OF CLASSIFIER'S PERFORMANCE
The performance of proposed improved FCM technique is compared with the existing clustering algorithms in terms of external metrics and internal metrics using satellite images. These matrices are:
3.1 Accuracy
The evaluation of proposed technique in different satellite images are carried out using accuracy which is given by eq(3.4)
3.2 DB-index
The Davies Bouldin (DB) Index is a metric exploited to evaluate the clustering algorithm. The DB-Index is an internal evaluation scheme that validates how well the cluster is done based on the quantities and features inherent to the dataset. The DB-Index calculation is as follows:
In the above equations, N denotes total number of clusters, dn,n+1 denotes clustering scheme measurement between each
cluster, dn denotes the value of distance between each data in
the nth cluster and centroid of that cluster, dn+1 denotes the
value of distance between each data in the next cluster and the centroid of nth cluster, M denotes sum of the Euclidean distance between each centroid, T is the total number of data in the cluster, X is the data in the nth cluster and Cn is the
centroid of nth cluster.
3.3 XB-Index
The Xie Beni Index (XB-index) is the ratio of within cluster compactness to the minimum separation of clusters. It is defined using eq.(3.3):
In the above equation E denotes sum of Euclidean distance between the centroids and its respective data; and g is the total number of data; and h is the minimum distance between the centroids. It is shown by an eq .(3.4) :
I n t e r n a t i o n a l J o u r n a l o f E n g i n e e r i n g R e s e a r c h a n d S p o r t s S c i e n c e Page 4
compares the distance between each centroid and it would choose the minimum distance value.
3.4 Mean Square Error
The Mean Square Error (MSE) for a clustering is taken by summing the least distance value between the centroid and data of each cluster. The best cluster would have the nearest data of the centroid in it. It is defined using eq(3.5).
Where b=1, 2, ….,T
In the above equation N is the total number of clusters, Xb is the bth data in nth cluster, Cn is the centroid of nth
cluster and T is the total number of data in the nth cluster.
IV. RESULTS AND DISCUSSION
This section delineates the results obtained for our proposed technique compared with the existing segmentation techniques. The performances are compared in terms of external metrics and internal metrics. The external metric is accuracy performs the evaluations based on ground truth. The internal metrics are Davies–Bouldin (DB) index, Xie-Beni (XB) validity index and Mean Square Error (MSE) performs the evaluations without ground truth. The performance of proposed technique is compared with the existing segmentation algorithms such as FCM, ABC algorithm, and MFCM algorithm in terms of external metrics and internal metrics using different satellite image. The table 4.1 shows the accuracy obtained for proposed technique compared to the existing techniques.
Table 4.1: Accuracy values of trees, shades, roads and buildings region classification
Table 4.1 shows the comparison of accuracy values of trees, roads, buildings and shades regions using proposed technique and other techniques like FCM and ABC. First row of table 4.1 indicates the ABC-FCM has better performance compared to other techniques.
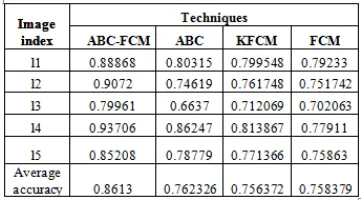
The same algorithm is tested for fifty different types of satellite images i.e. low medium and highly densed areas and accuracies are calculated for different regions. Table 4.2 shows trees regions accuracies for fifty different types of images. In this table first column shows image index and columns 2-5 show the accuracies of ABC-FCM, ABC and FCM respectively. Last row of this table shows the average accuracy for proposed algorithm is 86.13% which is highest compared to other existing techniques.
Table 4.2: Comparison of accuracy values of trees regions classification of five different images
Table 4.3 shows the comparison of roads regions accuracies for five different types of images. In this table first column shows image index and columns 2-5 show the accuracies of ABC-FCM, ABC and FCM respectively. Last row of this table shows the average accuracy for proposed algorithm is 79.55% which is the highest compared to existing techniques.
Table 4.3: Comparison of accuracy values of roads regions classification of five different test images
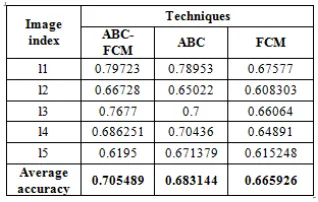
Table 4.4 shows buildings regions accuracies for five different types of images. In this table first column shows image index and columns 2-5 show the accuracies of ABC-FCM, ABC and FCM respectively. Last row of this table shows the average accuracy for proposed algorithm is 84.58% which is the highest compared to other existing techniques.
Table 4.4: Comparison of Accuracy values of buildings regions classification of five different test images
I n t e r n a t i o n a l J o u r n a l o f E n g i n e e r i n g R e s e a r c h a n d S p o r t s S c i e n c e Page 5 Table 4.5: Comparison of accuracy values of shades regions
classification of five different test images
In this section the performance comparisons of proposed algorithms by means of DB-index, XB-index and MSE for fifty different satellite images taken for experimentation. The better performances of these indices are judged based on less value of internal matrices. The tables 4.6, 4.7 and 4.8 show the values DB- index, XB-index and MSE respectively. The performance of proposed technique is compared to the existing techniques like ABC-FCM, FCM and ABC available in literature. Table 4.6 shows the DB-index values of different techniques for different test images. Less values DB-index indicates the better the clustering algorithm. The proposed algorithm has almost less DB-index except few images. Hence average DB-index is calculated to show the performances of proposed algorithm. The average DB-index of proposed algorithm has 0.385 which is smaller compared to existing algorithms.
Table 4.6: Comparison of performance of proposed algorithm based on DB-index for five different test images
Table 4.7 shows the XB-index values of different techniques for different test images. Less values XB-index indicates the better the clustering algorithm. The proposed algorithm has almost less index except few images. Hence average XB-index is calculated to show the performances of proposed algorithm. The average XB-index of proposed algorithm has 0.1643 which is small compared existing techniques.
Table 4.7: Comparison of performance of proposed algorithm based on XB-index for five different test images
Table 4.8 shows the MSE values of different techniques for different test images. Less values MSE indicates the better the clustering algorithm. The proposed algorithm has almost less MSE except few images. Hence
average MSE is calculated to show the performances of proposed algorithm. The average MSE of proposed algorithm has 0.058 which is smaller compared to other existing techniques.
Table 4.8: Comparison of performance of proposed algorithm based on MSE for five different test images
CONCLUSION
Satellite image analysis is an important area to analyze the geographical regions of the earth. The analysis of land, water, trees, roads and buildings on the earth has to be updated year after year to know the percentage of growth or percentage of reduction and percentage of occupation etc.. For this purpose satellite image segmentation and classification is necessary. Satellite image clustering provides an efficient analysis about the segments (land water, roads, buildings etc.). This is focused on the satellite image clustering by developing some numerical algorithms to analyze the satellite images captured by satellites. In this thesis it is aimed to enhance the classification accuracy. In this research work, three algorithms were proposed. Each approach goes through three phrases i.e. preprocessing, segmentation and classification. Clustering algorithms are used at segmentation stage. The clustering algorithms of ABC-FCM algorithm are used. Fuzzy C-mean (FCM) algorithm and biologically inspired artificial bee colony (ABC) search were developed to achieve the objective of improvement in clustering and classification performance. Towards the enhancement of accuracy, ABC is combined with FCM. The results obtained from proposed algorithm are compared with techniques like ABC-FCM, FCM and ABC. From the result analysis it is found that proposed algorithms have better results than literature which proved that proposed techniques are more efficient than other techniques available in the literature like FCM, KFCM, and ABC. After a study. ABC-FCM algorithm is working well for classifying buildings and trees regions. As far as internal metrics performance evaluation is concerned, ABC-FCM is performing better than other algorithms..
REFERENCES
[1] D. Karaboga, An idea based on honey bee swarm for numerical optimizat ion, technical Report TR06, Erciyes University, Engineering Faculty, Computer Engineering Department,. 2005 [2] F. Klawonn, and A. Keller. Fuzzy clustering with evolutionary algorithms. International Journal of Intelligent Systems, , 13: 975– 991. 1998
I n t e r n a t i o n a l J o u r n a l o f E n g i n e e r i n g R e s e a r c h a n d S p o r t s S c i e n c e Page 6 [4] B. Zhao, an Ant Colony Clustering Algorithm, Sixth International
Conference on Machine Learning and Cybernetics, Hong. Kong.. Pp.3933- 3938 2007.
[5] W. Liu, J. L. A clustering algorithm FCM-ACO for supplier base management. Lecture Notes in Computer Science including subseries Lecture Notes in Artificial Intelligence and Lecture Notes in Bioinformatics ics,. 6440 LNAIPART 1, 106-113. 2010
[6] A. Szabo, L.N.D. Castro, and M.R. Delgado, The proposal of a fuzzy clustering algorithm based on particle swarm. 2011 Third World Congress on Nature and Biologically Inspired Computing. IEEE.
[7] H. H Mohammed, “Unsupervised fuzzy clustering and image segmentation using weighted neural networks”, CIAP03308-313. 2003
[8] N.R Pal, and S.K Pal,” A review on image segmentation techniques”, Pattern Recognition, 926:1227-1294,1993
[9] L.A. Zadeh, Fuzzy sets, Inform. Control 8 338– 353, 1965 [10] D.W. Kim, K.H. Lee, and D. Lee, A novel initialization scheme for the fuzzy c-means algorithm for Color clustering Pattern Recognition letters, 25, No.2, pp.227- 237.January2004
[11] Lavika Goel,"Land Cover Feature Extraction using Hybrid Swarm Intelligence Techniques - A Remote Sensing Perspective," ACEEE Int. J. on Signal & Image Processing, Vol. 01, No. 03, Dec 2010.
[12] Navdeep Kaur Johal, Samandeep Singh, Harish Kundra, “Hybrid FPAB/BBO Algorithm for Satellite Image Classification,” International Journal of Computer Applications, pp.0975- 8887, Vol.6, No.5, September 2010.