M E T H O D O L O G Y
Open Access
MetaPro-IQ: a universal metaproteomic
approach to studying human and mouse
gut microbiota
Xu Zhang
1, Zhibin Ning
1, Janice Mayne
1, Jasmine I. Moore
1, Jennifer Li
1, James Butcher
1, Shelley Ann Deeke
1,
Rui Chen
1, Cheng-Kang Chiang
1, Ming Wen
1, David Mack
2*, Alain Stintzi
1*and Daniel Figeys
1*Abstract
Background:The gut microbiota has been shown to be closely associated with human health and disease. While next-generation sequencing can be readily used to profile the microbiota taxonomy and metabolic potential, metaproteomics is better suited for deciphering microbial biological activities. However, the application of gut metaproteomics has largely been limited due to the low efficiency of protein identification. Thus, a high-performance and easy-to-implement gut metaproteomic approach is required.
Results:In this study, we developed a high-performance and universal workflow for gut metaproteome identification and quantification (named MetaPro-IQ) by using the close-to-complete human or mouse gut microbial gene catalog as database and an iterative database search strategy. An average of 38 and 33 % of the acquired tandem mass spectrometry (MS) spectra was confidently identified for the studied mouse stool and human mucosal-luminal interface samples, respectively. In total, we accurately quantified 30,749 protein groups for the mouse metaproteome and 19,011 protein groups for the human metaproteome. Moreover, the MetaPro-IQ approach enabled comparable identifications with the matched metagenome database search strategy that is widely used but needs prior metagenomic sequencing. The response of gut microbiota to high-fat diet in mice was then assessed, which showed distinct metaproteome patterns for high-fat-fed mice and identified 849 proteins as significant responders to high-fat feeding in comparison to low-fat feeding.
Conclusions:We present MetaPro-IQ, a metaproteomic approach for highly efficient intestinal microbial protein identification and quantification, which functions as a universal workflow for metaproteomic studies, and will thus facilitate the application of metaproteomics for better understanding the functions of gut microbiota in health and disease.
Keywords:Gene catalog, Gut microbiota, Metaproteomics, Metagenomics, Protein identification, Quantification
Background
Intestinal microorganisms, namely the gut microbiota, have been shown to be important in multiple aspects of physiological processes relating to health and disease, in-cluding nutrition, metabolism, and immunity [1]. Host genetics and nutrition have been shown to affect the composition of gut microbiota; conversely, the microbial
metabolites or the microbes themselves can also regulate host metabolic processes [1–4]. Disruption of the homeo-stasis surrounding these host-microbe interactions has re-cently been shown to participate in the development of many diseases including obesity, diabetes, and inflamma-tory bowel disease (IBD) [1]. Therefore, the gut microbiota is emerging as an important topic for public health and scientific researchers.
Next-generation sequencing (NGS) has been widely applied in gut microbiota studies using various experimen-tal approaches [5]. Classically, NGS studies have focused on
* Correspondence:dfigeys@uottawa.ca;astintzi@uottawa.ca;DMack@cheo.on.ca
2Department of Paediatrics, CHEO Inflammatory Bowel Disease Centre and
Research Institute, University of Ottawa, Ottawa, ON, Canada
1Department of Biochemistry, Ottawa Institute of Systems Biology,
Microbiology and Immunology, Faculty of Medicine, University of Ottawa, Ottawa, ON, Canada
characterizing the taxonomic profile of the gut microbiota through targeted amplicon sequencing (e.g., 16S hypervari-able regions) or through shotgun metagenomics. More re-cently, NGS has been used to characterize the metabolic potential of the gut microbiota through metatranscriptomic analysis [6]. While these approaches are quite useful, they are unable to demonstrate that the predicted bio-logical processes are actually present in the gastrointes-tinal tract. Metaproteomics, which examines all the expressed proteins in a microbial community, has been shown to provide invaluable functional information for the gut microbiota [7]. Moreover, the application of proteomics and metaproteomics to host-gut microbe interactions will help to provide meaningful informa-tion on the roles of microbiota [8]. Although the first shotgun metaproteomic study of the gut microbiota was reported in 2009 [7], only few follow-up large-scale gut metaproteomic studies have been published. The reasons for this lack of progress have been discussed in several reviews [8–12] and include (1) the inability to detect low abundant proteins with current mass spec-trometers coupled to the high diversity of the gut micro-biota and, more importantly, (2) the low efficiency in identifying gut microbial peptide or proteins from ac-quired mass spectrometry (MS) spectra. The latter is mainly due to the lack of a suitable database (in terms of database coverage and size) for peptide-spectra matching (PSM) which is the key step for current bottom-up proteomic studies.
The ideal database for proteomics should be composed of all potentially expressed proteins in samples being an-alyzed with no additional spurious sequences; however, this is challenging for gut metaproteomics due to the enormous diversity and individual variations of gut microbiome [12]. The NCBI nr database is often used in metaproteomics due to its high sequence coverage. Unfortunately, its enormous size (~80 million entries) makes the database searching extremely time consuming and also provides less sensitive peptide identifications when using target-decoy approach for false discovery rate (FDR) filtering [13]. To overcome these weaknesses, cus-tomized databases are often employed and are composed of a list of known gut microbial genomes that are manu-ally chosen and combined to generate a synthetic meta-genome database [14–16]. However, it is unclear how representative these synthetic metagenome databases are as compared to the actual metagenome since many intes-tinal microbes are un-cultivable and/or their genomes have not been sequenced. In addition, the researcher’s choice of which bacteria taxa to include in the database is often arbitrary and may result in biases, which also makes the cross-study comparisons difficult. An alternative to manually curating a custom database is using a matched metagenome database. Briefly, either a “representative”
subset or all the samples being investigated are subjected to metagenomic sequencing to compile a database of genes [14]. Since metagenomic sequencing introduces additional costs, it has not been generally performed in currently reported metaproteomic studies. These chal-lenges have undoubtedly contributed to the fact that most metaproteomic publications only identify around 3000 proteins, which is far less than expected. Recently, Jagtap et al. [13] proposed a two-step database search strategy where a first search is performed against the target-only version of a database to generate a smaller refined database, which is then used for a second clas-sical target-decoy database search [17]. This has been shown to increase the sensitivity of peptide identifica-tion and greatly increase the number of peptides and proteins identified. In a recent study by Tanca et al. [18] over 13,000 peptides corresponding to 9000 pro-teins were identified for mouse cecum samples by combining a matched metagenome database with the aforementioned two-step strategy. To the best of our knowledge, this is the highest protein identification for a single gut metaproteomic study to date. However, as mentioned above, the matched metagenome approach suffers from the need for metagenomic sequencing and the differences of databases used in different studies. Thus, a comprehensive gut microbial gene or protein database, which covers the expressed proteins for all gut microbial species, will make gut metaproteomics more affordable, comprehensive and comparable, which will largely pro-mote wide application of metaproteomics in microbiome studies.
Results and discussion
Implementation of the MetaPro-IQ workflow for gut microbiota study
In this study, we developed a high-performance meta-proteomic workflow for enhanced gut microbial protein identification and quantification, namely MetaPro-IQ, using the close-to-complete human and mouse gut mi-crobial gene catalog databases and iterative database search strategy. The implementation of MetaPro-IQ ap-proach is illustrated in Fig. 1 and detailed as follows. Briefly, in the first step, a database search against the whole gene catalog database was performed to generate a “pseudo-metaproteome” database for each sample. A reduced database containing all possible proteins derived from peptide-spectrum matches was generated and hy-phenated with reversed sequence for each sample and used for the second step, a typical target-decoy database search [17]. The confidently identified peptide and pro-tein lists were then generated by applying strict filtering based on a FDR of 0.01, which is widely accepted for proteomic identifications. To obtain accurate and nor-malized quantitation information for all of the identified proteins across samples, the resulting protein lists for all samples were combined and de-duplicated to generate a “combined non-redundant database.” The latter was
then imported into MaxQuant software for protein quantification using advanced MaxLFQ algorithms [22].
A gene/protein database is typically needed for the purpose of peptide identification and is readily available for most model organisms. A typical proteome database contains 5000–20,000 entries which leads to a reason-able database search time and FDR filtering sensitivity [17]. However, the gut microbiota consists of thousands of microbial species and most of them are remain largely unknown or lack any available genome or proteome se-quences [23]. This makes the gut metaproteomic studies much more challenging. Therefore, in this study, we used the newly generated, well-annotated gut microbial gene catalog databases (available from http://meta.gen-omics.cn/ and http://gigadb.org/) [20, 24], to improve the database coverage for the gut microbial proteins. The hu-man gut microbial gene catalog contains 9.9 million genes generated from >1200 metagenomic sequencing samples [20], and the mouse gut microbial gene catalog contains 2.6 million genes generated from 184 sequenced mouse samples of diverse genetic and environmental back-grounds [24]. These databases are the most comprehen-sive for human and mouse gut microbial genes to date, and more importantly, the application of these gene cata-log databases allows the generation of unified protein lists from different studies, thus enabling easy cross-study comparisons. The latter is also one of the important disad-vantages for the current gut metaproteomic studies as aforementioned.
The sizes of the abovementioned gene catalog data-bases are large (>106entries), which will greatly limit the database search sensitivity [13]. Iterative database search strategy has been previously shown to increase the sensi-tivity of peptide identification using huge databases, par-ticularly for the metaproteomics and proteogenomics [13]. Thus, the MetaPro-IQ conducted a first-step data-base search against the whole gene catalog datadata-base, which generated a reduced database from the original gene catalog based on the acquired MS spectra in a sam-ple. The reduced database was then used for a classical target-decoy database search to obtain confident peptide/ protein identifications [13, 17].
In addition to the peptide/protein identification, quan-tification is another important aspect for proteomics. Spectra counting-based label-free quantification had been used for protein quantitation in many previous gut metaproteomic studies [7, 14, 15]. However, for data generated from high-resolution mass spectrometers, such as orbitraps, precursor-intensity-based algorithms have been shown to have superior accuracy, particularly when dynamic exclusion is enabled for spectra selection [22, 25]. MaxQuant is a widely used quantitative proteomics soft-ware implemented with the advanced MaxLFQ algorithm, which is based on precursor signal intensity and advanced
delaying normalization across samples [22]. The MetaPro-IQ approach adopted MaxQuant for the final-step quanti-fication analysis, which enabled accurate quantiquanti-fications of the identified microbial proteins.
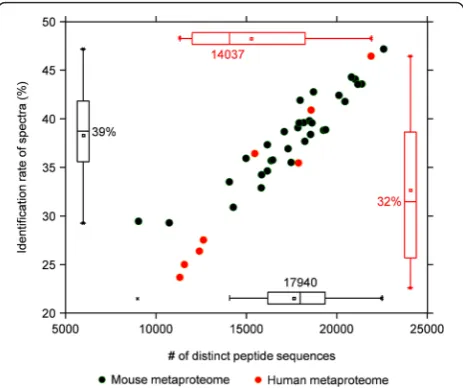
We then applied the MetaPro-IQ approach on two distinct datasets. The first dataset was from a mouse metaproteomic study wherein a total of 32 stool samples were collected from either high-fat diet (HFD)- or low-fat diet (LFD)-fed mice. The bacteria from stool samples were then processed, trypsin digested, and subjected to a 4-h gradient MS run for each sample on the Q Exactive mass spectrometer. A total of 121,588 distinct peptide sequences and 30,749 protein groups were quantified with a median of 17,940 peptide identifications for each sample (39 % of the total acquired tandem MS spectra, Fig. 2). The second dataset was generated from human mucosal-luminal interface (MLI) samples. Briefly, the MLI samples were collected during endoscopy, from the ascending colon of eight different children. The bacteria were isolated, processed, and subjected to the same MS analysis as described for the mouse metaproteome study. We quantified 67,186 distinct peptides corresponding to 19,011 protein groups, with a median identification rate of 32 % (23–46 %) and 15,210 peptide sequences (11,310–21,889) for each sample (Fig. 2 and Additional file 1: Table S2). To our best knowledge, the results we obtained represent the largest number of gut microbial
peptide and protein identifications from a single experi-ment. In addition, the MS identification rate in our study is comparable to those achieved in mono-culture micro-bial proteomic studies [15, 26].
MetaPro-IQ reached comparable performance with matched metagenome strategy
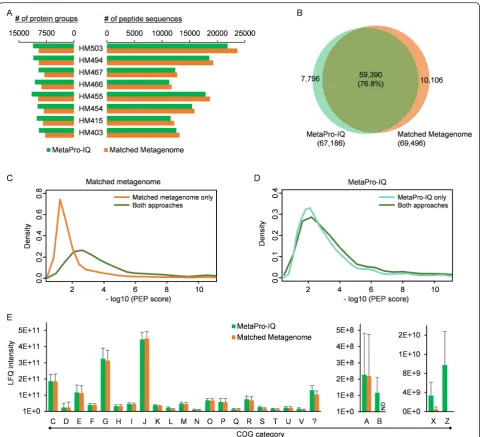
Matched metagenome database has been shown to be a good choice for metaproteomic study with reasonable database size and coverage [14, 18], although this approach suffers from the need for metagenomic sequencing. The current workflow aimed to skip the need for metagenomic sequencing and instead generate a database akin to a pseudo-expressed metagenome with the current MS sam-pling sensitivity. To evaluate whether similar performance could be reached to the matched metagenome strategy, we conducted metagenomic sequencing for all the eight hu-man MLI samples. A total of 243 million high-quality paired-end 100-bp Illumina sequencing reads were gener-ated (25–35 million paired-end reads for each sample, Additional file 1: Table S3). The genes were then predicted using the previously established MOCAT pipeline [27], which generated an average of 119,777 non-redundant genes per sample (Additional file 1: Table S3). The resulting genes for each sample were then used for matched meta-genome database searches for peptide/protein identifica-tion. The matched metagenome strategy quantified 69,496 peptide sequences corresponding to 16,415 protein groups for the whole dataset (Additional file 1: Table S2). As men-tioned above, the MetaPro-IQ approach using the human gut microbial gene catalog database quantified 67,186 pep-tide sequences corresponding to 19,011 protein groups. The average identification rate of the acquired MS spectra was 34 and 33 % for the matched metagenome and the MetaPro-IQ approaches, respectively. The MetaPro-IQ ap-proach identified comparable number of peptides but more protein groups for each of the samples (Fig. 3a). More than 76 % of the total identified peptide sequences were identi-fied by both approaches, with 13 % (10,106 peptides) of all the peptides only identified by the matched metagenome approach and 10 % (7796 peptides) only by MetaPro-IQ ap-proach (Fig. 3b). Among the peptides only identified with the matched metagenome approach, 75 % (7554 peptides) were present in the whole gene catalog database. However, further examination of these peptides revealed an obvious lower quality of identification (represented as posterior error probability (PEP) scores) as compared to those identi-fied with both approaches (Fig. 3c). Among the peptides only identified with MetaPro-IQ, 27 % (2106 peptides) of the peptides were present in the matched metagenome da-tabases. In contrast with the peptides only identified using matched metagenome approach, there was no obvious difference in PEP distribution for those only identified using MetaPro-IQ as compared to those identified by
both approaches (Fig. 3d). These findings suggest that the MetaPro-IQ workflow using the gene catalog database performed better for peptide and protein identification than the workflow using the matched metagenome database.
To compare the abilities of the two approaches for extracting functional information, all the quantified pro-teins were annotated with Clusters of Orthologous Group (COG) categories. Twenty-three COG categories were observed with the matched metagenome approach,
which were all found with the MetaPro-IQ approach. There is no obvious difference in the relative abundance of the high abundant COG categories between the two approaches (Fig. 3e). Several COG categories such as B, Z, and X were solely present or with obviously higher observed LFQ intensity using the MetaPro-IQ approach (Fig. 3e). This may result from the lack of low abundant genes in matched metagenome databases due to inad-equate sequencing depth. The low abundant genes may have relatively high protein-expression levels which are
detectable using mass spectrometers, and thereby were identified by MetaPro-IQ approach.
To examine whether the above observations are data-set dependent, the murine fecal metaproteome datadata-set (MFM; two replicates with two runs for each replicate) from the study of Tanca et al. [18] were re-analyzed with the MetaPro-IQ workflow. In total, we quantified 19,497 peptides and 4549 protein groups for replicate 1 and 19,972 peptides and 4630 protein groups for replicate 2. More than 92 % of the peptides were quantified for both replicates (Additional file 2: Figure S1A). Tanca et al.’s study, using a matched metagenome database search strategy, identified 14,085 peptides for replicate 1 and 15,669 peptides for replicate 2 with an overlap of 63 % [18]. Compared to the matched metagenome strategy, the MetaPro-IQ workflow identified more peptides with a better overlap between replicates for their dataset. In addition, a Pearson’s correlation coefficient of 0.89 was obtained between the two replicates, and more than 0.86 between runs (two mass spectrometry runs were con-ducted for each replicate in Tanca et al.’s study, Additional file 2: Figure S1B–F), which is also in agreement with the findings in their study.
Taken together, the MetaPro-IQ metaproteomic work-flow using the gut microbial gene catalog database showed better performance for identifying gut microbial proteins, when compared to the workflow using a matched metagen-ome database. MetaPro-IQ allows high efficient protein identification from MS spectra in metaproteomics without the need for prior metagenomic sequencing (greatly re-duces the experimental cost) and is readily applicable for all researchers from various disciplines.
MetaPro-IQ approach revealed metaproteome response of gut microbiota to diet in mice
The alteration of gut microbiota in HFD-fed animals has been considered to be involved in the development of HFD-induced metabolic disorders [28]; however, the mechanism remains unclear. In-depth metaproteomic analysis of the functional changes in the microbiota dur-ing HFD feeddur-ing may provide valuable information on diet-microbiota-host interactions. Thus, in this example, the response of the gut microbiota to diet in mice was studied using the MetaPro-IQ metaproteomic approach. Briefly, eight mice were fed with either HFD or LFD for 43 days. As expected, the HFD-fed mice gained sig-nificantly more body in 4 weeks (Additional file 2: Figure S2). Stool samples were collected at days 0, 14, 29, and 43 of the trial and subjected to metaproteomic ana-lysis. In total, we quantified 30,749 protein groups from 32 samples, and a large overlap between the HFD and LFD groups for both quantified peptides (88 %) and protein groups (92 %) was observed (Fig. 4a, b). Relatively fewer unique peptides and proteins were quantified in HFD
groups compared to the LFD groups, which might be due to the reduced microbial diversity in HFD-fed mice [29]. The principal component analysis (PCA) score plot showed three obvious clusters corresponding to the base-line, HFD-fed mice, and LFD-fed mice (Fig. 4c). The HFD and LFD diets are matched in terms of ingredients with different proportions of fat (Additional file 1: Table S4) and are different from the normal chow diet used at the baseline. Since the samples from days 14, 29, and 43 clustered closely together under both HFD and LFD feeding conditions (Fig. 4c), the data for each group at days 14, 29, and 43 were combined and compared to identify key proteins relevant to dietary fat composition, using a two-samplettest with a Benjamini-Hochberg FDR correction. A total of 849 significantly changed proteins (q< 0.05) were identified with 438 increased and 411 de-creased, respectively, in the HFD group compared to LFD group (Fig. 4d and Additional file 1: Table S5). Among these 849 significantly changed proteins, 583 proteins were found to be significantly different between baseline and HFD-fed mice and 246 between baseline and LFD-fed mice (Additional file 1: Table S5). Hierarchical clustering analysis with those key proteins showed that the samples from the same mouse clustered together in the LFD group, while this was not the case in the HFD group (Fig. 4d). In addition, the metaproteome patterns of LFD-fed mice clustered with the normal-chow-diet-LFD-fed mice (baseline), far apart from the HFD groups, which also sug-gest that the identified significant proteins might be re-lated to the dietary fat composition. COG analysis showed that the most abundant COG categories were G (carbohydrate transport and metabolism), C (energy production and conversion), and J (translation, riboso-mal structure, and biogenesis) in both HFD- and LFD-fed mouse microbiota (Additional file 2: Figure S3), which is in agreement with previous studies [15]. Among the 23 COG categories, category O (posttrans-lational modification, protein turnover, chaperones) was significantly increased in HFD group, while cat-egory S (function unknown) was significantly decreased (Additional file 2: Figure S3). Protein posttranslational modifications have been considered to present under various pathological conditions or following exposure to toxic agents in cells [30]. Our findings suggest that the microbiota in the gut of the HFD-fed mice may ex-perience substantial stress from either the host or the diet, which may be an important part of the disrupted homeostasis of diet-microbiota-host interactions during high-fat feeding.
and S-Fe7_GL0107273 were the most markedly changed proteins with more than 1000-fold decrease in the HFD group, and both of them were annotated as hypothetical proteins from Eubacterium plexicaudatum (Additional file 1: Table S6). Further examination of peptide identifi-cations revealed that protein S-Fe9_GL0178463 had high-quality PSMs (scores up to 323) in all samples in the LFD group, but no PSM was obtained for HFD groups (Additional file 2: Figure S4). The MaxQuant software has been designed to identify and quantify pep-tides from precursor ions without any MS/MS scan, by matching to the high-quality PSMs in paralleled samples based on retention time and mass-to-charge (m/z) ratio [22]. This resulted in an average of three peptides quan-tified for the samples in HFD group (Additional file 2: Figure S4). The lack of PSM for protein S-Fe9_GL0178463 in the HFD group might be the result of low protein levels in the samples, such that their precursor ions were not abundant enough to be selected by mass spectrometer for
fragmentation. However, the precursor ions were still present allowing accurate quantification and thereby selection of key proteins with huge differences between the different groups. This scenario, where certain pep-tides/proteins are almost totally absent from a single group, is expected to be common in gut microbial stud-ies, where some species may be substantially inhibited by other species or environmental compounds in one group as compared to another.
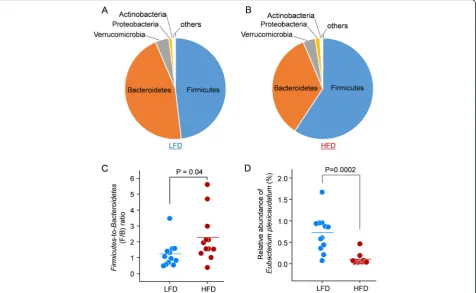
Taxonomy analysis was performed using the unique peptide-based approach as described previously [31, 32]. In agreement with previous metaproteomic and metage-nomics studies [15, 18, 33], Firmicutes, Bacteroidetes,
Verrucomicrobia, Proteobacteria, and Actinobacteria were the most abundant phyla in mouse stool (Fig. 5a, b). The
Firmicutes-to-Bacteroidetes(F/B) ratio was significantly in-creased in HFD-fed mice (Fig. 5c), which was also in agree-ment with previous metagenomic studies [34]. A total of 595 unique peptides were found for E. plexicaudatum,
which was identified to have two proteins with a >1000-fold decrease in the HFD group. The relative abundance of this species, which was represented as the sum intensity of all the unique peptides, was also significantly decreased in the HFD group by sevenfold compared to the LFD group (Fig. 5d).E. plexicaudatumis a butyrate-producing bacter-ium [35], which has been shown to protect the integrity of the intestinal epithelium and exert anti-inflammatory ef-fects [28, 36, 37]. Butyrate-producing bacteria are reported to be decreased in HFD-fed animals and in some human diseases such as obesity and IBD [28, 36, 38, 39]. The current study suggests that the proteins S-Fe9_GL0178463 and S-Fe7_GL0107273 may participate in the response to HFD in Eubacterium, which is worthy of further investigation.
Conclusions
MetaPro-IQ approach provides a universal, easy, and high-performance metaproteomic workflow for studying human or mouse gut microbiota and dramatically im-proves microbial protein identification and quantifica-tion. The workflow was established based on the usage of the close-to-complete gut microbial gene catalog
database and an iterative database search. These enabled high protein-database coverage and better sensitivity for peptide identification. More importantly, it allows easy comparison for the results obtained from different studies. The MetaPro-IQ approach also makes matched metagenome sequencing unnecessary for general gut metaproteomic studies. Moreover, the workflow gener-ated quantitative results based on precursor intensity and advanced normalization method, which allows ac-curate comparison across samples.
The limitation of the MetaPro-IQ also happens to the gene catalog databases since they are mainly generated from stool samples and will not represent all types of intestinal microbiomes, for example, the biopsy micro-biomes. For uncommon samples, the gene catalog database could be enhanced with additional matched sample meta-genomic sequencings, and thus will improve the perform-ance of MetaPro-IQ. In addition, the current gut microbial gene catalog databases represent well for the gut-related bacteria and archaea; the studies focusing on other taxa such as fungi and virus will need further addition of their protein sequences or alternative databases. However, the concept of MetaPro-IQ is applicable for any research as
long as the gene catalog or reference protein database is available.
Methods
Mouse stool sample collection and processing
The animal experiments were performed at the Ottawa Hospital Research Institute and conducted in strict ac-cordance with the guidelines on the Care and Use of Ex-perimental Animals of Canadian Council on Animal Care (CCAC). The animal use protocol (2009-012) was approved by the Animal Care Committee at the Univer-sity of Ottawa. A total of eight male C57BL/6J mice (Charles River, Sherbrooke, QC) were housed individu-ally in the same room at 25 °C with a strict 12-h light/ dark cycle. Food and water were available ad libitum. Mice were acclimatized to the facility for 2 weeks and fed a normal chow diet (containing 18 % fat by energy; Harlan Laboratories, Inc., Madison, WI) and then ran-domly divided into two groups (n= 4/group). One group of mice was fed a high-fat diet (containing 39.7 % fat by energy; TestDiet, St. Louis, MO), and the other group a low-fat diet (containing 15.8 % fat by energy; TestDiet) for 43 days. Body weight for each mouse was monitored weekly. Stool samples were collected at days 0, 14, 29, and 43 and stored at−80 °C until analysis.
For proteomic analysis, bacterial proteins were ex-tracted from the stool samples. Briefly, stool samples (~1 g) were suspended in 1.5 mL ice-cold PBS (pH 7.0) with thorough vortexing. The slurries were centrifuged at 300g, 4 °C for 5 min. Supernatants were carefully collected, and the pellets were subjected to the above procedure three times. All the supernatants for each sample were then combined followed by three more centrifugations at 300g, 4 °C for 5 min to remove debris. The supernatant was then centrifuged at 14,000g, 4 °C for 20 min to pellet bacterial cells. The pellet was then re-suspended in fresh PBS and washed another three times. The bacterial cells were then lysed with 4 % sodium dode-cyl sulfate (SDS) and 6 M urea in 50 mM Tris-HCl buffer (pH 8.0) with sonication. SDS was removed by protein precipitation in acidified acetone/ethanol buffer at−20 °C overnight. The precipitated proteins were dissolved in 6 M urea in 50 mM ammonium bicarbonate (pH 8) for trypsin digestion.
Human MLI sample collection and processing
Eligible subjects were under 18 years of age and sched-uled to undergo diagnostic colonoscopy (Additional file 1: Table S1). The protocol was approved by the Re-search Ethics Board of the Children’s Hospital of Eastern Ontario (CHEO). Colonoscopy preparation was done as per standard protocol modified to 1 day [40]. During colon-oscopy, once the proximal ascending colon was intubated, any fluid and loose debris was aspirated and discarded.
Thereafter, sterile water was flushed onto the mucosa to dislodge adherent mucus from mucosal epithelial cells and the mixture was then aspirated into a sterile container through the colonoscope. The samples were immediately placed on ice and transported to the lab for processing.
To remove any debris in the aspirate sample, a first centrifugation at 700g, 4 °C for 5 min was performed and the supernatant was transferred into a new tube. The bacterial cells were then collected with a centrifuga-tion at 14,000g, 4 °C for 20 min. The pellets were then used for protein extraction according to the procedures described above.
Liquid chromatography-tandem mass spectrometry In-solution trypsin digestion for bacterial proteins recov-ered from both mouse stool and human MLI samples was conducted as described previously [41]. Briefly, the proteins were first reduced and alkylated with 10 mM dithiothreitol (DTT) and 20 mM iodoacetamide (IAA), respectively. The urea concentration was then diluted to <1 M with 50 mM ammonium bicarbonate. Trypsin (Worthington Biochemical Corp., Lakewood, NJ) was then added at a protein-trypsin ratio of 50: 1 (w/w) for digestion overnight with agitation at 37 °C. The tryptic digest was desalted with a 10-μm C18 column and eluted with 80 % acetonitrile/0.1 % formic acid. The eluent was then evaporated with a Speed-Vac concen-trator and tryptic peptides dissolved in 0.1 % formic acid for mass spectrometry analysis.
Tryptic peptides equivalent to 4 μg of proteins were loaded for liquid chromatography-tandem mass spec-trometry (LC-MS/MS) analysis on a Q Exactive mass spectrometer (ThermoFisher Scientific Inc.). The separ-ation of peptides was performed on an analytical column (75 μm × 50 cm) packed with reverse phase beads (1.9μm; 120-Å pore size; Dr. Maisch GmbH, Ammerbuch, Germany). A 4-h gradient was performed from 5 to 35 % acetonitrile containing 0.1 % formic acid at a flow rate of 200 nL/min. The instrument method consisted of one full MS scan from 300 to 1800m/z followed by data-dependent MS/MS scan of the 12 most intense ions, a dynamic exclusion repeat count of 2, and repeat exclusion duration of 30 s. All data were recorded with the Xcalibur software and exported as.raw format for further analysis.
Metagenomic DNA extraction, sequencing, and gene prediction
lysing solution (CLS)-TC and subjected to two mechan-ical lysis cycles at speed 6.0 for 40 s. The extracted DNA was then used to construct sequencing libraries using an Illumina TruSeq DNA Sample Prep kit v3 according to the manufacturer’s instructions. The sequencing was performed on an Illumina HiSeq 2000 (generating paired-end 100-bp reads) at the Génome Québec Innovation Centre, McGill University (Montreal, Canada).
Gene prediction was performed on each sample indi-vidually using the previously published MOCAT pipeline [27]. Briefly, raw reads were first filtered and trimmed to remove sequencing adapters and low quality reads. Reads with human origin were removed using SOAPAligner 2 against the human genome database (hg19) [42]. The remaining reads were then used for scaftig assembly and as-sembly revision to generate assembled sequences for gene prediction with the MetaGeneMark algorithm [43]. The resulting gene sequence lists for each of the sample were then compiled into FASTA files and used as a matched metagenome database for benchmarking MetaPro-IQ.
Bioinformatics for metaproteome data analysis
Implementation of MetaPro-IQ approach
The implementation of the MetaPro-IQ approach is illus-trated in Fig. 1 and details are highlighted in the “Results and discussion”section. The human and mouse gut micro-bial gene catalog databases were downloaded from the IGC website (http://meta.genomics.cn/) and the GigaScience Database (http://gigadb.org/dataset/view/id/100114/token/ mZlMYJIF04LshpgP), respectively [20, 24].
In MetaPro-IQ, the first- and second-step database searches were carried out with X! Tandem (release 2015.04.01) [44, 45], and the third step was carried out with MaxQuant software (version 1.5.2.8) [46]. For the X! Tandem database search, each raw file obtained in the current study or from Tanca et al.’s study (downloaded from PeptideAtlas Repository at http://www.peptideatla-s.org/PASS/PASS00355) was converted into mgf format with an in-house software platform. The tandem search was performed with up to two miss-cleavages (trypsin/P), carbamidomethylation of cysteine as a fixed modification, and oxidation of methionine as a potential modification. A fragment ion tolerance of 20 ppm and a parent ion toler-ance of 10 ppm were used. All matched protein sequences for the first-step search were extracted as the sample-specific database (sample_all-macth.fasta). The X! Tandem outputs of the target-decoy database search (step 2) were summarized with an in-house software to generate an identified protein list at a FDR cutoff of 0.01 and max-imum expect value of 0.05. The resulting protein list for all samples was then combined, and duplicates were re-moved for generating a “combined non-redundant data-base” to use for protein quantification using MaxQuant. Similar peptide identification parameters with X! Tandem
database searches were used for MaxQuant (parameter files were uploaded together with the raw data and result files to ProteomeXchange). For quantification, the LFQ al-gorithm was used for label-free quantification. Both razor and unique peptides were used for protein quantification, and the minimum ratio count was set as 1. An alignment retention time window of 20 min and match time window of 5 min were applied to match the same accurate masses between different runs. Proteins identified by the same set or a subset of peptides were grouped together as one protein group.
Matched metagenome database search strategy
Matched metagenome database searches were performed with exactly the same parameters as the MetaPro-IQ ap-proach, except that the metagenome database (gene se-quences) was used for each sample instead of the whole gene catalog database. To ensure a fair comparison, the same multi-step database search strategy and MaxQuant quantification was performed. The outputs of MaxQuant (namely the results included in the txt folder) were then compared between the matched metagenome and MetaPro-IQ approaches.
Functional annotation into COGs
All the quantified protein sequences were aligned against the COG database (ftp://ftp.ncbi.nih.gov/pub/ COG/COG2014/data) with DIAMOND using default parameters (e-value cutoff of 0.001) [47, 48]. The best hit for each query was selected for annotation, and the COG id, name, and category information for each of the matched sequences were extracted from the anno-tation file of the COG database. If the leading protein (defined as the top rank protein in a group; ranking is based on the number of peptide sequences, the num-ber of PSMs, and the sequence coverage) in a protein group had no match for COG id, the others were checked for the existence of any match. The LFQ in-tensity of all the protein groups annotated with the same COG category were summed together to repre-sent the COG category abundance for each sample.
Taxonomic analysis
Multivariate statistical analysis
The protein group results from MaxQuant were first imported into Perseus (version 1.5.2.4) to remove any contaminants, reverse sequences, and those identified only by site. The LFQ intensity was log10-transformed
and used for statistical analysis. Only those protein groups with valid LFQ intensity values in at least 29 of the 32 samples (>90 %) were kept for subsequent statis-tical and multivariate analysis. This resulted in a strin-gently quantified dataset of 5299 protein groups for the bacteria from 32 stool samples. Hierarchical clustering analysis was also conducted in Perseus with default pa-rameters. Significant proteins between HFD and LFD groups were identified by a two-samplettest with Benja-mini-Hochberg FDR correction. Those proteins with a FDR correctedpvalue (qvalue) of <0.05 were considered as significant proteins.
PCA was performed in MATLAB (version 2010b, The MathWorks Inc.), and the first two PCs were used for generating the score plot. A prior missing value imputation was done with the nearest-neighbor method in MATLAB with theknnimputefunction (http://www.mathworks.com/ help/bioinfo/ref/knnimpute.html) [49].
Additional files
Additional file 1: Tables S1–S7.Table S1.Clinical information of the eligible pediatric volunteers involved in the mucosal-luminal interface sample collection.Table S2.Comparison of peptide and protein identifications between the MetaPro-IQ and matched metagenome approaches.Table S3.Summary of metagenomic sequencing and gene prediction for pediatric mucosal-luminal interface samples.Table S4.
Ingredient comparison of high-fat and low-fat diets.Table S5.List of 849 significant proteins responding to the high-fat feeding.Table S6.Best hits of BLASTP alignments against NCBI nr database.Table S7.Names and one-letter codes for identified COG categories. (XLSX 611 kb)
Additional file 2: Figure S1–S4.Figure S1.Analysis of murine fecal metaproteome data in the study of Tanca et al. using MetaPro-IQ approach. (A) Venn diagrams depicting the overlap of identified peptides between the two replicates; (B) scatter plot illustrating the Pearson’s correlation between the LFQ intensity of all peptides identified in both replicates; (C) and (E) showing the overlap of identified peptides between two runs for replicate 1 and replicate 2, respectively; (D) and (F) showing the Pearson’s correlation between the LFQ intensity of all peptides identified in both runs for replicate 1 and replicate 2, respectively. Detailed information on the sample information of murine fecal metaproteome (MFM) data was described in the study of Tanca et al.Figure S2.Effects of diet on the mouse body weight gain. Statistical differences were examined with two-samplettest. Mean ± SD was shown. *p< 0.05.Figure S3.COG category distributions of mouse stool microbial proteins. The COG category distributions of all proteins were shown. LFQ intensity was used for the analysis, and mean ± SEM was plotted. Each letter shows one COG category according to the standard naming in NCBI website and also shown in Additional file 1: Table S7. Question mark (?) denotes proteins without a COG assignment. Statistical analysis was performed using a two-samplettest with a Benjamini-Hochberg FDR correction. ***FDR-correctedP< 0.001.Figure S4.MS/MS count and peptide distribution of protein S-Fe9_GL0178463. The number of identified MS/MS and peptides for each sample was shown in the bar chart. The yellow box highlighted the samples with peptide identification only by matching instead of by MS/MS. (DOCX 583 kb)
Abbreviations
COG, Clusters of Orthologous Groups; DTT, dithiothreitol; FDR, false discovery rate; HFD, high-fat diet; HMP, Human Microbiome Project; IAA, iodoacetamide; IBD, inflammatory bowel disease; LC-MS/MS, liquid chromatography-tandem mass spectrometry; LFD, low-fat diet; MetaHIT, Metagenomics of Human Intestinal Tract; MetaPro-IQ, metaproteome identification and quantification; MLI, mucosal-luminal interface; PCA, principal component analysis; PEP, posterior error probability; PSM, peptide-spectra matching; SDS, sodium dodecyl sulfate
Acknowledgements
We acknowledge the assistance of R. Singleton, A. Mack, and D. McCulloch in making this study possible.
Funding
This work was supported in part by the Genome Canada and the Ontario Genomics Institute (OGI-067), CIHR grant number GPH-129340, the Ontario Ministry of Economic Development and Innovation (REG1-4450), the Natural Sciences and Engineering Research Council of Canada (NSERC) council of Canada, and the Foundation Jean-Louis Lévesque. DF acknowledges a Canada Research Chair in Proteomics and Systems Biology. JB is the recipient of a CIHR/CAG Postdoctoral Award.
Availability of data and materials
The mass spectrometry proteomics data have been deposited to the ProteomeXchange Consortium (http://www.proteomexchange.org) via the PRIDE [50] partner repository with the dataset identifiers PXD003527 and PXD003528, and all the raw reads of Illumina sequencing have been submitted to NCBI sequence read archive (SRA) under the accession of SRP068619.
Authors’contributions
DF, AS, DM, and XZ designed the study. XZ, JM, JIM, JL, JB, SAD, and CKC performed the experiments. XZ, ZN, RC, and MW analyzed the data. XZ and DF wrote the manuscript, and all the authors contributed to the editing and revision of the manuscript. All authors read and approved the final manuscript.
Competing interests
The authors declare that they have no competing interests.
Consent for publication
Consent to publish was obtained from parents of all the children.
Ethics approval and consent to participate
The animal use protocol (2009-012) was approved by the Animal Care Committee at the University of Ottawa, ON, Canada. The clinical sample collection protocol was approved by the Research Ethics Board of the Children’s Hospital of Eastern Ontario (CHEO), Ottawa, ON, Canada. The consent to participate was obtained for all the participants.
Received: 3 February 2016 Accepted: 2 June 2016
References
1. Clemente JC, Ursell LK, Parfrey LW, Knight R. The impact of the gut microbiota on human health: an integrative view. Cell. 2012;148(6):1258–70. 2. Li M, Wang B, Zhang M, Rantalainen M, Wang S, Zhou H, Zhang Y, Shen J,
Pang X, Zhang M, et al. Symbiotic gut microbes modulate human metabolic phenotypes. Proc Natl Acad Sci U S A. 2008;105(6):2117–22. 3. Nicholson JK, Holmes E, Kinross J, Burcelin R, Gibson G, Jia W, Pettersson S.
Host-gut microbiota metabolic interactions. Science. 2012;336(6086):1262–7. 4. Backhed F, Ding H, Wang T, Hooper LV, Koh GY, Nagy A, Semenkovich CF,
Gordon JI. The gut microbiota as an environmental factor that regulates fat storage. Proc Natl Acad Sci U S A. 2004;101(44):15718–23.
5. Fraher MH, O'Toole PW, Quigley EM. Techniques used to characterize the gut microbiota: a guide for the clinician. Nat Rev Gastroenterol Hepatol. 2012;9(6):312–22.
7. Verberkmoes NC, Russell AL, Shah M, Godzik A, Rosenquist M, Halfvarson J, Lefsrud MG, Apajalahti J, Tysk C, Hettich RL, et al. Shotgun metaproteomics of the human distal gut microbiota. ISME J. 2009;3(2):179–89.
8. Mayne J, Ning Z, Zhang X, Starr AE, Chen R, Deeke S, Chiang CK, Xu B, Wen M, Cheng K, et al. Bottom-up proteomics (2013-2015): keeping up in the era of systems biology. Anal Chem. 2016;88(1):95–121.
9. Muth T, Benndorf D, Reichl U, Rapp E, Martens L. Searching for a needle in a stack of needles: challenges in metaproteomics data analysis. Mol Biosyst. 2013;9(4):578–85.
10. Muth T, Kolmeder CA, Salojarvi J, Keskitalo S, Varjosalo M, Verdam FJ, Rensen SS, Reichl U, de Vos WM, Rapp E, et al. Navigating through metaproteomics data: a logbook of database searching. Proteomics. 2015;15:3439–53. 11. Xiong W, Abraham PE, Li Z, Pan C, Hettich RL. Microbial metaproteomics for
characterizing the range of metabolic functions and activities of human gut microbiota. Proteomics. 2015;15(20):3424–38.
12. Lichtman JS, Sonnenburg JL, Elias JE. Monitoring host responses to the gut microbiota. ISME J. 2015;9(9):1908–15.
13. Jagtap P, Goslinga J, Kooren JA, McGowan T, Wroblewski MS, Seymour SL, Griffin TJ. A two-step database search method improves sensitivity in peptide sequence matches for metaproteomics and proteogenomics studies. Proteomics. 2013;13(8):1352–7.
14. Erickson AR, Cantarel BL, Lamendella R, Darzi Y, Mongodin EF, Pan C, Shah M, Halfvarson J, Tysk C, Henrissat B, et al. Integrated metagenomics/ metaproteomics reveals human host-microbiota signatures of Crohn’s disease. PLoS One. 2012;7(11):e49138.
15. Daniel H, Moghaddas Gholami A, Berry D, Desmarchelier C, Hahne H, Loh G, Mondot S, Lepage P, Rothballer M, Walker A, et al. High-fat diet alters gut microbiota physiology in mice. ISME J. 2014;8(2):295–308.
16. Kolmeder CA, de Been M, Nikkila J, Ritamo I, Matto J, Valmu L, Salojarvi J, Palva A, Salonen A, de Vos WM. Comparative metaproteomics and diversity analysis of human intestinal microbiota testifies for its temporal stability and expression of core functions. PLoS One. 2012;7(1):e29913.
17. Elias JE, Gygi SP. Target-decoy search strategy for increased confidence in large-scale protein identifications by mass spectrometry. Nat Methods. 2007;4(3):207–14.
18. Tanca A, Palomba A, Pisanu S, Deligios M, Fraumene C, Manghina V, Pagnozzi D, Addis MF, Uzzau S. A straightforward and efficient analytical pipeline for metaproteome characterization. Microbiome. 2014;2(1):49. 19. Qin J, Li R, Raes J, Arumugam M, Burgdorf KS, Manichanh C, Nielsen T,
Pons N, Levenez F, Yamada T, et al. A human gut microbial gene catalogue established by metagenomic sequencing. Nature. 2010; 464(7285):59–65.
20. Li J, Jia H, Cai X, Zhong H, Feng Q, Sunagawa S, Arumugam M, Kultima JR, Prifti E, Nielsen T, et al. An integrated catalog of reference genes in the human gut microbiome. Nat Biotechnol. 2014;32(8):834–41.
21. Human Microbiome Jumpstart Reference Strains C, Nelson KE, Weinstock GM, Highlander SK, Worley KC, Creasy HH, Wortman JR, Rusch DB, Mitreva M, Sodergren E, et al. A catalog of reference genomes from the human microbiome. Science. 2010;328(5981):994–9.
22. Cox J, Hein MY, Luber CA, Paron I, Nagaraj N, Mann M. Accurate proteome-wide label-free quantification by delayed normalization and maximal peptide ratio extraction, termed MaxLFQ. Mol Cell Proteomics. 2014;13(9):2513–26. 23. Costello EK, Lauber CL, Hamady M, Fierer N, Gordon JI, Knight R. Bacterial
community variation in human body habitats across space and time. Science. 2009;326(5960):1694–7.
24. Xiao L, Feng Q, Liang S, Sonne SB, Xia Z, Qiu X, Li X, Long H, Zhang J, Zhang D, et al. A catalog of the mouse gut metagenome. Nat Biotechnol. 2015;33:1103–8.
25. Zhou W, Liotta LA, Petricoin EF. The spectra count label-free quantitation in cancer proteomics. Cancer Genomics Proteomics. 2012;9(3):135–42. 26. Peng J, Elias JE, Thoreen CC, Licklider LJ, Gygi SP. Evaluation of
multidimensional chromatography coupled with tandem mass spectrometry (LC/LC-MS/MS) for large-scale protein analysis: the yeast proteome. J Proteome Res. 2003;2(1):43–50.
27. Kultima JR, Sunagawa S, Li J, Chen W, Chen H, Mende DR, Arumugam M, Pan Q, Liu B, Qin J, et al. MOCAT: a metagenomics assembly and gene prediction toolkit. PLoS One. 2012;7(10):e47656.
28. Zhang X, Zhao Y, Zhang M, Pang X, Xu J, Kang C, Li M, Zhang C, Zhang Z, Zhang Y, et al. Structural changes of gut microbiota during berberine-mediated prevention of obesity and insulin resistance in high-fat diet-fed rats. PLoS One. 2012;7(8):e42529.
29. Turnbaugh PJ, Backhed F, Fulton L, Gordon JI. Diet-induced obesity is linked to marked but reversible alterations in the mouse distal gut microbiome. Cell Host Microbe. 2008;3(4):213–23.
30. Song BJ, Akbar M, Abdelmegeed MA, Byun K, Lee B, Yoon SK, Hardwick JP. Mitochondrial dysfunction and tissue injury by alcohol, high fat, nonalcoholic substances and pathological conditions through post-translational protein modifications. Redox Biol. 2014;3:109–23. 31. Mesuere B, Devreese B, Debyser G, Aerts M, Vandamme P, Dawyndt P.
Unipept: tryptic peptide-based biodiversity analysis of metaproteome samples. J Proteome Res. 2012;11(12):5773–80.
32. Mesuere B, Debyser G, Aerts M, Devreese B, Vandamme P, Dawyndt P. The Unipept metaproteomics analysis pipeline. Proteomics. 2015;15(8):1437–42. 33. Zhang X, Zhao Y, Xu J, Xue Z, Zhang M, Pang X, Zhang X, Zhao L.
Modulation of gut microbiota by berberine and metformin during the treatment of high-fat diet-induced obesity in rats. Sci Rep. 2015;5:14405. 34. Turnbaugh PJ, Ley RE, Mahowald MA, Magrini V, Mardis ER, Gordon JI. An
obesity-associated gut microbiome with increased capacity for energy harvest. Nature. 2006;444(7122):1027–31.
35. Wilkins TD, Fulghum R, Wilkins J. Eubacterium plexicaudatum sp. nov., an anaerobic bacterium with a subpolar tuft of flagella, isolated from a mouse cecum. Int J Syst Bacteriol. 1974;24(4):408–11.
36. Sokol H, Pigneur B, Watterlot L, Lakhdari O, Bermudez-Humaran LG, Gratadoux JJ, Blugeon S, Bridonneau C, Furet JP, Corthier G, et al. Faecalibacterium prausnitzii is an anti-inflammatory commensal bacterium identified by gut microbiota analysis of Crohn disease patients. Proc Natl Acad Sci U S A. 2008;105(43):16731–6.
37. Kanauchi O, Fukuda M, Matsumoto Y, Ishii S, Ozawa T, Shimizu M, Mitsuyama K, Andoh A. Eubacterium limosum ameliorates experimental colitis and metabolite of microbe attenuates colonic inflammatory action with increase of mucosal integrity. World J Gastroenterol. 2006;12(7):1071–7. 38. Qin J, Li Y, Cai Z, Li S, Zhu J, Zhang F, Liang S, Zhang W, Guan Y, Shen D,
et al. A metagenome-wide association study of gut microbiota in type 2 diabetes. Nature. 2012;490(7418):55–60.
39. Wang W, Chen L, Zhou R, Wang X, Song L, Huang S, Wang G, Xia B. Increased proportions of Bifidobacterium and the Lactobacillus group and loss of butyrate-producing bacteria in inflammatory bowel disease. J Clin Microbiol. 2014;52(2):398–406.
40. Jimenez-Rivera C, Haas D, Boland M, Barkey JL, Mack DR. Comparison of two common outpatient preparations for colonoscopy in children and youth. Gastroenterol Res Pract. 2009;2009:518932.
41. Chen R, Seebun D, Ye M, Zou H, Figeys D. Site-specific characterization of cell membrane N-glycosylation with integrated hydrophilic interaction chromatography solid phase extraction and LC-MS/MS. J Proteomics. 2014;103:194–203.
42. Li R, Yu C, Li Y, Lam TW, Yiu SM, Kristiansen K, Wang J. SOAP2: an improved ultrafast tool for short read alignment. Bioinformatics. 2009;25(15):1966–7. 43. Zhu W, Lomsadze A, Borodovsky M. Ab initio gene identification in
metagenomic sequences. Nucleic Acids Res. 2010;38(12):e132. 44. Fenyo D, Beavis RC. A method for assessing the statistical significance of
mass spectrometry-based protein identifications using general scoring schemes. Anal Chem. 2003;75(4):768–74.
45. Craig R, Beavis RC. TANDEM: matching proteins with tandem mass spectra. Bioinformatics. 2004;20(9):1466–7.
46. Cox J, Mann M. MaxQuant enables high peptide identification rates, individualized p.p.b.-range mass accuracies and proteome-wide protein quantification. Nat Biotechnol. 2008;26(12):1367–72.
47. Buchfink B, Xie C, Huson DH. Fast and sensitive protein alignment using DIAMOND. Nat Methods. 2015;12(1):59–60.
48. Galperin MY, Makarova KS, Wolf YI, Koonin EV. Expanded microbial genome coverage and improved protein family annotation in the COG database. Nucleic Acids Res. 2015;43(Database issue):D261–9.
49. Webb-Robertson BJ, Wiberg HK, Matzke MM, Brown JN, Wang J, McDermott JE, Smith RD, Rodland KD, Metz TO, Pounds JG, et al. Review, evaluation, and discussion of the challenges of missing value imputation for mass spectrometry-based label-free global proteomics. J Proteome Res. 2015;14(5):1993–2001. 50. Vizcaino JA, Csordas A, Del-Toro N, Dianes JA, Griss J, Lavidas I, Mayer G,
![Fig. 1 Overview of the MetaPro-IQ approach. The human or mousegut microbial gene catalog is freely downloadable online [20, 24].For the first two steps of the database search, each of the sampleswas processed individually](https://thumb-us.123doks.com/thumbv2/123dok_us/9076408.1900172/3.595.56.292.409.656/overview-metapro-approach-microbial-downloadable-sampleswas-processed-individually.webp)