R E S E A R C H A R T I C L E
Open Access
Allele-specific disparity in breast cancer
Fatemeh Kaveh
1, Hege Edvardsen
1, Anne-Lise Børresen-Dale
1,2, Vessela N Kristensen
1,2,3*and Hiroko K Solvang
1,4Abstract
Background:In a cancer cell the number of copies of a locus may vary due to amplification and deletion and these variations are denoted as copy number alterations (CNAs). We focus on the disparity of CNAs in tumour samples, which were compared to those in blood in order to identify the directional loss of heterozygosity.
Methods:We propose a numerical algorithm and apply it to data from the Illumina 109K-SNP array on 112 samples from breast cancer patients. B-allele frequency (BAF) and log R ratio (LRR) of Illumina were used to estimate Euclidian distances. For each locus, we compared genotypes in blood and tumour for subset of samples being heterozygous in blood. We identified loci showing preferential disparity from heterozygous toward either the A/B-allele homozygous (allelic disparity). The chi-squared and Cochran-Armitage trend tests were used to examine whether there is an association between high levels of disparity in single nucleotide polymorphisms (SNPs) and molecular, clinical and tumour-related parameters. To identify pathways and network functions over-represented within the resulting gene sets, we used Ingenuity Pathway Analysis (IPA).
Results:To identify loci with a high level of disparity, we selected SNPs 1) with a substantial degree of disparity and 2) with substantial frequency (at least 50% of the samples heterozygous for the respective locus). We report the overall difference in disparity in high-grade tumours compared to low-grade tumours (p-value < 0.001) and significant associations between disparity in multiple single loci and clinical parameters. The most significantly associated network functions within the genes represented in the loci of disparity were identified, including lipid metabolism, small-molecule biochemistry, and nervous system development and function. No evidence for over-representation of directional disparity in a list of stem cell genes was obtained, however genes appeared to be more often altered by deletion than by amplification.
Conclusions:Our data suggest that directional loss and amplification exist in breast cancer. These are highly associated with grade, which may indicate that they are enforced with increasing number of cell divisions.
Whether there is selective pressure for some loci to be preferentially amplified or deleted remains to be confirmed.
Background
Higher organisms such as humans are diploid, which means that all chromosomes except the sex chromo-somes are present in two copies (2 n). During DNA replication, unique genomic segments of original DNA are normally copied just one time, but in specific situa-tions, these fragments are either not replicated entirely or they are copied more than once. The variation between normal and actual copy number of a DNA seg-ment is referred to as copy number differences, which in normal cells are referred to as copy number varia-tions (CNVs) and in tumour cells as copy number
alternations (CNAs) [1]. Such chromosomal variations have been associated with genetic disorders (for CNVs) and the progression of cancer (for CNAs) [2]. The size of CNVs in normal tissues is often shorter than CNAs in tumour tissues, which can cover a large region of the human genome (Mb) [3]. Array-based comparative genomic hybridization (CGH) is used for detection of CNVs and CNAs [4,5].
Recently, new techniques have been developed to study CNVs and CNAs at a higher resolution using high-density arrays of single nucleotide polymorphisms (SNPs) [6]. SNPs are variations in the single-base locus of the genome within members of a species or paired chromosomes of an individual. In general, SNPs have precise positions on the chromosome and two alleles (maternal and paternal), and SNP-based arrays are
* Correspondence: v.n.kristensen@medisin.uio.no
1
Department of Genetics, Institute for Cancer Research, Norwegian Radium Hospital, Oslo University Hospital, Oslo, Norway
Full list of author information is available at the end of the article
powerful tools for detection of allele-specific chromoso-mal aberrations and loss of heterozygocity (LOH) status [7]. Recent advances in the systematic study of genomic alterations in human cancer samples have made it possi-ble to understand this disease better and identify key genes with underlying roles in oncogenesis [8]. In the present study, we describe the development of a numer-ical algorithm based on Euclidian distances to extract the maximum level of information from SNP array data in blood-tumour pairs, with regard to both chromoso-mal aberrations and loss of heterozygosity. We apply the algorithm to Illumina 109K SNP array data and show how it can be used to mine information on a single-SNP, cytogenic region as well as in gene lists and at the pathway level. We focus on the disparity of CNAs in tumour samples, which were compared to those in blood in order to identify the directional loss of heterozygosity.
Methods
Materials
The 112 samples used here are a subset of a larger patient series consisting of 920 samples, which were col-lected from breast cancer patients to study the effect of disseminating tumour cells to the blood and bone mar-row [9]. The samples were collected at five different hos-pitals in the Oslo region and have so far been extensively studied on both the clinical and biological levels [9,10].
DNA isolation
Tumour tissues were snap-frozen at -80°C. Samples of mononucleus peripheral blood cells were drawn in tubes and centrifuged. Before freezing, the cell pellet was resuspended to a concentration of 30 × 106 cells/ml in a freezing solution containing RPMI added with 10% DMSO and 20% FCS as well as Dnase. The samples were then frozen at -70°C before being stored in liquid nitrogen. Before DNA isolation, 240 μl Prot.K (AB-Applied Biosystems) and 400μl 1 × PBS without CaMg were added to the frozen samples on ice. The samples were incubated at 55°C until thawed and then trans-ferred after mixing to the vessels in the Applied Biosys-tems 340A Nucleic Acid Extractor. The remaining process of DNA isolation followed the standard proce-dures for the extractor using a phenol-chloroform based method. DNA from frozen tumour tissue was extracted according to standard procedures of the Applied Biosys-tems 340A Nucleic Acid Extractor.
All patients provided informed consent, and the study was approved by the local regional ethical committees.
Genotyping
The genotyping used has been previously described [11], and blood-tumour pairs were genotyped using the
Human-1 109K BeadChip array (Illumina, San Diego, CA, USA). For each sample, the corresponding log R ratio (LRR) and B allele frequency (BAF) were extracted for both blood and tumour using the Illumina Beadstu-dio Genotyping software, which is based on the transfor-mation of two channels’ allelic intensity values [7]. Briefly Illumina’s Beadstudio software performs normali-zation on the two raw allelic intensity values (X, Y) for
each locus (SNP). X and Y values are respectively
denoted as allele A and allele B. The normalized allele intensities are transformed to total signal intensity, R(R
=X +Y), and relative allelic signal intensity ratio, theta (θ = arctan(Y/X)(2/π)) [12].Illumina provides two sup-plementary parameters, LRRand BAF, which refer to the normalized and calibrated form of R andθ. BAF represents the proportion of one SNP allele (B) to the total number ofAand Balleles (NB/(NA+NB)) for each given loci. The Illumina Infinium platform detects chro-mosomal aberrations by comparing the normalized intensity of a subject sample and a reference sample using two modes of analysis: 1) a single-sample mode, which derives reference values from canonical genotyp-ing clusters (0, 0.5, 1) created from clustergenotyp-ing on normal reference samples; 2) Paired-sample mode, which makes intensity (R) comparisons between a subject sample and its paired reference sample. Genomic plots of LRR (LRR = log2(Rsubject/Rreference)) and BAF of the three canonical
clusters are used to detect chromosomal aberrations [1,13,14]. Comparing custom-clustered data to HapMap-clustered data, we observe improved scoring using cus-tom clustering. The genotypes for both blood and tumour were therefore extracted using custom cluster-ing [15]. To improve the results of genotypcluster-ing for those samples that have not performed well, we used the cus-tom-clustered data.
Missing values are denoted as NaN for both BAF and LRR. Updated SNP information (position and gene asso-ciation) was derived when available using the UCSC Genome Browser (Human Mar. 2006 Assembly (NCBI36/hg18)) [16], dbSNP (build 130), Ensembl gen-ome browser (Ensembl genes 57 database on Homo sapiens genes (GRCh37) dataset) [17], and CHIP Bioin-formatics Tools, Goldenpath: hg18, dbSNP: build 130 [18].
Description of computational algorithm
Pre-processing of data
computational algorithm consisting of the following steps for each chromosome (illustrated by the flowchart in Additional file 1, Figure S1).
We denote bijand tijas the blood sample and tumour
sample, respectively. Here, i = 1,..., r and j = 1,..., c represent the number of loci and the number of sam-ples, where r = 109352 and c = 112. Figure 1 illustrates the algorithm below for one locus. The Illumina data were pre-processed by sortingBAF and LRRvalues by chromosome and subsequently by position. All loci residing on chromosome Y were removed from our cal-culations. We denote BAFandLRRas × and y, respec-tively. We used the blood data as a reference and assumed a threshold to divide it into three regions (AA,
AB, and BB). Monomorph loci and loci with less than three distinct genotype groups were considered non-informative and removed. TheBAFvalue varies between 0 and 1 and the signal for the three genotypes on thex
axis clusters around (AA ~ 0, AB ~ 0.5,BB ~ 1); the assumed threshold covers samples in the following regions:
a. AA - homozygous: (0≤bij≤0.2)
b. AB - heterozygous: (0.2 < bij≤0.8)
c. BB - homozygous: (0.8 < bij≤1)
After filtering, we obtained 96,273 loci which modify index j into j = 1,..., r’, where r’is the total number of loci without non-informative data.
Allelic disparity
In the horizontal direction, for each locus of Blood’,
we obtained mean (μBi=
1
n
n
j=1
bij) and standard
deviation(SBi=
1
n−1
n
j=1
(bij−μBi)
2
). In the next
step, heterozygous blood samples were extracted and labelled, as well as the entire tumour. To identify which tumour samples shifted from the heterozygous toward either one of the homozygous regions, we measured the distance (D=xB- xT) of associated samples in both the
x and yaxes, where D is the allelic disparity of Blood’
andTumor’samples. We deal only with those samples where μBi−2SBi <D< μBi+ 2SBi. For each locus, the frequencies of disparity of individuals were calculated. Here, let n(tAAj)and n(tBBj)denote the numbers of sam-ples for j shifted toward AA- and BB- homozygous, respectively. Based on the sample frequencies of each SNP, we defined a score (S) denoting the propensity of each SNP to lose either the B or A allele:
S= ⎧ ⎪ ⎪ ⎨ ⎪ ⎪ ⎩
1− n(tBBj)
n(tAAj)
.100 forn(tAAj)>n(tBBj)
1−n(tAAj)
n(tBBj)
.100 forn(tAAj)<n(tBBj)
(1)
We can apply and modify an arbitrary threshold via Score (S).
Furthermore, since we identify the number of samples shifted toward A or B-allele, we defined the percentage of samples shifted toward minor allele (r(tBBj)), the per-centage of samples shifted toward major allele (r(tAAj)), and the percentage of heterozygous with disparity
(r(tABj)), where
LogR ratio(y) N. Amp . De letio n b a B-allele frequency(x) 0.07
-0.07 Blood'
|
1 1
x y
Tumor'
|
44
x
y Tumor'
|
5 5
x y
Tumor'
|
22
x y
Tumor'
|
33
x y
AA AB BB
Figure 1Position of one blood sample in heterozygous. The allelic disparity, amplification or deletion of one paired sample (blood-tumour) is illustrated in the heterozygous region. The position of one blood sample is denoted by (x1,y1) in the heterozygous region (AB). The same
sample in the tumour can be either unaltered or shifted toward minor allele (AA-homozygous-amplification (x3,y3), AA-homozygous-deletion (x4,
y4)), major allele (BB-homozygous-amplification (x2,y2) or BB-homozygous-deletion (x5,y5)). B-allele frequency is used for allelic disparity and Log R
r(tBBj) =
n(tBBj)
n(tAAj) +n(tBBj)
.100 (2)
r(tAAj) =
n(tAAj)
n(tAAj) +n(tBBj)
.100 (3)
and
r(tABj) =
n(tAAj) +n(tBBj)
n(tABj)
.100 (4)
The percentage of allele-specific disparity is given by
j=r(tBBj)−r(tAAj) (5) Based on the genotypes in blood, we tested for each SNP whether it fulfilled the criteria forHardy-Weinberg (HWE) equilibrium [19]. Given one degree of freedom and a 0.95 confidence interval (CI), the threshold for the chi-square value is 3.841. Values equal to or below this threshold indicate that a locus is in HWE.
Pathway and network analysis
Ingenuity Pathway Analysis (IPA) [20] version 9.0 (Release Date: 2011-03-22), Content version: 3206 (Release Date: 2011-02-11)) was used to analyse selected sets of genes in order to identify over-represented cano-nical pathways and networks. IPA core analysis allows us to find interactions between genes and proteins, related networks, functions and canonical pathways in the context of biological processes. The selected gene list was uploaded into IPA. The only filter used for the network analysis was“only consider molecules and/ or relationships where species = Human”. The analysis included both direct and indirect relationships as well as endogenous chemicals, and for the network analysis the maximum number of molecules allowed per network was 140. In the network analysis, molecules of interest which interact with other molecules in the Ingenuity Knowledge Base are identified as Network Eligible mole-cules and serve as “seeds” for generating networks. The networks are scored with a numerical value. The score is based on 1) the number of Network Eligible mole-cules in the network, 2) size of the network, 3) Network Eligible molecules in the given dataset, and 4) the num-ber of molecules in the IPA database that could poten-tially be included in the network. The network score is the -log(Fisher’s Exact test result), which is based on the hypergeometric distribution. Network function displays the functional annotations associated with a specific net-work. Top networks represent associated network func-tions based on a score which reflects the negative logarithm of the p-value, which aggregates the likelihood of the genes in the network being found together due to
random chance. Score ≥ 2 was considered significant. For the canonical pathways, the significance of the asso-ciation between our defined data sets and the canonical pathways are assessed in two ways by the software: 1) the ratio of the number of molecules from our gene lists that map to a given canonical pathway and 2) False Dis-covery Rate (FDR) (BenjaminiandHochberg[21]) by the negative logarithm of B-H p-values indicating the likeli-hood that the association between the genes in our gene sets and a specific canonical pathway are explained by chance alone. Top biological functions were assigned to each network by the negative logarithm of B-H p-value, corrected for multiple testing (Source: IPA online manual).
Chi-square test
The statistical chi-square test in R version 2.11.1 was used to estimate the association between the observed level of disparity and, among other, clinical and tumour-related parameters (TP53 mutation, ER, PR, HER2, Lymph node status, and subtypes of breast cancer).
Cochran-Armitage trend test
The Cochran-Armitage trend test [21] is applied in R version 2.11.1 to detect the linear trend of ordered cate-gorical data in a 2 × 3 contingency table. In this article, we used the Cochran-Armitage trend test for clinical parameters of grade and tumour size.
Detection of amplification and deletion
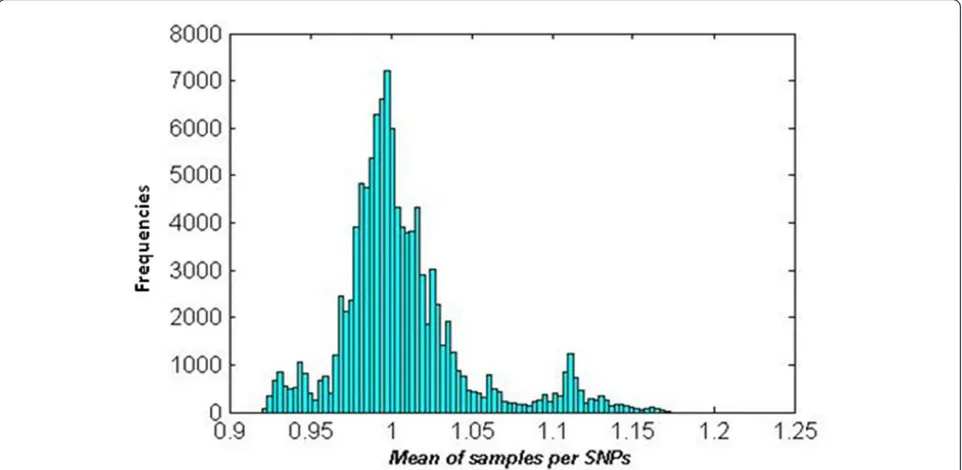
Based on the log R ratio, amplifications and deletions were detected with the following procedure: 1) LRR for tumour data were smoothed by the piecewise constant function (PCF) algorithm [22,23];2) Obtained PCF values were transformed into non-logarithmic values of smoothed LRR; 3) Mean of samples per locus was calcu-lated for the data obtained in 2) and a histogram of the mean values was made (Figure 2); 4) To distinguish a proper threshold for amplification, deletion and normal region, three higher peaks were selected around 0.925, 1 and 1.12 in the non-logarithmic smoothed LRR; 5) Based on these three peaks, ±0.07 (logarithmic value of 0.95 and 1.05) was chosen as the threshold, where > 0.07 was classified as amplification and -0.07≤normal≤ 0.07 a nd < -0.07 as deletion (Figure 1).
Results
AA-homozygous-Deletion (x4,y4), BB-homozygous-Amplification (x2,y2), or BB-homozygous-Deletion (x5,y5). Horizontal shifting is shown by vector-a (B allele frequency) and vertical with vector-b (Log R ratio). By using the algorithm introduced in the Methods (Description of computational algorithm) on a dataset consisting of genotypes from 112 blood-tumour paired samples collected from breast cancer patients, we extracted information on changes in geno-types (allelic loss, here denoted as allelic disparity). The algorithm was applied separately to each autosomal chro-mosome as well as the × chrochro-mosome. In all, 96,273 loci were left after removing non-informative loci (see Meth-ods on pre-processing of data) distributed across all chro-mosomes. The number of loci per chromosome varied between 1268 loci on chromosome 21 to 8559 on chromo-some 1 (the numbers of SNPs and genes before and after filtering are given in Table 1 for each chromosome).
Overall trends for allelic disparity in the genome
It is assumed that a locus has been subjected to allele-specific disparity if the signal from a heterozygous type shifts toward one or the other homozygous geno-type at a distance larger than two standard deviations of the mean of the heterozygote for all samples. In order to identify the loci with the highest levels of disparity, we defined a score (S in eq. (1)) based on the sample frequency of asymmetrical shift for each heterozygous genotype, and all loci above or equal to 75 were selected (see Methods on allelic disparity), leaving 13,198 loci (Additional file 2, Figure S2). A full list of the 13,198
loci with information related to the genotypes in blood (number of samples in each genotype, number of sam-ples in homozygote for both minor and major alleles, test for Hardy-Weinberg equilibrium, percent heterozyg-osity, number of missing genotypes, minor allele fre-quency, minor and major alleles) are given in Additional file 3, Table S1 as well as the information regarding gen-otypes in tumour (score (S), percentage and number of disparity toward minor or major allele (in eq. 2 and 3, respectively), percentage of heterozygote with disparity in eq. (4), percentage of allele-specific disparity in eq. (5) and preferential allele).
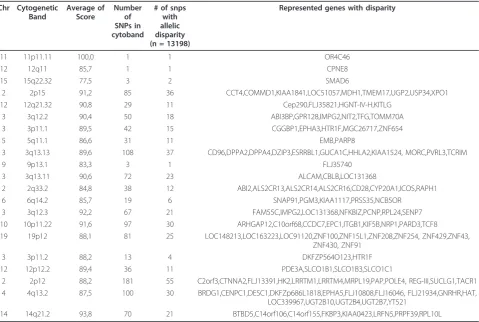
Chromosomal regions enriched for allelic disparity
In order to identify chromosomal regions with a high degree of disparity, we grouped the 13,198 loci accord-ing to cytoband localisation. The 13,198 loci fulfillaccord-ing the criteria of score 75 or higher were distributed on 778 cytobands with 1-77 loci per cytoband. The cyto-bands having 30% and higher disparity are highlighted in Figure 3 (Table 2). Several loci have been previously reported in association with breast cancer.
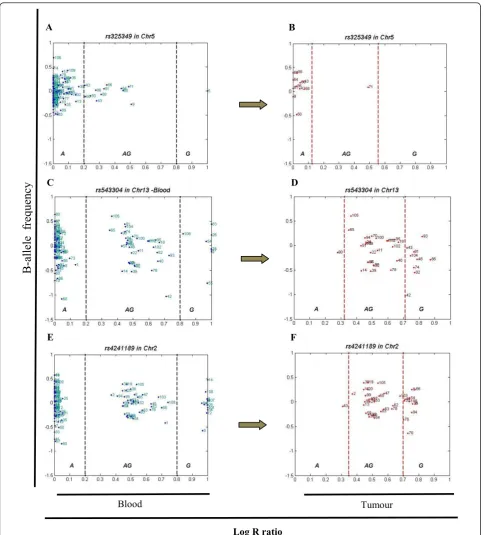
Single-SNP allelic disparity
(n = 11) of the heterozygous samples showed disparity in the tumour and all shift in one direction, toward the major allele (A) (Figure 4 A and 4B). SNP rs543304
located in BRCA2on chromosome 13 also showed a
high level of disparity, where 30 percent of the studied samples were heterozygous with 26 percent displaying disparity (n = 9), the majority toward the minor allele (G, n = 8) (Figure 4 C and 4D). Another example is
rs4241189 located inHECW2on chromosome 2, where
33 percent of the samples were heterozygous, 28 percent (n = 11) showing disparity (primarily toward the minor allele (G), n = 10) (Figure 4 E and 4F).
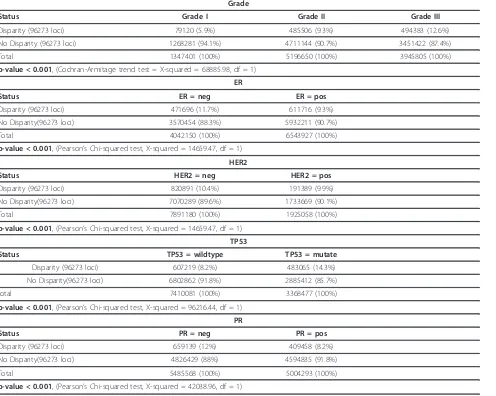
Allelic disparity in relation to clinical parameters
We observed significantly different frequencies of allelic disparity events according to grade, from well differen-tiated (G1) to poorly differendifferen-tiated (G3) breast cancers (p-value < 0.001 (Table 3)). Histologic grade is based on the microscopic appearance of the cancer cells, which are graded into four categories: Grades 1, 2, 3 and 4. Grade 1 tumours are well-differentiated and resemble normal cells; these tumours tend to grow slowly and are considered less aggressive. Grade 2 tumours are moder-ately differentiated, but grade 3 and 4 tumours tend to differentiate poorly and grow rapidly [24]. Figure 5 shows the trend from well differentiated (G1) toward poorly differentiated (G3) for the disparity level of samples.
Allelic disparity was also found to be associated with HER2, ER, PR and TP53 mutation status. A significant higher level of disparity was found in samples with nega-tive status for either one of the receptors HER2, ER, or PR (Table 3). Samples harbouring mutations in TP53 were also more likely to have a high degree of disparity compared to samples with wild type TP53 (Table 3).
To focus on specific genes in considering the allelic disparity of individual loci, we used only the loci in which the event was observed in 50 percent or more of the samples, leaving 176 loci (in 158 unique genes, indi-cated in Additional file 3, Table S1). Additional file 4, Table S2 shows loci with high levels of disparity
Figure 3Frequency of studied SNPs showing high degree of allelic disparity within a given cytoband. Percentage of 13,198 loci according to cytoband localization.
Table 1 Summary of studied loci and genes
Original data
Chromosome Before Filtering After Filtering
SNPs gene SNPs gene
1 9819 1606 8541 1530
2 8702 1055 7718 1030
3 7207 891 6401 861
4 6000 649 5392 626
5 6329 738 5644 712
6 6579 858 5890 832
7 5581 730 4941 708
8 4891 559 4334 541
9 4480 601 3989 581
10 5240 614 4571 593
11 5928 1050 5310 1000
12 5465 881 4781 847
13 3093 288 2794 285
14 3420 501 3013 481
15 3307 477 2928 463
16 3388 624 2909 586
17 4079 896 3584 858
18 2570 236 2260 234
19 3520 1058 3157 1001
20 3007 477 2572 446
21 1381 218 1267 213
22 1886 358 1629 345
X 3480 598 2648 530
Total 109352 15963 96273 15303
associated with the clinical or molecular parameters such as stage, grade, Her2 and TP53 mutation status. We applied multiple testing corrections. Since the num-ber of loci was 176 (less than 1000), we summarized p-values in Additional file 4, Table S2. Several genes have shown significant association in clinical features: AGA,
BANP, BCOR, CACNB1, CSMD1, CUBN, CXCR4,
DERL2, DNMT3B, EDNRB, EPB41L3, FAM20A,
FLJ31882, FLJ33008, FLJ43339, FLJ45831, GEMIN4,
GGTLA1, GHITM, HNT, HTR3B, IGSF4, KIAA1043,
KLF15, KREMEN1, LOC51255, LOC81691, MGC21654,
MYCBP2, NDST4, NGL-1, NVL, PIK3R5, PPP1R9B,
RTN4IP1, SLC2A9, SLC43A2, SPAG6, ST7, STK32B, TRPS1, TXNL1 and ZW10. Tumour size is classified into four sub-categories: T1 (Tumour is 2 cm or less across), T2 (Tumour is more than 2 cm but not more than 5 cm across), T3 (Tumour is more than 5 cm across) and T4 (Tumour of any size growing into the chest wall or skin) [25]; here, T3 and T4 are merged in one category. We found allelic disparity in these chro-mosomal loci: 2p11.2, 4p16.2, 4q26, 7q31.2, 10p12.2, 10p13, 11q23.2, 11q25, 13q22.3, 15q26.3 and 17p13.3. We also analyzed the two subtypes of breast cancer,
luminal epithelial-like subtype A and basal epithelial-like subtype [26] and we found evidence for allelic disparity in the following chromosomal loci: 8q24.13, 13q22.3, 17p12, 17p13.2, 1q42.12, 17q25.1, 22q11.23, 15q15.1 and 16p12.3. The corresponding genes are given in Addi-tional file 4, Table S2.
Allelic disparity and pathway analysis
In the list of 176 loci that show a high level of allelic dis-parity, we used IPA to perform a core analysis of the gene set and identify the most significantly associated canonical pathways (CP) as well as over-represented net-works (Table 4). The top bio functions in IPA are shown in Figure 6. Table 4 illustrates the top three network functions, related bio functions, IPA-score, p-values, and number of molecules for 1) lipid metabolism, small mole-cule biochemistry, etc. (IPA-score 158); 2) genetic disor-der, lipid metabolism, etc. (IPA-score = 52); 3) cell death, cellular development, etc. (IPA-score = 24).
Allelic disparity and stem cell genes
An overview of the gene sets used in this study is given in Additional file 5, Figure S3. For each gene set, we
Table 2 Cytoband SNP distribution of allelic disparity
Chr Cytogenetic Band
Average of Score
Number of SNPs in cytoband
# of snps with allelic disparity (n = 13198)
Represented genes with disparity
11 11p11.11 100,0 1 1 OR4C46
12 12q11 85,7 1 1 CPNE8
15 15q22.32 77,5 3 2 SMAD6
2 2p15 91,2 85 36 CCT4,COMMD1,KIAA1841,LOC51057,MDH1,TMEM17,UGP2,USP34,XPO1 12 12q21.32 90,8 29 11 Cep290,FLJ35821,HGNT-IV-H,KITLG
3 3q12.2 90,4 50 18 ABI3BP,GPR128,IMPG2,NIT2,TFG,TOMM70A 3 3p11.1 89,5 42 15 CGGBP1,EPHA3,HTR1F,MGC26717,ZNF654
5 5q11.1 86,6 31 11 EMB,PARP8
3 3q13.13 89,6 108 37 CD96,DPPA2,DPPA4,DZIP3,ESRRBL1,GUCA1C,HHLA2,KIAA1524, MORC,PVRL3,TCRIM
9 9p13.1 83,3 3 1 FLJ35740
3 3q13.11 90,6 72 23 ALCAM,CBLB,LOC131368
2 2q33.2 84,8 38 12 ABI2,ALS2CR13,ALS2CR14,ALS2CR16,CD28,CYP20A1,ICOS,RAPH1 6 6q14.2 85,7 19 6 SNAP91,PGM3,KIAA1117,PRSS35,NCB5OR
3 3q12.3 92,2 67 21 FAM55C,IMPG2,LOC131368,NFKBIZ,PCNP,RPL24,SENP7 10 10p11.22 91,6 97 30 ARHGAP12,C10orf68,CCDC7,EPC1,ITGB1,KIF5B,NRP1,PARD3,TCF8 19 19p12 88,1 81 25 LOC148213,LOC163223,LOC91120,ZNF100,ZNF15L1,ZNF208,ZNF254, ZNF429,ZNF43,
ZNF430, ZNF91
3 3p11.2 88,2 13 4 DKFZP564O123,HTR1F
12 12p12.2 89,4 36 11 PDE3A,SLCO1B1,SLCO1B3,SLCO1C1
2 2p12 88,2 181 55 C2orf3,CTNNA2,FLJ13391,HK2,LRRTM1,LRRTM4,MRPL19,PAP,POLE4, REG-III,SUCLG1,TACR1 4 4q13.2 87,5 100 30 BRDG1,CENPC1,DESC1,DKFZp686L1818,EPHA5,FLJ10808,FLJ16046, FLJ21934,GNRHR,HAT,
LOC339967,UGT2B10,UGT2B4,UGT2B7,YT521
14 14q21.2 93,8 70 21 BTBD5,C14orf106,C14orf155,FKBP3,KIAA0423,LRFN5,PRPF39,RPL10L
F E
D C
B A
B-allele fr
equency
Log R ratio
Blood Tumour
Figure 4Three SNPs with high levels of allelic disparity. Panel (A) illustrates the B allele frequency forrs325349in blood for all samples (A = 99, AG = 12 and G = 1) on chromosome 5 located inCDH9. Out of the 12 samples scored as AG in the blood, Panel (B). Black dash lines show the arbitrary thresholds for AA (major allele, A), AB (AG) and BB (minor allele, G) regions, and red dash lines are the real thresholds of
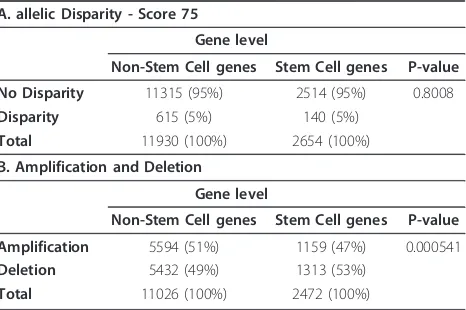
extracted the reported genes and compiled then into one stem cell gene list. After removing overlapping redundant information, this list contained 2899 genes. We then applied a standard chi-square test to compare the observed level of allelic disparity between the stem cell gene list and the list of non-stem cell genes (n = 13,198), as well as the levels of amplification and dele-tion. Genes were scored as disparity genes if more than 50% of loci related to a given gene showed disparity (score≥75) (genes w here t he SNPs were e qual ly dis-tributed were not included, Table 5A). We did not see a significantly higher level of disparity overall in loci asso-ciated with the stem cell genes compared to the non-stem cell genes when“collapsed”by associated or closest gene (p-value = 0.8008). We also analysed overall copy number changes between the two gene-sets (stem cell and non-stem cell) and observed that the stem cell
genes are more often altered by deletion than by ampli-fication compared to the non-stem cell genes (p-value = 5.41E-04, Table 5B).
Discussion
Chromosomal regions enriched for allelic disparity
We first identified chromosomal regions which were enriched for allelic disparity. Several of these loci have been previously reported in association with breast can-cer. For instance, the genetic variation in 5q11.1 has previously been associated with the risk of breast cancer
in multiple GWAS studies [27]. Bergamschi et al.
reported 5q11.1 to be more frequently deleted in basal-like subtype tumours [28]. In the same study, they also found 3q12.2 loss to be associated with Luminal B tumours [28,11]. Chromosomal aberrations of 3q13.13 have been detected in several types of cancer, including
Table 3 Clinical features
Grade
Status Grade I Grade II Grade III
Disparity (96273 loci) 79120 (5.9%) 485506 (9.3%) 494383 (12.6%)
No Disparity (96273 loci) 1268281 (94.1%) 4711144 (90.7%) 3451422 (87.4%)
Total 1347401 (100%) 5196650 (100%) 3945805 (100%)
p-value < 0.001, (Cochran-Armitage trend test = X-squared = 68885.98, df = 1)
ER
Status ER = neg ER = pos
Disparity (96273 loci) 471696 (11.7%) 611716 (9.3%)
No Disparity(96273 loci) 3570454 (88.3%) 5932211 (90.7%)
Total 4042150 (100%) 6543927 (100%)
p-value < 0.001, (Pearson’s Chi-squared test, X-squared = 14659.47, df = 1)
HER2
Status HER2 = neg HER2 = pos
Disparity (96273 loci) 820891 (10.4%) 191389 (9.9%)
No Disparity(96273 loci) 7070289 (89.6%) 1733669 (90.1%)
Total 7891180 (100%) 1925058 (100%)
p-value < 0.001, (Pearson’s Chi-squared test, X-squared = 14659.47, df = 1)
TP53
Status TP53 = wildtype TP53 = mutate
Disparity (96273 loci) 607219 (8.2%) 483065 (14.3%)
No Disparity(96273 loci) 6802862 (91.8%) 2885412 (85.7%)
total 7410081 (100%) 3368477 (100%)
p-value < 0.001, (Pearson’s Chi-squared test, X-squared = 96216.44, df = 1)
PR
Status PR = neg PR = pos
Disparity (96273 loci) 659139 (12%) 409458 (8.2%)
No Disparity(96273 loci) 4826429 (88%) 4594835 (91.8%)
Total 5485568 (100%) 5004293 (100%)
p-value < 0.001, (Pearson’s Chi-squared test, X-squared = 42038.96, df = 1)
breast, gastric, colon, and squamous cell carcinomas of head and neck; furthermore,KIAA1524residing in this region has been associated with an aggressive form of breast cancer [29].
Single-SNP allelic disparity
Next, we further identified the SNPs that most strongly contributed to allelic disparity. Such SNPs were, for
instance, SNP rs543304 located in BRCA2, rs325349
located in CDH9, and rs4241189 located in HECW2.
Abnormalities or mutations ofBRCA2gene have been
linked to increased risk of both familial breast and ovar-ian cancer [29]. The encoded protein is involved in repairing cell damage and maintaining normal growth of breast cells [29].CDH9 encodes a type II classical cad-herin from the cadcad-herin family. The cadcad-herins are inte-gral membrane proteins important for cell-cell adhesion
[30]. HECW2 encodes an E3 ubiquitin-protein ligase
and mediates ubiquitination of TP73, a p53 family mem-ber regulating cell growth and apoptosis. The enzyme acts to stabilize TP73 and enhance activation of tran-scription by TP73 [31].
Figure 5Allelic disparity in relation to clinical parameters. Trend of disparity in each individual locus related to the clinical parameter of grade.
Table 4 Top associated network functions and bio functions
Associated Network Functions Score
Lipid Metabolism, Small Molecule Biochemistry, Nervous System Development and Function 158
Genetic Disorder,Lipid Metabolism, Ophthalmic Disease 52 Cell Death, Cellular Development, Renal Regeneration 24
Disease and Disorders P-Value # Molecules
Genetic Disorder 3.35E-07 - 4.97E-02 96
Inflammatory Disease 8.40E-07 - 4.59E-02 57
Immunological Disease 1.47E-06 - 4.16E-02 51
Connective Tissue Disorders 1.57E-06 - 4.16E-02 40
Skeletal and Muscular Disorders 1.57E-06 - 4.59E-02 55
Molecular and Cellular Functions P-Value # Molecules
Cell Signaling 9.30E-05 - 4.35E-02 17
Molecular Transport 9.30E-05 - 4.91E-02 24
Vitamin and Mineral Metabolism 9.30E-05 - 4.32E-02 15
Lipid Metabolism 1.59E-04 - 4.97E-02 8
Small Molecule Biochemistry 1.59E-04 - 4.97E-02 19
Allelic disparity in relation to clinical parameters
Allelic disparity was observed in association to grade (degree of differentiation), HER2, ER, PR and TP53 mutation status in a number of genes.
SNP rs1041242 found associated with stage is located in theMYCBP2gene on chromosome 13 (q22.3). MYCBP2 is known as a probable E3 ubiquitin-protein ligase which mediates ubiquitination and subsequent proteasomal degradation of target proteins. MYCBP2 may function as a facilitator or regulator of transcriptional activation by
MYC[29]. Three SNPs in the geneST7on the 7q31.1-q31.2 region were also found associated with stage.ST7
has been reported as a tumour-suppressor gene involved in a variety of other human cancers and cell lines derived from breast tumours have been shown to harbor muta-tions inST7[32]. Locus rs3824271 found associated with
ER status is located in theCSMD1gene on chromosome 8p23.2, a region reported to be deleted in up to 50% of breast cancers [33]. Deletion of 8p23.2 has been associated with high histologic grade [34].
Biological pathway analysis (IPA)
The main network functions identified through pathway analysis were lipid metabolism, small molecule biochem-istry, genetic disorder, lipid metabolism, cell death, and cellular development. Activation of lipid metabolism has been reported to be an early event in carcinogenesis [35] and many studies at the single-gene level of lipid metabo-lism have revealed an effect on tumour genesis [36].
Stem cells
One of the most important characteristics of an embryonic stem cell is its ability of self-regeneration and differentia-tion. If one assumes that the initial targets of deregulation will be among the stem cell genes, then one may expect that they will represent the“oldest”events in an unstable genome, which would be reinforced in every cell division. We therefore hypothesized that the stem cell genes were likely to have a higher level of disparity in the tumour [37,38]. To test this, we extracted the stem cell genes from 13 published gene sets [39-41]. This hypothesis, however, was not confirmed, suggesting that the observed allelic dis-parity is perhaps not merely a function of the number of divisions after a single event but the result of a more com-plex and subtle evolutionary process.
Conclusion
Breast cancer is one the most frequent malignant and a multifactorial disease affecting women, and thus it is Figure 6Bio-functions analysis identified 17 bio-functions as significantly enriched within the genes with a high level of disparity (Score≥75). Top bio functions in Ingenuity Pathway Analysis (IPA).
Table 5 Chi-square test results for stem cell
A. allelic Disparity - Score 75
Gene level
Non-Stem Cell genes Stem Cell genes P-value
No Disparity 11315 (95%) 2514 (95%) 0.8008
Disparity 615 (5%) 140 (5%)
Total 11930 (100%) 2654 (100%)
B. Amplification and Deletion
Gene level
Non-Stem Cell genes Stem Cell genes P-value
Amplification 5594 (51%) 1159 (47%) 0.000541
Deletion 5432 (49%) 1313 (53%)
Total 11026 (100%) 2472 (100%)
reasonable to hypothesize that there is an association between multiple genomic rearrangements and tumour sample disparities. Since most tumours diverge from the diploid level, many studies have reported only gains and losses by array CGH.
Our data suggest that directional loss and amplifica-tion exist in breast cancer. These are highly associated with grade, which may indicate that they are enforced with increasing number of cell divisions. Whether there is a selective pressure for some loci to be preferentially amplified or deleted remains to be confirmed.
Additional material
Additional file 1: Figure S1 - Flowchart of methods. Two outputs of Illumina BeadStudio, B allele frequency (BAF on × axis) and Log R ratio (LRR on y axis) were used as input. A threshold was applied to BAF of blood to cover the three canonical AA, AB and BB genotypes. If the number of samples in each region was equal to 112, then SNP was removed as non-informative data. Both informative blood and tumour data were retrieved as Blood’& Tumour’. Mean standard deviation and variances of Blood’heterozygous were obtained. Then movement of Tumour’samples was compared to that of the Blood’heterozygous samples, and if the measured distance was equal to or greater than µBi ± 2sBi, the frequencies of samples moved toward AA/BB regions were measured. A flexible score (S) was calculated and the symmetrical regions were eliminated. Involved genes (84881 SNPS) of the asymmetric region were extracted. The Hardy-Weinberg equilibrium (HWE), the chi-square test with one degree of freedom, and 5% significance levels of values were calculated. Those SNPs in the HWE region were flagged. For the horizontal disparity, among 84,881 SNPs we selected SNPs with a score of 75 or more (n = 13198). From this list we selected SNPs if 50% or more of the samples of heterozygote blood shifted (n = 176 SNPs, representing 158 genes).
Additional file 2: Figure S2 - Disparity of SNPs with score≥75 in chromosomes 1-23. Disparity of loci with scores greater than or equal to 75. Blue colour shows SNPs that shifted toward minor allele (AA), and red colour shows SNPs that shifted toward major allele (BB).
Additional file 3: Table S1 - Loci with highest level of allelic disparity. This supplementary table contains 13,198 loci that show allelic disparity. The column of“SNP information”includes loci, gene, chromosome, cytogenetic band, stem cells and top 176 loci distinguished by IPA. The columns for“Blood”show the numbers of major allele (BB), heterozygous, minor allele (AA), percentage of heterozygous, total number of samples, minor allele frequency (MAF), and results of HWE chi-square test. The column of“Tumour”contains percentage of heterozygous with disparity obtained by eq. (4), percent of allele-specific disparity by eq. (5), preferential allele, score, number of samples shifted toward major allele and its percentage by eq. (3), and number of samples shifted toward minor allele and its percentage by eq. (2).
Additional file 4: Table S2 - Significant loci related to the clinical features with highest level of allelic disparity. Allelic disparity of individual loci in relation to clinical parameters such as tumour size, ER, PR, TP53 mutation, HER2 status, Basal-Lum A subtypes, grade, and lymph node status was analyzed.
Additional file 5: Figure S3 - Overview of stem cell gene sets. Thirteen gene sets of stem cells are compiled in one list and compared for allelic disparity and amplification or deletion.
Acknowledgements
This project was supported by Research Council of Norway [project number 183621; National Programme for Research in Functional Genomics in
Norway (FUGE)]. We thank Daniel Nebdal for his helpful support in data management.
Author details
1
Department of Genetics, Institute for Cancer Research, Norwegian Radium Hospital, Oslo University Hospital, Oslo, Norway.2Institute for Clinical
Medicine, Faculty of Medicine, University of Oslo, Oslo, Norway.3Department of Clinical Molecular Biology (EpiGen), Medical division, Akerhus University Hospital, Lørenskog, Oslo, Norway.4Department of Biostatistics, Institute of Basic Medical Science, University of Oslo, Oslo, Norway.
Authors’contributions
FK designed computational algorithm and programming. VNK and HKS designed the study. ALBD and VNK financed and conducted data
acquisition. VNK, HE and HKS were involved in data analysis. FK, HE, VNK and HKS wrote the manuscript. All authors have read and approved the final manuscript.
Competing interests
The authors declare that they have no competing interests.
Received: 9 September 2011 Accepted: 21 December 2011 Published: 21 December 2011
References
1. Wang K, Li M, Hadley D, Liu R, Glessner J, Grant SF, Hakonarson H, Bucan M, Penn CNV:an integrated hidden Markov model designed for high-resolution copy number variation detection in whole-genome SNP genotyping data.Genome Res2007,17:1665-1674.
2. Guha S, Li Y, Neuberg D:Bayesian Hidden Markov Modelling of Array CGH data.The Berkeley Electronic Press2006.
3. Pollack JR, Sorlie T, Perou CM, Rees CA, Jeffrey SS, Lonning PE, Tibshirani R, Botstein D, Borresen-Dale AL, Brown PO:Microarray analysis reveals a major direct role of DNA copy number alteration in the transcriptional program of human breast tumors.Proc Natl Acad Sci USA2002,
99:12963-12968.
4. Pollack JR, Perou CM, Alizadeh AA, Eisen MB, Pergamenschikov A, Williams CF, Jeffrey SS, Botstein D, Brown PO:Genome-wide analysis of DNA copy-number changes using cDNA microarrays.Nat Genet1999,
23:41-46.
5. Nakao K, Mehta KR, Fridlyand J, Moore DH, Jain AN, Lafuente A, Wiencke JW, Terdiman JP, Waldman FM:High-resolution analysis of DNA copy number alterations in colorectal cancer by array-based comparative genomic hybridization.Carcinogenesis2004,25:1345-1357. 6. Carter PN:Methods and strategies for analyzing copy number variation
using DNA microarrays.Nature genetics2007,39:S16-S39. 7. Peiffer DA, Gunderson KL:Analyzing copy number variation with
Infinium® whole-genome genotyping.Illumina IncSan Diego. CA. USA; 2007.
8. Beroukhim R, Mermel CH, Porter D, Wei G, Raychaudhuri S, Donovan J, Barretina J, Boehm JS, Dobson J, Urashima M, Mc Henry KT, Pinchback RM, et al:The landscape of somatic copy-number alteration across human cancers.Nature2010,463:899-905.
9. Wiedswang G, Borgen E, Schirmer C, Karesen R, Kvalheim G, Nesland JM, Naume B:Comparison of the clinical significance of occult tumor cells in blood and bone marrow in breast cancer.Int J Cancer2006,
118:2013-2019.
10. Nordgard SH, Johansen FE, Alnaes GI, Naume B, Borresen-Dale AL, Kristensen VN:Genes harbouring susceptibility SNPs are differentially expressed in the breast cancer subtypes.Breast Cancer Res2007,9:113. 11. Nordgard SH, Johansen FE, Alnaes GI, Bucher E, Syvanen AC, Naume B,
Borresen-Dale AL, Kristensen VN:Genome-wide analysis identifies 16q deletion associated with survival, molecular subtypes, mRNA expression, and germline haplotypes in breast cancer patients.Genes Chromosomes Cancer2008,47:680-696.
12. Staaf J, Vallon-Christersson J, Lindgren D, Juliusson G, Rosenquist R, Hoglund M, Borg A, Ringner M:Normalization of Illumina Infinium whole-genome SNP data improves copy number estimates and allelic intensity ratios.BMC Bioinformatics2008,9:409.
High-resolution genomic profiling of chromosomal aberrations using Infinium whole-genome genotyping.Genome Res2006,16:1136-1148.
14. Genomic profiling of LOH and DNA copy number with Infinium® Whole-Genome Genotyping, technical note: DNA Analysis.[http://www.illumina. com/Documents/products/appnotes/appnote_cgh.pdf].
15. Infinium®Genotyping Data Analysis, technical note: Illumina®DNA Analysis.[http://www.illumina.com/Documents/products/technotes/ technote_infinium_genotyping_data_analysis.pdf].
16. UCSC Genome Bioinformatics.[http://genome.ucsc.edu/cgi-bin/ hgGateway].
17. Ensembl.[http://www.ensembl.org/biomart/martview/ a8cb7eb0f3637287b31bc6e9390898a9].
18. CHIP Bioinformatics Tools.[http://snpper.chip.org/].
19. Stern C:THE HARDY-WEINBERG LAW.Science1943,97:137-138. 20. Ingenuity Pathway Analysis.[http://www.ingenuity.com/].
21. Benjamini Y, Hochberg Y:Controlling the false discovery rate: A practical and powerful approach to multiple testing.JR Statist1995,75:289-300. 22. Baumbusch LO, Aaroe J, Johansen FE, Hicks J, Sun H, Bruhn L, Gunderson K,
Naume B, Kristensen VN, Liestol K, Borresen-Dale AL, Lingjaerde OC:
Comparison of the Agilent, ROMA/NimbleGen and Illumina platforms for classification of copy number alterations in human breast tumors.BMC Genomics2008,9:379.
23. Winkler G, Liebscher V:Smoothers for discontinuous signals.Journal of Nonparametric Statistics2002,14:203-222.
24. National Cancer Institute.[http://www.cancer.gov/cancertopics/factsheet/ detection/tumor-grade].
25. Learn about cancer.[http://www.cancer.org/cancer/breastcancer/ detailedguide/breast-cancer-staging].
26. Perou CM, Sorlie T, Eisen MB, van de Rijn M, Jeffrey SS, Rees CA, Pollack JR, Ross DT, Johnsen H, Akslen LA, Fluge O, Pergamenschikov A, Williams C, Zhu SX, Lonning PE, Borresen-Dale AL, Brown PO, Botstein D:Molecular portraits of human breast tumours.Nature2000,406:747-752. 27. Thomas G, Jacobs KB, Kraft P, Yeager M, Wacholder S, Cox DG,
Hankinson SE, Hutchinson A, Wang Z, Yu K, Chatterjee N, Garcia-Closas M, et al:A multistage genome-wide association study in breast cancer identifies two new risk alleles at 1p11.2 and 14q24.1 (RAD51L1).Nat Genet2009,41:579-584.
28. Bergamschi A, Kim YH, Wang P, Sorlie T, Hernandez-Boussard T, Lonning PE, Tibshirani R, Borresen-Dale AL, Pollack JR:Distinct patterns of DNA copy number alteration are associated with different clinicopathological features and gene-expression subtypes of breast cancer.Genes Chromosomes Cancer2006,45:1033-1040.
29. Atlas of Genetics and Cytogenetics in Oncology and Haematology.
[http://atlasgeneticsoncology.org/Kprones/HeredBreastCanID10062.html]. 30. Shimoyama Y, Tsujimoto G, Kitajima M, Natori M:Identification of three
human type-II classic cadherins and frequent heterophilic interactions between different subclasses of type-II classic cadherins.Biochem J2000,
349:159-167.
31. Miyazaki K, Ozaki T, Kato C, Hanamoto T, Fujita T, Irino S, Watanabe K, Nakagawa T, Nakagawara A:A novel HECT-type E3 ubiquitin ligase, NEDL2, stabilizes p73 and enhances its transcriptional activity.Biochem Biophys Res Commun2003,308:106-113.
32. Dong SM, Sidransky D:Absence of ST7 gene alterations in human cancer.
Clin Cancer Res2002,8:2939-2941.
33. Kamal M, Shaaban AM, Zhang L, Walker C, Gray S, Thakker N, Toomes C, Speirs V, Bell SM:Loss of CSMD1 expression is associated with high tumour grade and poor survival in invasive ductal breast carcinoma.
Breast Cancer Res Treat2010,121:555-563.
34. Kamal M, Shaaban AM, Holliday DL, Toomes C, Speirs V, Bell SM:Loss of CSMD1 disrupts mammary epithelial morphogenesis.Breast Cancer Research2010,12:9.
35. Hirsch HA, Iliopoulos D, Joshi A, Zhang Y, Jaeger SA, Bulyk M, Tsichlis PN, Shirley L, Struhl K:A transcriptional signature and common gene networks link cancer with lipid metabolism and diverse human diseases.
Cancer Cell2010,17:348-361.
36. Hilvo M, Denkert C, Lehtinen L, Muller B, Brockmoller S, Seppanen-Laakso T, Budczies J, Bucher E, Yetukuri L, Castillo S, Berg E, Nygren H, Sysi-Aho M, Griffin JL, Fiehn O, Loibl S, Richter-Ehrenstein C, Radke C, Hyotylainen T, Kallioniemi O, Iljin K, Oresic M:Novel theranostic opportunities offered by characterization of altered membrane lipid metabolism in breast cancer progression.Cancer Res2011,71:3236-3245.
37. Ben-Porath I, Thomson MW, Carey VJ, Ge R, Bell GW, Regev A, Weinberg RA:
An embryonic stem cell-like gene expression signature in poorly differentiated aggressive human tumors.Nat Genet2008,40:499-507. 38. Reya T, Morrison SJ, Clarke MF, Weissman IL:Stem cells, cancer, and
cancer stem cells.Nature2001,414:105-111.
39. Lobo NA, Shimono Y, Qian D, Clarke MF:The biology of cancer stem cells.
Annu Rev Cell Dev Biol2007,23:675-699.
40. Sting lJ, Caldas C:Molecular heterogeneity of breast carcinomas and the cancer stem cell hypothesis.Nat Rev Cancer2007,7:791-799.
41. Yu J, Vodyanik MA, Smuga-Otto K, Antosiewicz-Bourget J, Frane JL, Tian S, Nie J, Jonsdottir GA, Ruotti V, Stewart R, Slukvin II, Thomson JA:Induced pluripotent stem cell lines derived from human somatic cells.Science 2007,318:1917-1920.
Pre-publication history
The pre-publication history for this paper can be accessed here: http://www.biomedcentral.com/1755-8794/4/85/prepub
doi:doi:10.1186/1755-8794-4-85
Cite this article as:Kavehet al.:Allele-specific disparity in breast cancer. BMC Medical Genomics20114:85.
Submit your next manuscript to BioMed Central and take full advantage of:
• Convenient online submission
• Thorough peer review
• No space constraints or color figure charges
• Immediate publication on acceptance
• Inclusion in PubMed, CAS, Scopus and Google Scholar
• Research which is freely available for redistribution