Open Access
Research
A comparison of modelling techniques for computing wall stress in
abdominal aortic aneurysms
Barry J Doyle*, Anthony Callanan and Timothy M McGloughlin
Address: Centre for Applied Biomedical Engineering Research (CABER), Department of Mechanical and Aeronautical Engineering and Materials and Surface Science Institute, University of Limerick, Ireland
Email: Barry J Doyle* - [email protected]; Anthony Callanan - [email protected]; Timothy M McGloughlin - [email protected] * Corresponding author
Abstract
Background: Aneurysms, in particular abdominal aortic aneurysms (AAA), form a significant portion of cardiovascular related deaths. There is much debate as to the most suitable tool for rupture prediction and interventional surgery of AAAs, and currently maximum diameter is used clinically as the determining factor for surgical intervention. Stress analysis techniques, such as finite element analysis (FEA) to compute the wall stress in patient-specific AAAs, have been regarded by some authors to be more clinically important than the use of a "one-size-fits-all" maximum diameter criterion, since some small AAAs have been shown to have higher wall stress than larger AAAs and have been known to rupture.
Methods: A patient-specific AAA was selected from our AAA database and 3D reconstruction was performed. The AAA was then modelled in this study using three different approaches, namely,
AAA(SIMP), AAA(MOD) and AAA(COMP), with each model examined using linear and non-linear material properties. All models were analysed using the finite element method for wall stress distributions.
Results: Wall stress results show marked differences in peak wall stress results between the three methods. Peak wall stress was shown to reduce when more realistic parameters were utilised. It was also noted that wall stress was shown to reduce by 59% when modelled using the most accurate non-linear complex approach, compared to the same model without intraluminal thrombus.
Conclusion: The results here show that using more realistic parameters affect resulting wall stress. The use of simplified computational modelling methods can lead to inaccurate stress distributions. Care should be taken when examining stress results found using simplified techniques, in particular, if the wall stress results are to have clinical importance.
Background
Cardiovascular disease is the leading cause of morbidity and premature deaths of modern era medicine and aneu-rysms are a major contributor to the poor clinical
out-comes. Aneurysm, meaning widening, can be defined as a permanent and irreversible localised dilatation of a vessel [1]. Although this disease can form in any blood vessel, artery or vein, the more serious aneurysms occur in the
Published: 19 October 2007
BioMedical Engineering OnLine 2007, 6:38 doi:10.1186/1475-925X-6-38
Received: 28 February 2007 Accepted: 19 October 2007
This article is available from: http://www.biomedical-engineering-online.com/content/6/1/38
© 2007 Doyle et al; licensee BioMed Central Ltd.
abdominal aorta, the brain arteries, and the heart and tho-racic aorta. The vast majority of these aneurysms occur in the abdominal aorta, and are termed Abdominal Aortic Aneurysm (AAA). There is much debate amongst research-ers and surgeons as to the most appropriate criteria for surgical intervention of unruptured AAAs [2-6]. Currently, the maximum diameter of the aneurysm is the most com-monly used determinant of surgical intervention, with cli-nicians opting for surgery when the AAA exceeds 5 cm in transverse diameter [4,5,7]. Although this maximum diameter criterion can be justified, as the rupture risk for an AAA is clearly related to its maximal diameter [5,8], it is also known that small AAAs can rupture [5,9-11]. Nicholls et al. [11] reported in one study that 10% to 24% of ruptured aneurysms were 5 cm or less in diameter, and therefore there is clearly a need for an improved predictor of rupture.
It is believed by many researchers that stress analyses are more accurate indicators than diameter for predicting rup-ture [2,5-7,12-14], and it is clear that a reliable method of predicting AAA rupture has definite clinical importance [2,3,6,7,13].
It has been previously documented how AAA formation is accompanied by an increase in wall stress [2,7], and a decrease in wall strength [15-17]. It has been identified that aneurysm wall stress does not follow the traditional Law of Laplace, in that AAAs with equivalent diameters and pressures could have largely different stress distribu-tions [2,3,7,13]. Researchers have been using stress analy-sis techniques, such as finite element analyanaly-sis (FEA), to compute stresses within AAAs for some time now [2,5,7,13], but this work has yet to be validated experi-mentally using realistic AAA models. Morris et al. [18] showed experimentally the stress contours in an idealised AAA using the photoelastic method, which was later vali-dated numerically by Callanan et al. [19]. Previous numerical studies have shown how asymmetry and diam-eter affect wall stress [2], and also how this wall stress is distributed within a realistic AAA [5,7,13,20]. Dobrin [21] suggested that the presence of ILT neither reduces the luminal pressure exerted on the wall nor offers a retractive force and thus has no effect on the wall stress. This ILT was later reported to significantly reduce the stress acting on the AAA wall [13] and to act as a mechanical cushion [13,17], although some researchers dispute this [22].
The purpose of this study is to analyse and compare the differences associated with finite element analysis (FEA) modelling of AAAs. Many researchers have used simpli-fied AAA models in their studies [2,23-25], compared to others who have used much more complex, realistic methods [2,3,7,13,20,26-28]. The more common simpli-fying assumptions include treating the biomechanical
material properties of the vessel as linearly elastic and excluding the intraluminal thrombus (ILT) from the model. One patient-specific AAA was examined in this study. The model was examined from various aspects of complexity, starting with a simplified approach,
AAA(SIMP), followed by a moderate method,
AAA(MOD), and then a complex technique, AAA(COMP), with results and differences contrasted and compared. In this study, simplified refers to the use of common simpli-fying assumptions. Moderate refers to the use of a limited amount of simplifying assumptions, with complex infer-ring the inclusion of ILT. All models were examined using both linear and non-linear material properties.
Methods
A patient suffering from an AAA was selected from our AAA database which included modest levels of intralumi-nal thrombus (ILT). The study subject was male, and the AAA maximum transverse diameter was 5.1 cm, and so had exceeded the 5 cm threshold for surgical intervention. The total length of the AAA was 13.2 cm, had a total vol-ume of 176.7 cm3, of which 67.5 cm3 was ILT. For
clini-cally meaningful stress analysis of AAAs, patient-specific computed tomography (CT) scans were obtained for the patient. This CT data was then reconstructed using com-mercially available software (Mimics v10.0, Materialise, Belgium). In total, six models were created and analysed. Three different methods of reconstruction were utilised to create the AAA, with each model examined using both lin-ear and non-linlin-ear material properties. For the purpose of this study, the AAAs modelled using the first set of simpli-fying assumptions will be referred to as AAA(SIMP)L and AAA(SIMP)NL, with the subscripts L and NL referring to linear and non-linear material properties, respectively. The second set of AAAs will be referred to as AAA(MOD)L and AAA(MOD)NL, due to the use of moderate simplifying assumptions. The third set of AAAs, which used a more complex method of analysis will be referred to as AAA(COMP)L and AAA(COMP)NL. All stress analyses were performed using the finite element analysis software ABAQUS v6.6-2 (Dassault Systemes, SIMULIA, Rhode Island, USA) on a standard desktop with a 3.2 GHz proc-essor and 4GB of RAM.
3D reconstruction
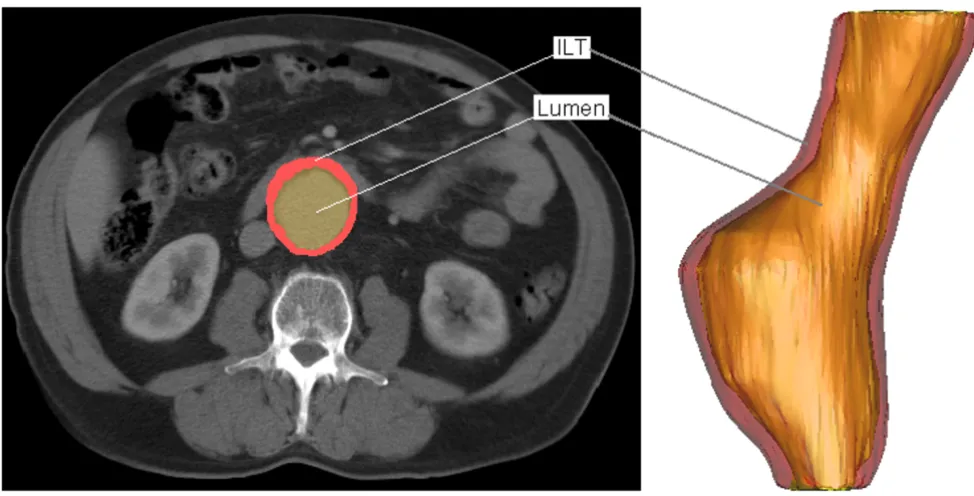
226 is sufficient to identify the lumen region of the AAA due to the non-ionic contrast. This contrast dye is an organic solution that makes internal bodily structures vis-ible. The ILT regions of the AAA must be assigned a lower HU value, as the material has a pixel intensity that is closer to fat than bone. A HU value of 0 is sufficient to distin-guish the ILT from the surrounding tissue. For all models reconstructed, the iliac arteries have been omitted as with previous research [5]. Figure 1 shows the conversion from CT scan to 3D model. On the left the thresholding and segmentation process highlights both the ILT and lumen of the AAA, with the software generating 3D reconstruc-tions, shown on the right. For the AAA(SIMP) and
AAA(MOD) models, the ILT was omitted, and so the
reconstruction consisted of a single layer wall of uniform thickness.
AAA(SIMP)
For this set of AAAs, the ILT was omitted from the recon-struction, and was instead incorporated into the full AAA model as lumen. Previous work [5,6] has also taken this approach to AAA modelling. The thickness of the aortic wall is not easily identifiable from CT scans. Previous research [2,5-7,18,19,25,26,29] has used wall thickness varying from 1–2 mm. As no information was available from the CT scans about the wall thickness of each AAA, in this study the wall was assumed to be of uniform
thick-ness throughout the model and was set to 1.5 mm [2,26,29].
AAA(MOD)
When reconstructing the AAA(MOD) models, the surface polylines created using Mimics v10.0, were exported to ProEngineer Wildfire 3.0 (Parametric Technology Corpo-ration, Needham, M.A., USA) in order to create a 3D wall. The original polylines were offset by 1.5 mm [2,26,29] so as to create a second artificial surface offset from the orig-inal surface. These surfaces were then connected so as to form a realistic uniform 3D aortic wall.
AAA(COMP)
For this AAA, the ILT region was included into the models. Therefore, the ILT is a completely different entity to that of the AAA wall, with the two sections tied together using realistic constraints. This is a more realistic representation of the actual AAA with the ILT. An artificial wall was cre-ated to represent the AAA wall and, like earlier, was set to be a uniform 1.5 mm in thickness [2,26,29].
Model smoothing
Each of these 3D models were initially quite rough con-taining sharp edges and surface artefacts, and required smoothing to ensure that the model could be readily meshed and that stress analyses could be performed. The
Typical CT scan and 3D reconstruction of patient suffering from an AAA Figure 1
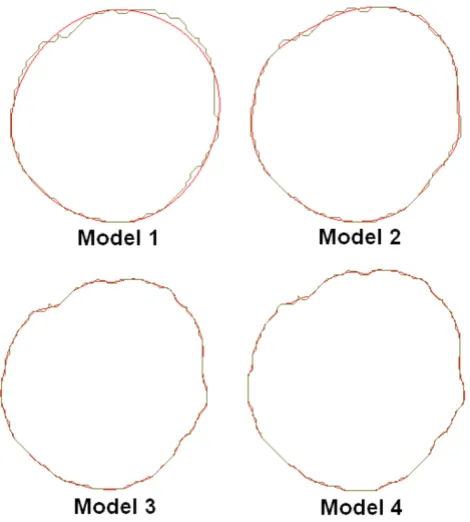
method of reconstruction and smoothing was validated from previous work by our group, [30,31] and it was shown that there are negligible differences between the two methods. In order to determine the optimum level of smoothing for these reconstructions, four degrees of smoothing were examined. These four smoothing levels were based on axial smoothing of individual polyline slices created from the CT scans. Four models were then reconstructed. Model 1 contained 7 control points per polyline slice, model 2 had 20 control points, model 3 had 50 control points, and model 4 had 70 control points per slice. The more control points per polyline decreases the surface smoothness of the resulting AAA. Figure 2 shows the difference in polylines between the various degrees of smoothing. Non-linear stress analyses were then performed on each of the four models. Resulting wall stress distributions are shown in Figure 3, with stress results normalised to the peak stress experienced in the roughest model, namely model 4. Mesh independence was performed on all models. From these results, model 2 was deemed to be the optimum level of smoothing as unwanted surface detail is removed without causing unnecessary over-smoothing. Figure 4 illustrates the
dif-ference between the resulting rough and smooth models. These AAA surfaces were then exported in IGES file format for further work.
Biomechanical material properties
AAA(SIMP)
Firstly, the AAA material was assumed to be homogenous and isotropic with linear elastic material properties. This model is referred to as AAA(SIMP)L. Although human arterial tissue acts like a non-linear material, at pressures above 80 mmHg (10.67 KPa) the aorta behaves more like a linearly elastic material [23,24,32,33]. The modulus of elasticity applied to the AAA wall was 4.66 MPa, as used in previous research [24,27]. Many researchers have mod-elled the aorta as linearly elastic in order to examine the influence of geometry and various other parameters on wall stress [2,4,23-25,34].
The same model was then analysed using non-linear elas-tic material properties, and is referred to as AAA(SIMP)NL. The AAA wall was modelled as a homogenous isotropic hyperelastic material using the finite strain constitutive model proposed by Raghavan and Vorp [3] in Eqn. 1. These material properties have been utilised for many stress analysis studies [5-7,13,20,26-28].
W = C1(IB - 3) + C2(IB - 3)2 (1)
Where, W is the strain energy and IB is the first invariant of the left Cauchy-Green tensor B (IB = tr B). The constants were set to the population mean values C1 = 174,000 Pa (0.174 MPa) and C2 = 1,881,000 Pa (1.881 MPa). Aortic tissue is also known to be nearly incompressible with a Poisson's ratio of approximately 0.49 [2,24,35].
AAA(MOD)
For this set of AAAs, the wall was again assigned both lin-ear and non-linlin-ear material properties, referred to as
AAA(MOD)L and AAA(MOD)NL, respectively.
AAA(MOD)L was assigned an Young's modulus of 4.66 MPa, like earlier, and AAA(MOD)NL utilized the non-lin-ear model proposed by Raghavan and Vorp [3].
AAA(COMP)
In the AAA(COMP) models, the ILT was included as a sep-arate entity in the AAA model, and therefore required its own material property. Previous work has used the theory of linear elasticity to model the ILT [4,28], and so for the AAA(COMP)L the ILT was assigned a Young's modulus of 0.11 MPa, and a Poisson's ratio of 0.45. The AAA wall was also assumed to be linearly elastic with the same material properties as described earlier. For the AAA(COMP)NL model, the ILT was modelled as a hyperelastic material using the material constants derived from 50 ILT speci-mens from 14 patients performed by Wang et al. [36]. The
Effect of axial smoothing on the polylines constructed from the CT scans
Figure 2
AAA wall was again analysed using the non-linear model proposed by Raghavan and Vorp [3]. Therefore, the model consisted of two non-linear materials, both with realistic material properties.
Mesh generation
AAA(SIMP)
Once the AAA was imported into ABAQUS v.6.6-2 for stress analysis, a mesh was generated on the AAA model. The elements chosen for the application were linear shell elements [2,3,23]. The surface was partitioned, by divid-ing the model into different regions in order to optimise the mesh creation. Each shell element was assigned a uni-form thickness of 1.5 mm [2,26,29]. Mesh independence was performed in order to determine the optimum number of elements. In order to gain confidence in the mesh size of each AAA model, the number of elements was incrementally increased and the peak wall stress com-puted. The optimum mesh size was determined once the peak stress did not increase by more than 2%. This method of convergence has been used in previous studies [37,38]. It was noted that the locations of the peak stress did not significantly alter when examining each model for
mesh convergence. Both the AAA(SIMP)L and the
AAA(SIMP)NL models were meshed using shell elements,
Effect of smoothing on the reconstructed AAA Figure 4
Effect of smoothing on the reconstructed AAA. The optimum smoothing factor removes unwanted surface detail without over-smoothing the AAA. (A) Shows the rough model without smoothing and (B) shows the effect of a 20 control point axial smoothing factor. Model shown in the lat-eral view.
Resulting wall stress distributions of the various degrees of smoothing examined Figure 3
with element numbers for each model in the order of 17000 and 30000, respectively.
AAA(MOD)
In order to mesh the 3D wall of the AAA(MOD) models, 3D stress elements were required in order to mesh throughout the thickness of the AAA wall. The elements used for this part of the study were quadratic, 10-noded, tetrahedral elements. Mesh convergence was achieved using the same approach as described earlier. In this case, the AAA(MOD)L and the AAA(MOD)NL models required 29000 elements. The location of peak stress did not signif-icantly alter in location during the convergence study.
AAA(COMP)
As with the AAA(MOD) models, the elements employed here were quadratic tetrahedral 3D stress elements, with 10-nodes per element. The AAA wall and ILT regions were meshed using a master-slave contact scenario, where the slave region (ILT) has a larger number of elements than the master region (AAA wall). Both the AAA(COMP)L and the AAA(COMP)NL models converged at 13000 elements using the same convergence criteria as described previ-ously.
Forces and boundary conditions
The blood pressure within the AAA acts on the AAA inner wall, therefore, the pressure was applied to the inner sur-face of all the virtual AAA models studied. A static peak pressure of 120 mmHg (16 KPa) was used. Ideally, patient-specific blood pressures would be applied to each particular AAA, by measuring blood pressure at the time of CT scan, but for this study the standard peak pressure of 120 mmHg was felt to be sufficient. The shear stress induced by blood flow was neglected in this study [7,24], although the effects of blood flow have been shown to reduce wall stress by 10% in uniformly thick walled ideal models and by up to 30% in variable wall thickness mod-els [34]. In order to simulate the attachment of the AAA to the aorta at the renal junction and iliac bifurcation, the AAA model was fully constrained in the proximal and dis-tal regions. Residual stresses that may exist within the aor-tic wall in vivo and tethering forces on the posterior surface caused by the lumbar arteries were neglected. Bulging is on the anterior surface due to the constraint the spinal cord places on posterior dilation.
Results
In order to easily observe and visualise the resulting wall stress of each AAA model, contours of the von Mises stress were plotted on the surface of each AAA model. The von Mises stress is a stress index especially suited for failure analysis, as stress is a tensor quantity with nine compo-nents, with the von Mises stress being a combination of these components [7]. The normalised computed wall
stress results for the AAA(SIMP), AAA(MOD) and AAA(COMP) models can be seen in Figures 5, 6 and 7. In these figures, wall stress results were normalised by using the peak stress experienced in the linearly elastic model of each case. In each case, the linearly elastic model returned a higher peak stress than the corresponding non-linear model. The location of peak stress remained the same in all models except the AAA(SIMP) models, where the loca-tion of peak stress shifted from a centred anterior localoca-tion to a left lateral location. For both linearly elastic and non-linearly elastic AAA(MOD) and AAA(COMP) models, the peak stress region was located on the inner surface of the AAA wall. When using 3D stress elements the stress is not interpolated through the wall thickness, as with shell ele-ments, but rather at the individual integration points of the element. For the AAA(COMP) models the peak stress was located at regions between the intersection of the ILT region and the AAA wall.
In both the AAA(SIMP) models, the peak stress occurred at regions of relatively maximum diameter, rather than at inflection points along the surface of the AAA sac. For all AAA(MOD) and AAA(COMP) cases studied, the peak stress occurred at an inflection point on the inner surface of the AAA. An inflection point is defined as points on the AAA surface at which the local AAA wall shape changes
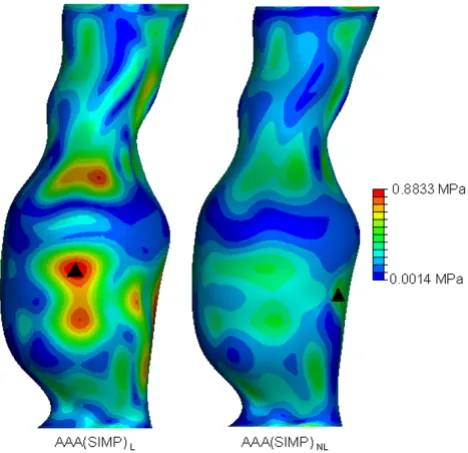
von Mises wall stress distributions for both the AAA(SIMP)L
and AAA(SIMP)NL models at an internal pressure of 120
mmHg Figure 5
von Mises wall stress distributions for both the
from convex to concave [2]. Peak stress located at inflec-tion points has been previously reported in idealised models, both numerically [2,19,34] and experimentally [18]. In general, wall stress reduces across the entire sur-face of the AAA when the material properties become non-linear. The recorded peak stresses for each case are also noticeably different. The peak stress results, along with location of peak stress and overall computational time can be seen in Table 1. Computational time here is rounded to the nearest minute. Peak stresses varied con-siderably depending on the modelling approach. By com-paring the first approach of AAA reconstruction consisting of a single layer of shell elements, AAA(SIMP), the peak stress reduced from 0.8833 MPa to 0.5814 MPa when more realistic non-linear material properties were
imple-mented. This drop in peak stress when modelled from a non-linear approach followed through to the second case also, that is, AAA(MOD). In this comparison of AAAs with 3D 1.5 mm thick uniform walls, the peak stress reduced from 2.232 MPa to 1.034 MPa. In the third case, AAA(COMP), again peak stress was reduced when realistic material properties were utilised. In this case the peak stress reduced from 0.8036 MPa to 0.4219 MPa. These large reductions in peak stress for each comparison can be attributed to the use of realistic material properties, as the geometry of the models are identical. The peak stress in the AAA(SIMP), AAA(MOD) and AAA(COMP) models reduced by 34%, 55% and 47%, respectively, when accounting for material non-linearity. This results in an average reduction in peak stress of 45% in all models.
Table 1: Comparison of peak wall stress, location of peak wall stress and FEA computational time for the AAA(SIMP), AAA(MOD) and the AAA(COMP) models.
Peak Wall Stress (MPa) Location of Peak Stress CPU Time (min)
AAA(SIMP)L 0.8833 Centre of anterior region 1
AAA(SIMP)NL 0.5814 Left lateral region 9
AAA(MOD)L 2.282 Inflection point on inner surface of anterior region 4
AAA(MOD)NL 1.034 Inflection point on inner surface of anterior region 19
AAA(COMP)L 0.8036 Inflection point on inner surface of anterior region 8
AAA(COMP)NL 0.4291 Inflection point on inner surface of anterior region 82 von Mises wall stress distributions for the both the
AAA(MOD)L and AAA(MOD)NL models at an internal pressure of 120 mmHg
Figure 6
von Mises wall stress distributions for the both the
AAA(MOD)L and AAA(MOD)NL models at an internal pressure of 120 mmHg. Wall stress results are normal-ised to the peak stress found AAA(MOD)L. The black mark indicates the region of peak wall stress. Models are shown in the anterior view.
von Mises wall stress distributions for both the AAA(COMP)L and AAA(COMP)NL models at an internal pressure of 120 mmHg
Figure 7
von Mises wall stress distributions for both the
The effect of geometrical modelling parameters can be seen in Figure 8 for the linearly elastic models, and in Fig-ure 9 for the non-linearly elastic models. The location of peak stress is also indicated in these figures. The wall stresses were normalised using the peak wall stress experi-enced in the linear elastic study (Figure 8) and the peak stress obtained in the non-linear elastic study (Figure 9). By comparing the three models examined from a linearly elastic approach, the AAA(MOD)L returned the highest peak stress of 2.282 MPa. Both the AAA(SIMP)L and AAA(COMP)L returned similar peak stresses of 0.8833 MPa and 0.8036 MPa, respectively.
The "cushioning effect" of the ILT which has been previ-ous documented by other researchers [13,17,35-40] can be observed by comparing the linear and non-linear cases of both the AAA(MOD) models and the AAA(COMP) models. The AAA(MOD)L and the AAA(COMP)L models are similar in material properties except for the inclusion of thrombus. There is a 65% reduction in stress when including the ILT in the linear case. This "cushioning effect" is also evident in the non-linear cases, AAA(MOD)NL and AAA(COMP)NL. Here, inclusion of ILT reduces peak stress by 59%.
Discussion
In this study, one patient-specific AAA was selected for rig-orous finite element analysis. The 3D reconstruction and stress analysis was performed using three different
tech-niques, with each technique studied using both linearly elastic and non-linearly elastic material properties. This study is believed to be the first paper to contrast and com-pare established and widely used techniques of comput-ing AAA wall stress distributions. The first technique is classed as AAA(SIMP), the second as AAA(MOD), and the third as AAA(COMP). Each model was then thoroughly analysed and compared to determine any differences in both peak wall stress and also wall stress distribution. The FEA technique used in this study has been validated both experimentally by Morris et al. [18] and numerically by Callanan et al. [19] in idealised AAA models in previous research by our group. Briefly, these previous studies used an idealised AAA model designed by our group using real-istic dimensions from a large population study [41]. Alu-minium moulds were then created using a CAD/CAM procedure, and experimental models manufactured using a technique described in previous research by both Morris et al. [18] and Doyle et al. [31]. The photoelastic method of determining stress distributions was then employed. A numerical model of the same AAA was then analysed using the finite element method, with good agreement between the two. Peak stresses were found to occur at regions of inflection on the surface of the AAA rather than at regions of maximum diameter. This result was also reported by other authors using both FEA [2] and fluid-structure interaction (FSI) [34]. 3D solid stress elements were used in the numerical aspect of this previous work as shell elements resulted in erroneous stress distributions.
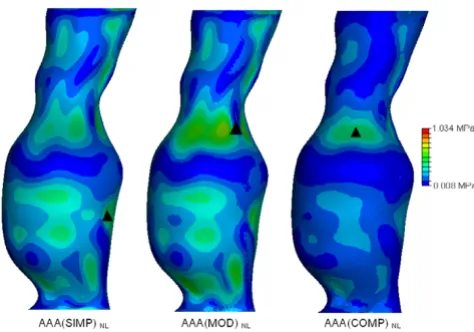
Normalised wall stress results and locations of peak wall stress in all the non-linearly elastic models examined Figure 9
Normalised wall stress results and locations of peak wall stress in all the non-linearly elastic models examined. Wall stress results are normalised to the peak stress found AAA(MOD)NL. The figure shows the effect of modelling parameters and inclusion of the ILT on peak wall stress. The black mark indicates the region of peak wall stress. Location of peak stress for the AAA(MOD)NL and
AAA(COMP)NL models are on the inner surface of the AAA wall. All models are shown in the anterior view.
Normalised wall stress results and locations of peak wall stress in all the linearly elastic models examined
Figure 8
Normalised wall stress results and locations of peak wall stress in all the linearly elastic models examined. Wall stress results are normalised to the peak stress found in
3D reconstruction
The reconstruction process used here compared favoura-bly to previous methods used by our group [30,31]. For the AAA(SIMP) and AAA(MOD) models, reconstruction involved the omission of the ILT, and so the AAA was modelled as a uniform walled vessel, consisting of one structure. For the AAA(SIMP) models, the single layer sur-faces of these 3D reconstructions were then exported for stress analyses. The AAA(MOD) required the generation of a uniform artificial wall 1.5 mm thick in ProEngineer Wildfire 3.0, before being exported to the FEA solver. For the AAA(COMP), the ILT was incorporated into the vessel wall and so the complex AAA had an artificial uniform wall and ILT region of varying thickness. The full model was then exported for stress analyses. The iliac arteries were omitted from these models, as in previous studies [5]. The effect of smoothing on the 3D reconstruction was also examined. Four degrees of smoothing were studied in order to determine the effect smoothing plays on wall stress distributions. Normalised wall stress for the four models is shown in Figure 3. For model 1, the AAA was over-smoothed, and resulted in low wall stress. Smooth-ing was then reduced for model 2, and resulted in higher stress and less gradual changes in stress along the AAA sur-face. Smoothing was then reduced further for models 3 and 4, which both resulted in elevated stresses and also more surface detail. This surface detail results in rapid changes from regions of higher and lower stresses, show-ing jagged wall stress distributions. Also, if the stress dis-tributions of models 3 and 4 were used in the study, they would indicate possible failure sites in abnormal regions of the AAA, as elevated stresses are shown in the healthy proximal neck. This observation is shown in Figure 3 by the black marks indicating these irregular locations of high stress. From this study the optimum level of smooth-ing was determined to be that of model 2, 20 control points per axial slice, and was used in all further recon-structions of this study.
Biomechanical material properties
In each of the three geometrically different models, a lin-early elastic model was examined. It has been argued in previous AAA wall stress studies [23,24] that the aorta behaves more like a linearly elastic material at pressures above 80 mmHg (10.67 KPa). Therefore, many research-ers utilise the much simpler technique of linear elasticity in their studies [2,4,23-25]. Other researchers however, have reported that the use of simplified linearly elastic material properties or other inappropriate tissue constitu-tive models can lead to erroneous stress distributions [2,36-40]. For each of the non-linear models, the material properties of 69 AAA specimens form the basis of the finite strain constitutive model for AAA wall tissue pro-posed by Raghavan and Vorp [3] and has been utilised by many previous researchers [5-7,13,20,26-29]. These
mate-rial properties are believed to resemble the behaviour of the actual AAA wall more closely than those of a linearly elastic material. When utilising the AAA(COMP) method, the ILT is an entirely different structure than that of the AAA wall, and therefore required its own material proper-ties. The ILT was modelled as linearly elastic in the AAA(COMP)L using previously published data [4,28,35]. The non-linear material properties derived by Wang et al. [36] have been implemented to model the ILT region of the AAA(COMP)NL in a more realistic manner.
Computational effort
The computational time for each stress analysis increases with the inclusion of non-linear material properties and complexity of the model, and so a compromise is usually desirable between computational time and accuracy. For this study the computational time for each analysis was recorded and compared. These results can be seen in Table 1. The differences in CPU times can be clearly seen, and highlight how the inclusion of non-linearity increases computational effort. Inclusion of the non-linear behav-iour of the AAA wall resulted in a 9-fold increase in com-putational time for the AAA(SIMP) models, 5-fold increase for AAA(MOD) models, and a 10-fold increase for the AAA(COMP) models. Accounting for the "nonslip" contact between the AAA wall and the ILT region of the AAA(COMP) cases also increased the computational effort.
Wall stress
The modelling techniques used in this study all return sig-nificantly different wall stress results. Peak wall stress was shown to reduce when taking into account the realistic non-linear behaviour of AAA tissue in all three modelling approaches. All wall stress results can be seen in Table 1. When modelled using non-linear material properties, wall stress reduced by 34% in the AAA(SIMP) case, 55% in the AAA(MOD) case, and by 47% in the AAA(COMP) case. These reductions in wall stress can be observed in Figures 5, 6, 7 for each of the three modelling techniques. From these figures it can be seen how the change in mate-rial properties does not significantly alter the stress distri-bution patterns on the surface of the AAA, instead it simply reduces the magnitude of these acting stresses.
dis-tal inflection points, as observed experimendis-tally [18]. Cal-lanan et al. [19] then used 3D stress elements to numerically analyse the ideal AAA model, and found that the stress distributions matched those found experimen-tally, with good correlation between the two sets of results. This background may indicate that the use of shell elements could possibly lead to inaccurate results in real-istic AAA models also. For both the AAA(MOD) and AAA(COMP) models, 3D stress elements were used, and the location of peak stress did not significantly shift when the model accounted for non-linearity of the material. As the location of peak stress did not significantly alter in these models, it is believed that the use of 3D elements is more accurate than the use of shell elements in FE analy-ses of realistic AAAs. As mentioned earlier, this observa-tion was reported in previous research by our group [19].
Figure 8 compares the wall stress results of the three line-arly elastic models examined. Both the AAA(MOD) and AAA(COMP) models showed peak stress regions at inflec-tion points on the inner surface at the proximal region of the AAA sac. These findings are consistent with previous experimental [18] and numerical work [19]. The AAA(MOD)L model returned the highest peak stress in all three cases. The peak stress in AAA(MOD)L is over 2.5
times the peak stress in both AAA(SIMP)L and
AAA(COMP)L. Both the AAA(SIMP)L and AAA(COMP)L models returned similar peak stresses of 0.8833 MPa and 0.8036 MPa, respectively. In comparison, the wall stress results for the three non-linear cases are presented in Fig-ure 9. Again, the AAA(MOD)NL model experienced the highest wall stress, with a peak stress 44% higher than the AAA(SIMP)NLand 59% higher than that experienced in the AAA(COMP)NL model. By including the ILT into the models, peak wall stress was reduced by 65% in the linear case and 59% in the non-linear case. This results in an average reduction of 62% in peak wall stress simply by including the ILT. The ILT absorbs the internal pressure induced by blood flow, and transfers the load to the AAA wall in a reduced amount. From the stress results found for all the various models analysed, the AAA(COMP)NL model is deemed to be the most accurate method of pre-dicting wall stress in AAAs. This model incorporates the realistic non-linear behaviour of both the AAA wall and the ILT, and therefore produces the most accurate wall stress results.
Significance of results
In order to determine the significance of the results reported here, other factors must be considered. It is known that AAA rupture occurs when the locally acting wall stress exceeds the locally acting wall strength. To make valid conclusions from the wall stress results pre-sented here, wall stress was examined with respect to AAA wall strength. The AAA case examined in this study
under-went routine CT scanning, thus detecting the aneurysm. Previous work has identified that AAA wall strength has an average failure stress of 0.942 MPa [16]. If the AAA was analysed for wall stress without inclusion of the ILT, such as cases AAA(MOD)L and AAA(MOD)NL, results would suggest that rupture has already occurred as local stress had exceeded local strength. By implementing the ILT into the model, peak stress was reduced to a level believed to more accurately represent that in vivo. The reported failure strength of 0.942 MPa [16] is higher than the predicted wall stress of 0.4291 MPa, indicating that the rupture potential of the AAA may be equalised. If wall stress results are to be incorporated into the clinical decision-making process, inclusion of non-linear material proper-ties and the ILT may be important to the accuracy of the results.
Limitations
Conclusion
This paper has examined the effect of modelling on the resulting wall stress distributions of a realistic AAA. Three different modelling techniques were implemented and each studied using both linear and non-linear material properties. It was found from the resulting stress distribu-tions that inclusion of the ILT and implementing non-lin-ear material properties may be important if accurate stress distributions are to be obtained. Peak stresses were shown to significantly vary depending on the modelling tech-nique, with the most accurate model, namely AAA(COMP)NL, returning the lowest peak stress. Shell ele-ments were shown to yield poor stress results, as there was a significant shift in peak stress location when non-linear material properties were implemented into the model. Also, in these AAA(SIMP) models the location of peak stress was shown to occur at regions of maximum diame-ter, which previous research [18,19] has shown not to be the case. Simplifying assumptions used in predicting wall stress with FEA should be limited.
The results reported here suggest that even patients with very modest levels of ILT, should be analysed using the more complex, time-consuming methods, such as includ-ing the ILT into FEA models, and the use of realistic, non-linear material properties. The effect of omitting these important parameters may lead to erroneous peak stress results, and ultimately to incorrect surgical decision-mak-ing. The principal idea behind reconstruction and stress analysis of AAAs is to determine the wall stress distribu-tions of the AAA, and the potential of rupture. As rupture will occur when the local wall stress exceeds the local wall strength, and AAA have been shown to have variations in local wall strength [42], the need for improved prediction of peak wall stress location may also have clinical impor-tance.
To conclude, the modelling technique employed in patient-specific FEA of AAAs, may be a valuable additional tool for clinical use.
Declaration of competing interests
The author(s) declare that they have no competing inter-ests.
Authors' contributions
BJD designed the study, reconstructed the AAA models, conducted the wall stress simulations, analysed the results and prepared the manuscript. AC contributed to the wall stress studies and analysis of the results. TMM supervised the study, revised and gave the final approval of the man-uscript. All authors read and approved the final manu-script.
Acknowledgements
We would like to thank (i) the Irish Research Council for Science, Engineer-ing and Technology (IRCSET) Grant no. RS/2005/340 (ii) NIH Grant R01-HL-060670-05A1 (iii) Prof. David A. Vorp of the Centre for Vascular Remodelling and Regeneration, McGowan Institute for Regenerative Medi-cine, University of Pittsburgh (iv) Mr. Eamon Kavanagh, a Consultant Vas-cular Surgeon at Midwestern Regional Hospital, Limerick, for his help in collecting patient data and background information.
References
1. Sakalihasan N, Limet R, Defawe OD: Abdominal aortic aneu-rysm. Lancet365(9470):1577-89. Apr 30–May 6 2005
2. Vorp DA, Raghavan ML, Webster MW: Mechanical wall stress in abdominal aortic aneurysm: influence of diameter and asym-metry. J Vasc Surg 1998, 27(4):632-639.
3. Raghavan ML, Vorp DA: Toward a biomechanical tool to evalu-ate rupture potential of abdominal aortic aneurysm: identi-fication of a finite strain constitutive model and evaluation of its applicability. J Biomech 2000, 33(4):475-482.
4. Di Martino ES, Guadagni G, Fumero A, Ballerini G, Spirito R, Biglioli P, Redaelli A: Fluid-structure interaction within realistic 3D models of the aneurysmatic aorta as a guidance to assess the risk of rupture of the aneurysm. Med Eng Phys 2001, 23:647-655. 5. Fillinger MF, Raghavan ML, Marra SP, Cronenwett JL, Kennedy FE: In vivo analysis of mechanical wall stress and abdominal aortic aneurysm rupture risk. J Vasc Surg 2002, 36:589-597.
6. Fillinger MF, Marra SP, Raghavan ML, Kennedy FE: Prediction of rupture risk in abdominal aortic aneurysm during observa-tion: wall stress versus diameter. J Vasc Surg 2003, 37:724-732. 7. Raghavan ML, Vorp DA, Federle MP, Makaroun MS, Webster MW:
Wall stress distribution on three-dimensionally recon-structed models of human abdominal aortic aneurysm. J Vasc Surg 2000, 31:760-769.
8. Conway KP, Byrne J, Townsend M, Lane IF: Prognosis of patients turned down for conventional abdominal aortic aneurysm repair in the endovascular and sonographic era: Szilagyi revisited? J Vasc Surg 2001, 33:752-757.
9. Darling RC, Messina CR, Brewster DC, Ottinger LW: Autopsy study of unoperated abdominal aortic aneurysms. The case for early resection. Circulation 1977, 56(3 suppl):II161-II164. 10. Cronenwett JL, Murphy TF, Zelenock GB, Whitehouse WM Jr,
Linde-nauer SM, Graham LM: Actuarial analysis of variables associ-ated with rupture of small abdominal aortic aneurysms.
Surgery 1985, 98:472-483.
11. Nicholls SC, Gardner JB, Meissner MH, Johansen KH: Rupture in small abdominal aortic aneurysms. J Vasc Surg 1998,
28:884-888.
12. Vande Geest JP, Wang DHJ, Wisniewski SR, Makaroun MS, Vorp DA:
Towards a non-invasive method for determination of patient-specific wall strength distribution in abdominal aor-tic aneurysms. Ann Biomed Eng 2006, 34(7):1098-1106.
13. Wang DHJ, Makaroun MS, Webster MW, Vorp DA: Effect of intra-luminal thrombus on wall stress in patient-specific models of abdominal aortic aneurysm. J Vasc Surg 2002, 36:598-604. 14. Sacks MS, Vorp DA, Raghavan ML, Federle MP, Webster MW: In-vivo
3D surface geometry of abdominal aortic aneurysms. Ann Biomed Eng 1999, 27:469-479.
15. Vorp DA, Lee PC, Wang DHJ, Makaroun MS, Nemoto EM, Ogawa S, Webster MW: Association of intraluminal thrombus in abdominal aortic aneurysm with local hypoxia and wall weakening. J Vasc Surg 2001, 34:291-9.
16. Raghavan ML, Webster MW, Vorp DA: Ex-vivo biomechanical behavior of abdominal aortic aneurysm: assessment using a new mathematical model. Ann Biomed Eng 1996, 24(5):573-582. 17. Vorp DA, Mandarino WA, Webster MW, Gorcsan J III: Potential influence of intraluminal thrombus on abdominal aortic aneurysm as assessed by a new non-invasive method. Cardio-vasc Surg 1996, 4:732-739.
18. Morris L, O'Donnell P, Delassus P, McGloughlin T: Experimental assessment of stress patterns in abdominal aortic aneurysms using the photoelastic method. Strain 2004, 40:165-172. 19. Callanan A, Morris L, McGloughlin T: Numerical and
Publish with BioMed Central and every scientist can read your work free of charge
"BioMed Central will be the most significant development for disseminating the results of biomedical researc h in our lifetime."
Sir Paul Nurse, Cancer Research UK
Your research papers will be:
available free of charge to the entire biomedical community
peer reviewed and published immediately upon acceptance
cited in PubMed and archived on PubMed Central
yours — you keep the copyright
Submit your manuscript here:
http://www.biomedcentral.com/info/publishing_adv.asp
BioMedcentral European Society of Biomechanics S-Hertogenbosch, Netherlands;
2004.
20. Venkatasubramaniam AK, Fagan MJ, Mehta T, Mylankal KJ, Ray B, Kuhan G, Chetter IC, McCollum PT: A comparative study of aor-tic wall stress using finite element analysis for ruptured and non-ruptured abdominal aortic aneurysms. Eur J Vasc Endovasc Surg 2004, 28(2):168-176.
21. Dobrin PB: Pathophysiology and pathogensis of aortic aneu-rysms. Current concepts. Surg Clin N Am 1989, 69:687-703. 22. Schurink GW, van Baalen JM, Visser MJ, van Bockel JH: Thrombus
within an aortic aneurysm does not reduce pressure on the aneurysmal wall. J Vasc Surg 2000, 31:501-506.
23. Giannoglu G, Giannakoulas G, Soulis J, Chatzizisis Y, Perdikides T, Melas N, Parcharidis G, Louridas G: Predicting the risk of rupture of abdominal aortic aneurysms by utilizing various geomet-rical parameters: Revisiting the diameter criterion. Angiology
2006, 57(4):487-494.
24. Thubrikar MJ, Al-Soudi J, Robicsek F: Wall stress studies of abdominal aortic aneurysm in a clinical model. Ann Vasc Surg
2001, 15:355-366.
25. Hua J, Mower WR: Simple geometric characteristics fail to reliably predict abdominal aortic aneurysm wall stress. J Vasc Surg 2001, 34:308-315.
26. Leung JH, Wright AR, Cheshire N, Crane J, Thom SA, Hughes AD, Xu Y: Fluid structure interaction of patient specific abdominal aortic aneurysms: a comparison with solid stress models.
Biomed Eng Online 2006, 5:33.
27. Li Z, Kleinstreuer C: Blood flow and structure interactions in a stented abdominal aortic aneurysm model. Med Eng Phys 2005,
27:369-382.
28. Papaharilaou Y, Ekaterinaris JA, Manousaki E, Katsamouris AN: A decoupled fluid structure approach for estimating wall stress in abdominal aortic aneurysms. J Biomech 2007, 40:367-377. 29. Speelman L, Bohra A, Bosboom EMH, Schurink GWH, van de Vosse
FN, Makaroun MS, Vorp DA: Effects of wall calcifications in patient-specific wall stress analyses of abdominal aortic aneurysms. J Biomech Eng 2007, 129:1-5.
30. Morris L, Delassus P, Callanan A, Walsh M, Wallis F, Grace P, McGloughlin T: 3D numerical simulation of blood flow through models of the human aorta. J Biomech Eng 2005, 127:767-775. 31. Doyle BJ, Morris LG, Callanan A, Kelly P, Vorp DA, McGloughlin TM:
3D reconstruction and manufacture of real abdominal aortic aneurysms: From CT scan to silicone model. J Biomech Eng
2007 in press.
32. Langewouters GJ, Wesseling KH, Goedhard WJA: The static elas-tic properties of 45 human thoracic and 20 abdominal aortas in vitro and the parameters of a new model. J Biomech 1984,
17:425-435.
33. McDonald DA: The elastic properties of the arterial wall", Blood flow in arteries Baltimore, Williams and Wilkins; 1974:238-282.
34. Scotti CM, Shkolnik AD, Muluk SC, Finol E: Fluid-structure inter-action in abdominal aortic aneurysms: effect of asymmetry and wall thickness. Biomed Eng Online 2005, 4:64.
35. DiMartino E, Mantero S, Inzoli F, Melissano G, Astore D, Chiesa R, Fumero R: Biomechanics of abdominal aortic aneurysm in the presence of endoluminal thrombus: experimental character-isation and structural static computational analysis. Eur J Vasc Endovasc Surg 1998, 15:290-299.
36. Wang DHJ, Makaroun M, Webster MW, Vorp DA: Mechanical properties and microstructure of intraluminal thrombus from abdominal aortic aneurysm. J Biomech Eng 2001,
123:536-539.
37. Wang DHJ, Makaroun MS, Webster MW, Vorp DA: Effect of intra-luminal thrombus on wall stress in patient-specific models of abdominal aortic aneurysm. J Vasc Surg 2002, 36:598-604. 38. Truijers M, Pol JA, SchultzeKool LJ, van Sterkenberg SM, Fillinger MF,
Blankensteijn JD: Wall stress analysis in small asymptomatic, symptomatic and ruptured abdominal aortic aneurysms. Eur J Vasc Endovasc Surg 2007, 33:401-407.
39. Mower WR, Quinones WJ, Gambhir SS: Effect of intraluminal thrombus on abdominal aortic aneurysm wall stress. J Vasc Surg 1997, 26:602-608.
40. Vorp DA, Vande Geest J: Biomechanical determinants of abdominal aortic aneurysm rupture. Arth Throm Vasc Bio 2005,
25:1558-1566.
41. EUROSTAR Data Registry Centre, Laheij R, van Marrewijk C, Buth J:
Progress report on the procedural and follow up results of 3413 patients who received stent graft treatment for infrar-enal aortic aneurysms for a period of 6 years. 2001. 42. Raghavan ML, Kratzberg J, de Tolosa EMC, Hanaoka MM, Walker P,
da Silva ES: Regional distribution of wall thickness and failure properties of human abdominal aortic aneurysm. J Biomech