R E S E A R C H A R T I C L E
Open Access
Discovering functional modules by identifying
recurrent and mutually exclusive mutational
patterns in tumors
Christopher A Miller
1, Stephen H Settle
2,3, Erik P Sulman
3, Kenneth D Aldape
4and Aleksandar Milosavljevic
5*Abstract
Background:Assays of multiple tumor samples frequently reveal recurrent genomic aberrations, including point mutations and copy-number alterations, that affect individual genes. Analyses that extend beyond single genes are often restricted to examining pathways, interactions and functional modules that are already known.
Methods:We present a method that identifies functional modules without any information other than patterns of recurrent and mutually exclusive aberrations (RME patterns) that arise due to positive selection for key cancer phenotypes. Our algorithm efficiently constructs and searches networks of potential interactions and identifies significant modules (RME modules) by using the algorithmic significance test.
Results:We apply the method to the TCGA collection of 145 glioblastoma samples, resulting in extension of known pathways and discovery of new functional modules. The method predicts a role forEP300that was previously unknown in glioblastoma. We demonstrate the clinical relevance of these results by validating that expression ofEP300is prognostic, predicting survival independent of age at diagnosis and tumor grade. Conclusions:We have developed a sensitive, simple, and fast method for automatically detecting functional modules in tumors based solely on patterns of recurrent genomic aberration. Due to its ability to analyze very large amounts of diverse data, we expect it to be increasingly useful when applied to the many tumor panels scheduled to be assayed in the near future.
Background
Tumor characterization projects are beginning to produce a large volume of data about genomic, epigenomic, and gene expression aberrations in tumor samples. This unpre-cedented volume of information has the potential to trans-form our understanding of cancer biology, reveal new biomarkers and drug targets, and accelerate the develop-ment of new cancer therapies. One recent genome-wide tumor characterization effort revealed recurrent somatic aberrations in 91 glioblastoma (GBM) tumors [1]. In that study, mapping of recurrent aberrations in individual genes to known pathways was used to link three core pathways to cancer progression.
A key question is how to extend integrative analysis of somatic genomic aberration data to expand known can-cer pathways and interactions, or discover completely new modules (sets of related genes). Such inference has been done extensively using gene expression arrays, both in yeast and humans [2-4], but due to the dynamic nature of the transcriptome it is often difficult to separate causa-tive events from their effects [5,6]. Instead, we develop an algorithm that infers functional modules directly from mutational patterns. This approach resembles, in some aspects, the mapping of epistatic or synthetic lethal genetic interactions in yeast [7].
Specifically, we focus on patterns of recurrent and mutually exclusive aberrations (RME patterns). Previous analyses of large tumor panels have discovered that alteration of genes comprising a specific functional mod-ule are often observed across a sample collection, but are almost never concurrently found in the same tumor. Examples of these modules includeEGFRandKRASin * Correspondence: [email protected]
5Graduate Program in Structural and Computational Biology and Molecular
Biophysics; and Department of Molecular and Human Genetics, Baylor College of Medicine, Houston, Texas, USA
Full list of author information is available at the end of the article
lung adenocarcinomas [8], the recurrent fusion of
TMPRSS2and variousETSoncogenes in prostate cancer [9], and TP53and MDM2in many different types of malignancies [10]. One explanation for these patterns is that there are functional relationships between the genes. Specifically, an aberration in one of the genes may result in the development of a key tumorigenic phenotype, removing the selective pressure for mutation of the others.
The key insight is that these RME patterns may be used to identify groups of genes that are functionally related. This concept was explored in 2008 in the context of can-cer by Yeang et al., who utilized data from the Catalogue of Somatic Mutations in Cancer (COSMIC) to identify functional relations among mutated genes [11]. Their attempt was hampered by the extremely small number of genes assayed and restriction to only examining point mutations. Their method of establishing the significance of a detected pattern was also limited by the need for computationally expensive permutation testing that does not scale to the large networks that are being produced from next-generation assays.
To address these issues, we developed a new method for detecting RME patterns, which we formalized by using structural reliability models [12]. Specifically, as illustrated in Figure 1a/b, the RME patterns correspond to modules of the“OR”type in these models, where abrogating the function of one member in each module is sufficient for failure. In our case,“failure”refers to the development of a tumor phenotype. We hypothesized that these RME pat-terns are sufficiently informative to enable the discovery of cancer-related functional modules without using any prior information. We then tested this hypothesis by designing an algorithm for accurate and computationally efficient detection of these modules. Our tool uses the Winnow algorithm for network construction and establishes signifi-cance via the algorithmic signifisignifi-cance method, eliminating the need for costly permutation testing. Through simula-tion experiments, we show that this algorithm scales to very large data sets and evaluate the types of modules that are discoverable using data that will be generated by large tumor characterization projects. We validate our method by applying it to a data set currently available though the TCGA data portal, which consists of mutation and copy number data collected from a cohort of 145 primary GBM tumors. The algorithm identifies known modules from core GBM pathways, extends these modules with new members, and discovers new modules that may inform future studies.
Methods
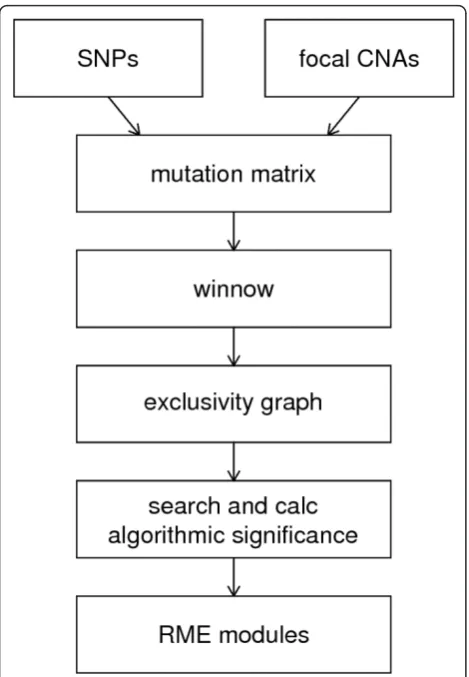
Creating a mutation matrix
We designed our algorithm to be capable of utilizing many disparate sources of mutational data, including
single-nucleotide polymorphisms, copy-number altera-tions, and epigenomic modifications. In a pre-processing step, these diverse data types were converted into a sin-gle two-dimensional binary“mutation”matrix (Figure 2). Data was obtained from the The Cancer Genome Atlas Data Portal (http://tcga-data.nci.nih.gov/). A complete list-ing of samples used can be found in Table 1 in Additional file 1. Point mutations identified by resequencing were fil-tered such that only non-synonymous, validated mutations remained. Genes driving copy number alterations were detected using normalized probe-level data from Agilent 244A copy number arrays. These were processed to infer regions of amplification and deletion using circular binary segmentation as implemented in the R package DNAcopy [13]. Log-ratio thresholds for amplification and deletion were set at 1.5 standard deviations from the mean probe intensity. These were intersected with peaks of recurrent copy-number change identified by the RAE algorithm [14], then copy number variants were removed and driver genes were selected as described in Additional file 1.
These two forms of data were then merged into a two-dimensional mutation matrix. Each gene in each sample was checked against these single nucleotide and copy number mutations and a matrix was created such that if sampleicontained an alteration in genej, the positionxi,
jin the matrix was equal to 1, otherwise it was set to 0.
This matrix is available at http://brl.bcm.tmc.edu/rme/ gbm.dat
Constructing a gene network with Winnow
The first step in our module detection pipeline was to filter the mutation matrix and retain only genes that meet a set frequency of recurrence, as genes altered in only one or a few samples do not contain enough infor-mation to calculate meaningful exclusivity scores.
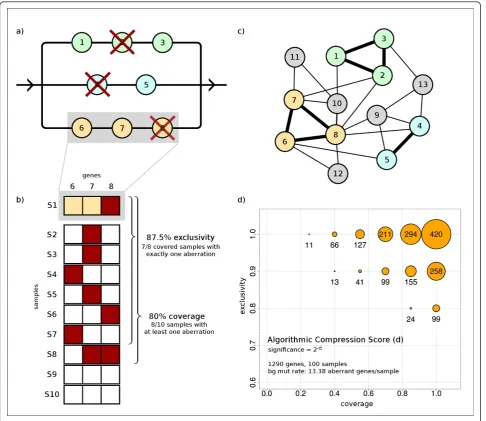
A possible next step would be to calculate the exclusiv-ity score between each pair of genes, defined as the num-ber of samples where exactly one of the pair is mutated divided by the number of samples where at least one of the pair is mutated. (Figure 1b). These data could be used to create a network where each node is a gene and each edge weight is the exclusivity between the genes. The highly connected sub-networks would then be used as a starting point for a focused combinatorial search for modules. The disadvantage of this approach is that the networks quickly becomes much too large and densely connected to effectively identify sub-networks.
The Winnow algorithm was run in an online setting, using one gene as a classifier and the rest of the muta-tion array as training data. In the first winnow run, all the bits in the array were flipped, such that we calcu-lated how well each aberration in the classifier is pre-dictive of non-aberration in each gene of the matrix.
Then, we flipped the bits of the classifier, such that we calculated how well each non-aberration in the classi-fier was predictive of aberration in each gene of the matrix. The resulting weights were used to score the edges of the graph, then low-scoring edges were removed.
Since the range of weights for each run was deter-mined by how quickly Winnow finds an optimal classi-fier, we did not use an absolute threshold value when removing edges. Instead, for each classifier gene, we took the second highest weight and retained all edges with a score greater than or equal to that value.
Identifying candidate modules
We then used each gene in the network as a starting point in a greedy local combinatorial search for RME modules, such that we evaluated all possible connected modules with size below the specified limit. We report those that have algorithmic significance above a prede-termined threshold, based on the size of the input data (Figure 1C). These potential RME modules are binned by number of genes and sorted by significance value. The module with the largest size and highest
significance (as described in the next section) is kept, and all other modules containing any of the same genes are discarded. This process is repeated until all bins are empty.
Evaluating modules by performing an algorithmic significance test
The problem of determining whether a module (subset of genes) contains a significant RME pattern of aberra-tions can be addressed using probabilistic models or heuristic scores. Both approaches would generally require establishment of extremely low significance values (pre-Bonferroni correction), which would in turn require many cycles of computationally demanding per-mutation testing. To eliminate this bottleneck, we employ a new implementation of the computationally much less demanding algorithmic significance test [16], which has recently been applied in the context of Hid-den Markov Models [17-19], but is also applicable as a general method for pattern discovery [20,21]. As illu-strated in Figure 1d, the algorithm determines signifi-cance values directly.
Letkbe the number of samples,mbe the number of genes in a module, and let X be aktimesmmatrix of bin-ary values, with each value indicating presence (xi,j= 1) or
absence (xi,j= 0) of an aberration of thej-th gene in thei
-th sample. The algori-thmic significance test compares -the number of bits required to encode the binary matrix X by the RME Algorithm to the number of bits required to encode the matrix under the null hypothesis. The RME algorithm attempts to encode the data in fewer bits by using the assumption that mutations occur at an unusually high frequency in a mutually exclusive fashion, vs. the Null Algorithm (corresponding to the null hypothesis) which assumes that aberrations occur independently at their background frequencies.
The presence of an RME pattern (Figure 1b) will allow the RME algorithm to encode the matrix X significantly more concisely. To minimize overall encoding length, the RME Algorithm is provided the identity of themgenes out of the total ofngenes assayed (encoded inmlog(n) bits, an implicit penalty that corrects for multiple test-ing), and the counts of aberrations for each sample,ai,0,i
= 1,...,kand counts of aberrations for each gene,b0,j,j =
1,...,m(encoded inklog*(m) andmlog*(k) bits respec-tively, where log* denotes iterated logarithm). Using this information, the RME Algorithm first sorts the samples, then the genes by their counts of aberrations, placing the most frequently altered samples at the top of the matrix, and the genes with most aberrations at the beginning of each row. As a penalty for this sorting, we reduce the score by the number of bits necessary to represent the new sorted order.
The algorithm then examines the sorted matrix row by row in a left to right order, keeping track of how many aberrations have been observed, and calculates a probability of observing an aberration in the next cell of the matrix and encoding the bit optimally according to the calculated probability. To describe how the probabil-ity is calculated, we first introduce additional notation. Letp(xi,j = 1) denote the number of unobserved
muta-tions divided by the number of unobserved posimuta-tions remaining in the matrix. Let ai,j and bi,j denote the
number of unobserved aberrations in the current gene and sample respectively.
Then, we can encode elements of X according to the following probability distribution: Ifai,jandbi,j are both
larger than 0, and a one has not been observed in this row yet, we use the following formula (derived by apply-ing Bayes’rule):
pRME(xi,j= 1)≈p(xi,j= 1|ai,j,bi,j) =
p(xi,j= 1|ai,j)·p(xi,j= 1|bi,j)
p(xi,j= 1)·
p(xi,j= 0|ai,j)·p(xi,j= 0|bi,j)
p(xi,j= 0)
+p(xi,j= 1|ai,j)·p(xi,j= 1|bi,j)
p(xi,j= 1)
else we estimate that the probability is very low (but not equal to zero in order to avoid infinitely large penalties):
pRME(xi,j= 1)≈0
In contrast, the Null algorithm encodes optimally assuming that thekgenes contain aberrations at back-ground frequency (no enrichment), denoted pNULL(1),
and that mutations occur independently in each of the k genes.
The encoding length difference between the null and RME algorithms and the algorithmic significance are calculated in the following two steps:
Step 1. Encode the binary aberration matrix.
Setd’to 0. Examine the aberration matrix row by row, in left to right order incrementingd’as follows in each cell (i,j):then
Ifxi,j= 1 then:
d←d+ (−log(pNULL(1)) + log(pRME(1))
Else,
d←d+ (−log(pNULL(0)) + log(1−pRME(1))
where log denotes binary logarithm.
Step 2. Account for additional information (including implicit correction for multiple testing) and calculate significance.
d=d−mlog(n)−klog∗(m)−mlog∗(k)
Calculate significance value 2-d.
Whole-genome simulations
In order to benchmark the performance of this algo-rithm, we ran simulations on synthetic data sets. When
generating sets with the same size as the current glio-blastoma data (145 samples, 1290 genes), the actual dis-tribution of mutations from the TCGA data was used to create random matrices. We simulated larger data sets using the knowledge that the current gene list is heavily biased towards known and frequently-altered oncogenes, so we compensated by assuming that 0.1% of newly con-sidered genes will have a mutation frequency greater than 0.2, 0.9% will have frequency between 0.2 and 0.1, and 99% will have frequency less than 0.1.
We then used a binning procedure, where we started with the empirical GBM distribution, and calculated the proportion of mutations in each bin. To compensate for the fact that the distribution is heavily biased towards low-frequency mutations, we used bins of size 1% until we reached the tenth percentile, then used bins of size 5% to allow for some variability. We then distributed the specified proportion of aberrations randomly within each bin. We tested coverage levels between 50 and 100%, and generated RME Modules such that the num-ber of alterations matched the given coverage level, exclusivity was 100%, and each gene was altered in a random number of samples that exceeded the minimum threshold.
Determination of prognostic significance
Affymetrix HG133-based GeneChip mRNA expression profiling data from two published datasets, the TCGA ("TCGA”, n = 260) and the Erasmus Medical Center, Netherlands ("Erasmus”, n = 153) were obtained as raw intensity files (.CEL files) and normalized [1,22]. Sam-ples were included for all cases in which clinical data were available (patient age at diagnosis, tumor grade, survival time, and vital status) and for which the diagno-sis was primary glioblastoma. Mapping of Affymetrix GeneChip probes was performed using custom chip definition files (CDF) based on the NCBI Entrez Gene v.11 (http://brainarray.mbni.med.umich.edu/Brainarray/. Database/CustomCDF/genomic_curated_CDF.asp) and probesets were summarized by median intensity [23]. Recursive partitioning analysis was performed to sepa-rate samples as either high or low expression. Univariate comparison of survival by EP300 expression was per-formed by the Kaplan-Meier method [24] with signifi-cance determined using the log-rank test. Multivariate analysis was performed using the Cox proportional hazards model [25]. All analyses were conducted using JMP Genomics 4.0.
Implementation and availability
galaxy, under Tools > Pattern Discovery. Documentation and example files are included at each location.
Results
Discoverability of RME modules using current and anticipated TCGA project data
To determine how well our method detects RME mod-ules over the background noise of passenger mutations, we ran experiments on synthetic data using several dif-ferent parameter sets. As described in the methods, we created a randomized mutation matrix then added an RME module consisting of two to five genes. One thou-sand simulations were run for each parameter set to determine whether the seeded RME module could be detected. We measured sensitivity by the fraction of simulations where the seeded module was detected above the significance threshold. We measured precision by the fraction of simulations where the algorithm detected the seeded genes as more significant than any other module.
Genes altered in only a few samples did not contain enough information to calculate meaningful exclusivity scores, so we tested two different recurrence thresholds. When considering only genes that are altered in at least 10% of the samples, the algorithm had high sensitivity
and precision, with smaller modules being more suscep-tible to false positives that arise by chance (Figure 3, left column)
We then evaluated the characteristics of pathways that are discoverable using the data that is to be generated by future stages of the TCGA project. We increased the number of samples to 500 and increased the number of resequenced genes to either the 6000 currently being evaluated in TCGA Phase 2, or the ~18000 that may be examined with whole-exome coverage (Figure 3, center and right panels). The 6000-gene tests showed that both metrics increase, allowing us to accurately detect mod-ules even at lower recurrence rates. When testing 18000 gene assays, we randomly generated more gene pairs with good exclusivity, which had a slight negative impact on sensitivity at lower recurrence levels, but overall, the method continued to perform well.
Comparison to other methods
We also compared the performance of our algorithm to previously published methods based on calculating p-values for exclusivity from a hypergeometric test or from a log-likelihood ratio [11]. We benchmarked the performance of all three methods on a synthetic data set of 145 samples and 1290 genes, with two-gene modules
seeded in. These were created as described in the Meth-ods section. We find that all three methMeth-ods have high sensitivity, but the two comparison methods have very low precision, and are prone to reporting false positives (Figure 2 in Additional file 1).
This can be explained as follows: The formula for cal-culating the likelihood ratio between the frequency of joint mutations relative to the best simpler model, as given in Yeang, is:
χ(x1,x2) =
P(x1= 1,x2= 1)
P(x1= 1)P(x2= 1)
where the denominator is the empirical frequency of mutations in the first and second genes respectively, and the numerator is the empirical frequency of co-muta-tion. Thus, for two genes that are not mutated in the same samples, the likelihood ratio is 0 whether they each have one mutation, or they both have many muta-tions. Because of this characteristic, the likelihood method almost always reports false positive modules of genes that are exclusive by chance. Such modules usually have much lower coverage than the true seeded module. Since our algorithmic significance test considers recurrence as well as mutual exclusivity, it much more reliably excludes these false positives. The hyper-geo-metric p-value calculations described in Yeang suffer from a similar problem.
These other methods are also orders of magnitude slower than algorithmic significance, since they require many rounds of permutation testing to do multiple test-ing correction. Averaged across ten trials, the likelihood-based method had an average runtime of 899.377s, the hypergeometric method had an average runtime of 409.543s, and the algorithmic significance method had an average runtime of 0.779s. As described in the Meth-ods section, algorithmic significance handles the pro-blem of multiple testing using a penalty that takes very little time to compute. In contrast, both of the other methods require a step where the input data is per-muted 1000 times and the number of combinatorial pat-terns is assessed. Unsurprisingly, this step makes these methods much slower.
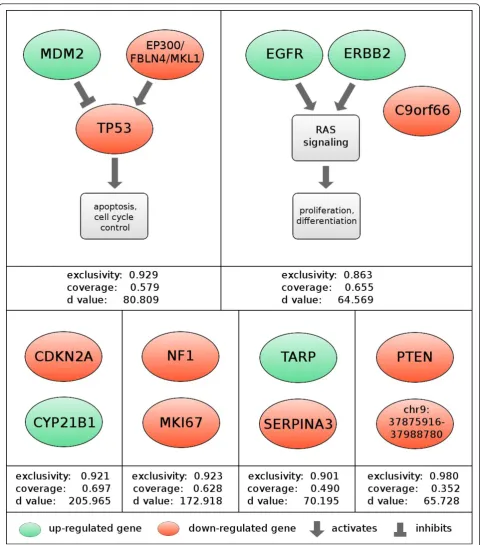
Application to glioblastoma tumors
We next applied this method to data from genomic assays run on 145 primary GBM tumor samples, using a conservative recurrence threshold of 10%. The modules were ranked by their algorithmic significance scores. The top six modules listed in Figure 4 exceeded a signif-icance cutoff of 2-50 (~= 8.88 × 10⁻¹⁶). Three of the six modules contain components of core GBM pathways reported by the TCGA consortium [1], which examined a subset of the 145 tumors we analyzed. After identifica-tion of modules was complete, we used a combinaidentifica-tion
of automated annotation and manual examination to identify the common functional roles that module mem-bers may play.
Rediscovery and expansion of known modules
The highest-scoring rediscovered module consisted of alterations to the genes TP53andMDM2 along with a ~5 Mb recurrently deleted region on chromosome 22 (Figure 4). TP53 regulates a variety of oncogenic pro-cesses and mutations of TP53 have been reported in most tumor types [26]. MDM2inhibits TP53-mediated transcription, and aberrations in the pair have often been reported as mutually exclusive [10]. The associated region on chr22 contains three potential driver genes. Of the three,EP300seems to be the most likely driver, as its product is known to complex with and acetylate the product of TP53, and its disruption leads to decreased function of theTP53 product [27]. The other two genes are not known to interact with the TP53
pathway.
We expect that alterations in any of these three mod-ule components would disrupt the tumor-suppressive activity ofTP53. Though the relationship of MDM2and
TP53 was central to one of the GBM pathways reported by the TCGA Consortium, the link betweenEP300 dys-regulation and the TP53 pathway has not been pre-viously reported in glioblastoma.
We also observed that the pattern of regulation in this module is concordant with our knowledge about the tumor-suppressive activity of theTP53pathway. Because the information about the nature (up or down) of the aberrations was not encoded into our matrix, this agree-ment with prior knowledge serves as an additional vali-dation of our results (Figure 4). We observe similar concordance in other known pathways.
The second rediscovered module consists of the genes
ERBB2,EGFR, andC9orf66. BothERBB2andEGFRare signal transduction proteins that induce the RTK/RAS signaling pathway, causing unconstrained proliferation, and they can interact directly to form a heterodimer [28]. Our algorithm extended this pathway by adding the largely unstudied C9orf66 which contains non-synonymous point mutations in 15 tumors. This sug-gests that the product ofC9orf66may play a tumor sup-pressive role in the context of theRASpathway.
The first module that does not directly map to a known pathway consists of the genes CDKN2A and
cluster of adjacent genes isCDK4, a cyclin-dependent kinase that is an inhibitor of the RB1tumor suppressor and known target of CDKN2A’s p16 product. The inter-action between CDK4andCDKN2A is part of the third and final core pathway of GBM, as defined by the TCGA consortium. We suggest that this interaction may be responsible for the mutational pattern we observe.
Newly Discovered Modules
In addition to finding RME modules that are compo-nents of known pathways, we discovered modules that are previously unreported. Several have intriguing func-tional similarities, such as the pro-apoptotic roles of bothSHB, which may be driving the deletion of a small region on chromosome 9, andPTEN. The discovery of these modules provides intriguing hypotheses about the related roles of these genes in tumorigenesis. Compre-hensive descriptions and annotation of each module can be found in Additional file 1.
EP300predicts survival for patients with glioblastoma
To show how one might leverage our gene module dis-covery process to produce clinically useful results, we decided to investigate EP300 further. Our method sug-gests that EP300 plays a role in the p53 pathway, which is strengthened by previous studies that show its interaction withTP53. Furthermore,EP300aberrations have been observed in other types of cancer, but it has not been specifically linked to the progression of glioblastoma. Thus,we hypothesized that expression of EP300may
have value as a new prognostic indicator in glioblastoma. To validate this, we examined the relation between mRNA expression levels ofEP300and patient survival. Using two datasets, one from the TCGA and a second from the Netherlands (Erasmus), we examined the expression ofEP300in 260 and 153 cases, respectively. HighEP300expression was associated with improved survival (Figure 5), with a median survival of 72 weeks in the high-expressing cases vs. 55 weeks in the low-expres-sing for the TCGA cohort (p = 0.030, log-rank) and 42 weeks vs. 17 weeks for the Erasmus cohort (p < 0.001, log-rank). This survival prediction remained significant when adjusted for patient age, the most significant prog-nostic factor in glioblastoma [30] [p = 0.0141, HR = 1.81 (95 CI 1.12-3.18), for TCGA; p = 0.0112, HR = 1.55 (95 CI 1.12-2.08) for Erasmus, Cox proportional hazards model]. Interestingly, expression levels of TP53 and MDM2 do not have similar predictive value.
Conclusions
We have developed a sensitive, simple, and fast method for automatically detecting functional modules in tumors based on patterns of recurrent genomic aberra-tion alone. The results indicate that integrative analyses of genome characterization data have the potential to identify groups of genes that have related roles in pro-ducing cancer phenotypes. Furthermore, it is possible to generate hypotheses about pathway membership, or about the functional relevance of unexpected or unchar-acterized genes by using co-occurrence in an RME mod-ule as an indicator of function.
Our experiments do show that RME patterns are not perfect. The fact that 30-70% of samples are not covered by individual modules may be explained by several fac-tors, including low-frequency mutations that fall below our recurrence thresholds, the small proportion of genes that were assayed for somatic point mutations, and lack of comprehensive epigenomic assays, which could give information on gene silencing. As the costs of massively parallel sequencing drop, we expect more complete cov-erage of a larger number of samples, which may resolve the first two issues. A larger number of genes are also slated to be assayed for abnormal methylation patterns soon, and this algorithm can incorporate such data into future analyses. These comprehensive whole-genome data will undoubtedly improve our ability to detect functional modules and eliminate any bias that comes from operating on a reduced gene set.
We also note that while our method does not use pathway, interactome, and other network information, we do not suggest this method as a complete replace-ment for analyses that do use these data. In fact, we envision extensions of this method that may use back-ground knowledge in a controlled and explicit way. At this point, we also do not make use of aberration co-occurrence, which may suggest a lack of functional simi-larity. Such overlapping aberrations do not lend them-selves to the same kind of clear and compelling interpretation as RME patterns, but may be nonetheless useful in future expansions of this method.
As the throughputs of technologies and the capacity of data producing projects increases, so will the signifi-cance and abundance of RME patterns. In anticipation of this trend, this method has been designed at the outset to accommodate an increasing diversity and volume of genome characterization information. We therefore anticipate that the method will be increas-ingly useful in generating hypotheses that will drive specific experiments and increase understanding of cancer progression.
Additional material
Additional file 1: Supplemental Methods and Results.
Acknowledgements
We gratefully acknowledge Dr. Pim J. French, Dr. Lonneke M. Gravendeel, and Dr. Peter S. Smitt of the Erasmus Medical Center, The Netherlands for providing raw intensity files for the Erasmus dataset. We also thank Dr. Chen-Hsiang Yeang of the Institute of Statistical Science of Academia Sinica for providing code that enabled us to do algorithmic comparisons. The results published here are in whole or part based upon data generated by The Cancer Genome Atlas pilot project established by the NCI and NHGRI. Information about TCGA and the investigators and institutions who constitute the TCGA research network can be found at http://
cancergenome.nih.gov.
Funding: This research has been funded by the NIH grants R01-HG004009 and R21-HG004554 from the National Human Genome Research Institute and R33-CA114151 from the National Cancer Institute to AM.
Author details
1Graduate Program in Structural and Computational Biology and Molecular
Biophysics, Baylor College of Medicine, Houston, Texas, USA.2Department of Molecular and Cellular Biology, Baylor College of Medicine, Houston, Texas, USA; and Department of Radiation Oncology, the University of Texas M. D. Anderson Cancer Center, Houston, Texas, USA.3Department of Radiation Oncology, the University of Texas M. D. Anderson Cancer Center, Houston, Texas, USA.4Department of Pathology, the University of Texas M. D. Anderson Cancer Center, Houston, Texas, USA.5Graduate Program in Structural and Computational Biology and Molecular Biophysics; and Department of Molecular and Human Genetics, Baylor College of Medicine, Houston, Texas, USA.
Authors’contributions
CM and AM: project conception, algorithm design. CM: implementation, simulations, and application. SS, ES, KA: survival analysis. CM and AM manuscript preparation. AM project leadership and supervision. All authors read and approved the final manuscript.
Competing interests
The authors declare that they have no competing interests.
Received: 25 June 2010 Accepted: 14 April 2011 Published: 14 April 2011
References
1. Cancer Genome Atlas Consortium:Comprehensive genomic
characterization defines human glioblastoma genes and core pathways.
Nature2008,455:1061-1068.
2. Eisen MB, Spellman PT, Brown PO, Botstein D:Cluster analysis and display of genome-wide expression patterns.Proceedings of the National Academy of Sciences of the United States of America1998,95:14863-14868. 3. Basso K, Margolin AA, Stolovitzky G, Klein U, Dalla-Favera R, Califano A:
Reverse engineering of regulatory networks in human B cells.Nat Genet 2005,37:382-390.
4. Segal E, Friedman N, Koller D, Regev A:A module map showing conditional activity of expression modules in cancer.Nat Genet2004,
36:1090-1098.
5. Masayesva BG, Ha P, Garrett-Mayer E, Pilkington T, Mao R, Pevsner J, Speed T, Benoit N, Moon C, Sidransky D, Westra WH, Califano J:Gene expression alterations over large chromosomal regions in cancers include multiple genes unrelated to malignant progression.Proceedings of the National Academy of Sciences of the United States of America2004,
101:8715-8720.
6. Miklos GLG, Maleszka R:Microarray reality checks in the context of a complex disease.Nat Biotechnol2004,22:615-621.
7. Tong AHY, Lesage G, Bader GD, Ding H, Xu H, Xin X, Young J, Berriz GF, Brost RL, Chang M, Chen Y, Cheng X, Chua G, Friesen H, Goldberg DS, Haynes J, Humphries C, He G, Hussein S, Ke L, Krogan N, Li Z, Levinson JN, Lu H, Menard P, Munyana C, Parsons AB, Ryan O, Tonikian R, Roberts T, Sdicu A, Shapiro J, Sheikh B, Suter B, Wong SL, Zhang LV, Zhu H, Burd CG, Munro S, Sander C, Rine J, Greenblatt J, Peter M, Bretscher A, Bell G, Roth FP, Brown GW, Andrews B, Bussey H, Boone C:Global Mapping of the Yeast Genetic Interaction Network.Science2004,303:808-813. 8. Gazdar AF, Shigematsu H, Herz J, Minna JD:Mutations and addiction to
EGFR: the Achilles‘heal’of lung cancers?Trends Mol Med2004,
10:481-486.
9. Tomlins SA, Rhodes DR, Perner S, Dhanasekaran SM, Mehra R, Sun X, Varambally S, Cao X, Tchinda J, Kuefer R, Lee C, Montie JE, Shah RB, Pienta KJ, Rubin MA, Chinnaiyan AM:Recurrent Fusion of TMPRSS2 and ETS Transcription Factor Genes in Prostate Cancer.Science2005,
310:644-648.
10. Momand J, Zambetti GP, Olson DC, George D, Levine AJ:The mdm-2 oncogene product forms a complex with the p53 protein and inhibits p53-mediated transactivation.Cell1992,69:1237-1245.
12. Ross SM:Introduction to Probability Models, Seventh Edition.Academic Press;, 7 2000.
13. Olshen AB, Venkatraman ES, Lucito R, Wigler M:Circular binary segmentation for the analysis of array-based DNA copy number data.
Biostatistics2004,5:557-572.
14. Taylor BS, Barretina J, Socci ND, DeCarolis P, Ladanyi M, Meyerson M, Singer S, Sander C:Functional Copy-Number Alterations in Cancer.PLoS ONE2008,3:e3179.
15. Littlestone N:Learning Quickly When Irrelevant Attributes Abound: A New Linear-Threshold Algorithm.Mach. Learn1988,2:285-318. 16. Milosavljevic A, Jurka J:Discovering simple DNA sequences by the
algorithmic significance method.Comput Appl Biosci1993,9(4):407-411. 17. Karplus K:Using markov models and hidden markov models to find
repetitive extragenic palindromic sequences in Escherichia Coli.Technical Report UCSC-CRL-94-241994.
18. Mitrophanov AY, Borodovsky M:Statistical significance in biological sequence analysis.Brief Bioinform2006,7:2-24.
19. Eddy SR:A Probabilistic Model of Local Sequence Alignment That Simplifies Statistical Significance Estimation.PLoS Comput Biol2008,4: e1000069.
20. Giancarlo R, Scaturro D, Utro F:Textual data compression in computational biology: a synopsis.Bioinformatics2009,25:1575-1586. 21. Milosavljevic A:Discovering Dependencies via Algorithmic Mutual
Information: A Case Study in DNA Sequence Comparisons.Mach. Learn 1995,21:35-50.
22. Gravendeel LA, Kouwenhoven MC, Gevaert O, de Rooi JJ, Stubbs AP, Duijm JE, Daemen A, Bleeker FE, Bralten LB, Kloosterhof NK, De Moor B, Eilers PH, van der Spek PJ, Kros JM, Sillevis Smitt PA, van den Bent MJ, French PJ:Intrinsic Gene Expression Profiles of Gliomas Are a Better Predictor of Survival than Histology.Cancer Res2009,69:9065-9072. 23. Dai M, Wang P, Boyd AD, Kostov G, Athey B, Jones EG, Bunney WE,
Myers RM, Speed TP, Akil H, Watson SJ, Meng F:Evolving gene/transcript definitions significantly alter the interpretation of GeneChip data.Nucleic Acids Res2005,33:e175-e175.
24. Kaplan EL, Meier P:Nonparametric estimation from incomplete observations.J.of the American Statistical Association1958,53:457-48. 25. Cox DR:Regression models and life tables.J Royal Stat Soc1972,
34:187-220.
26. Levine AJ:p53, the cellular gatekeeper for growth and division.Cell1997,
88:323-331.
27. Dornan D, Shimizu H, Perkins ND, Hupp TR:DNA-dependent acetylation of p53 by the transcription coactivator p300.J. Biol. Chem2003,
278:13431-13441.
28. Goldman R, Levy RB, Peles E, Yarden Y:Heterodimerization of the erbB-1 and erbB-2 receptors in human breast carcinoma cells: a mechanism for receptor transregulation.Biochemistry1990,29:11024-11028.
29. Kim H, Huang W, Jiang X, Pennicooke B, Park PJ, Johnson MD:Integrative genome analysis reveals an oncomir/oncogene cluster regulating glioblastoma survivorship.Proceedings of the National Academy of Sciences 2010,107:2183-2188.
30. Sulman EP, Guerrero M, Aldape K:Beyond Grade: Molecular Pathology of Malignant Gliomas.Seminars in Radiation Oncology2009,19:142-149. Pre-publication history
The pre-publication history for this paper can be accessed here: http://www.biomedcentral.com/1755-8794/4/34/prepub
doi:10.1186/1755-8794-4-34
Cite this article as:Milleret al.:Discovering functional modules by identifying recurrent and mutually exclusive mutational patterns in
tumors.BMC Medical Genomics20114:34.
Submit your next manuscript to BioMed Central and take full advantage of:
• Convenient online submission
• Thorough peer review
• No space constraints or color figure charges
• Immediate publication on acceptance
• Inclusion in PubMed, CAS, Scopus and Google Scholar
• Research which is freely available for redistribution