Does a Higher Level of Capital Ensure Lower Risk for a Bank?
Evidence from the Vietnamese Banking System
Dung Tien Nguyena Hien Thi Kim Nguyenb
Quy Nhon University
Abstract: The relationship between bank capital and risk is one of the conventional and highly debatable issues in banking literature. In the context of this paper, we apply the two-step generalized method of moments (GMM) technique for dynamic panels for the Vietnamese banking sector over the 1999-2014 period to investigate how risk is sensitive to capital regulations. As controlling both bank-specific characteristics and macroeconomic variables, we found a negative relationship between capital and risk which is proxied by two alternative Z-score measurements. Our findings not only support the moral hazard hypothesis where banks have incentives to exploit explicit and implicit deposit insurance schemes but also reveal the first direct beneficiaries from the regulations following Basel I standards in Vietnam that domestic banks with a higher capital level are more likely to avoid default and risk. However, increasing capital and improving operations management should be complementary criteria to ensure financial system safety.
Keywords: Bank capital, dynamic panel, risk, Vietnam JEL classification: G21, G32, C23
1. Introduction
Disputes on the traditional issue of capital-risk nexus have not come to an end yet. Despite existing theories and a wide range of empirical findings, the effects of capital regulations on risk are still debatable with both beneficial and harmful potentials.
From the regulatory perspective, a bank is considered sufficiently non-risk-averse and has a tendency to choose a riskier asset mix in facing an increasing binding capital requirement (Koehn & Santomero, 1980), probably leading to a higher possibility of bankruptcy. This hypothesis is known as the base for the positive impact of capital on risk, which is also supported by risk-based capital standards, looking at the other way around and arguing that banks often increase their capital ratio to offset an increase in asset risk (Shrieves & Dahl, 1992). Academics also raise the capital buffer theory considering that higher capital is capable for higher shocks and failure; therefore, higher buffer banks probably set a positive risk and the opposite sign is observed in low-capitalised ones (Jokipii & Milne, 2011). Some other empirical studies favour the
a Faculty of Finance-Banking and Business Administration, Quy Nhon University, 170 An Duong Vuong, Quy
Nhon, Binh Dinh, Vietnam, 590000. Email: nguyentiendung@qnu.edu.vn (Corresponding author)
b Faculty of Finance-Banking and Business Administration, Quy Nhon University, 170 An Duong Vuong, Quy
Nhon, Binh Dinh, Vietnam, 590000. Email: nguyenkimhien@qnu.edu.vn
positive relationship between capital and risk such as Altunbas, Carbo, Gardener and Molyneux (2007), Ghosh (2014), Iannotta, Nocera and Sironi (2007), Pettway (1976)
and Rime (2001).
On the contrary, Berger, Herring and Szegö (1995) discussed the reversed relation-ship between capital and risk involved in the agency and moral hazard problems. Regarding the former issue, the conflicts among bank shareholders, managers and creditors, i.e. higher capital prevents expropriation problems between shareholders and creditors but aggravates conflicts of interest between shareholders and managers, will drive a bank to adopt less risk as it has higher capital level. In addition, both banks and depositors can engage in imprudent banking practices when bank shareholders are more likely to substitute riskier assets for safer creditors thanks to explicit and implicit deposit insurance schemes, which is called moral hazard behaviour. Among the academics, Jacques and Nigro (1997), Jahankhani and Lynge (1980), Karels, Prakash and Roussakis (1989) and Lee and Hsieh (2013) provided empirical evidence of negative effect of capital on bank risk.
Since the empirical findings are not clear-cut depending on different samples, measurements and specifications, this paper aims to examine the impacts of capital on risk of the Vietnamese banking sector over the period 1999-2014 applying the two-step system generalized method of moments (GMM) technique and two different proxies of risk (Z-score) whereby it contributes to the literature in a few important ways. First, while there is a variety of common risk measures such as loans to deposits, liquid assets to total assets, loan losses to total loans, systematic risk, total risk, variance of roa1, variance of roe2, this study uses two alternative time-varying Z-score measures as a complement to the literature to proxy banking insolvency probability. Application of different Z-scores is appropriate in specific contexts and data (Lepetit & Strobel, 2013), hence this can help fill the literature gap by revealing the capital-risk nexus in the specific stance of the Vietnamese banking sector. Second, to our knowledge, this is one of the pioneering studies employing two-step system GMM specification to examine the dynamic effect of capital on bank risk, which is proper as using panel data and time-varying proxies for risk. The GMM technique is more efficient than a static model to analyse dynamic panel data, control endogeneity, heteroskedasticity, and autocorrelation simultaneously. Especially, two-step GMM outperforms other estimators using ordinary least squares (OLS), within groups (fixed effect), and difference GMM specifications in case of growth models (Bond, Hoeffler, & Temple, 2001) and still outperforms in this paper. Third, while not much literature has focussed on Asian banking systems, this study serves as one of the first examining the Vietnamese banking industry along with discovering the role of macroeconomic variables. Specifically, the country has experienced dynamic social economic transformation in which the banking sector plays an increasingly important role. Tremendous banking reforms in accordance with international banking regulations and bank restructuring programs were carried out in this country, which provides an interesting environment for doing research. This study then can provide banking regulators with sufficient suggestions to supervise the banking system appropriately.
1 roa is return on assets.
The remainder of the paper is organised as follows. Section 2 provides an over-view of the relevant literature. Section 3 describes the econometric model and data sources employed herein. Section 4 discusses the empirical results and section 5 presents conclusions.
2. Literature Review
Banks can use either debt or equity capital to finance their assets. Although debt is less costly, it is more risky for banks than equity and carries high fixed costs that must be paid to remain solvent. Hence, bank regulators with preference for safety are typically inclined to increase capital adequacy ratio to reduce the likelihood of failure. However, whether a higher level of capital ensures lower risk for banks is still ambiguous, both in terms of theory and empirical evidence. Table 1 summarises some striking empirical findings where bank risk and capital were proxied by different measures. Note that there is a wide range of risk measures in the literature. The most commonly used ratios probably include loans to deposits, liquid assets to total assets and loan losses to total loans. Jahankhani and Lynge (1980) also summarised other accounting measures of risk and two market-based measures of risk, namely systematic risk (beta) and total risk (standard deviation of return). In addition, variance of roa, variance of roe, and Z-score have been used alternatively (for example, Altunbas et al., 2007; Lee & Hsieh, 2013). Especially, Z-score has been employed widely to reflect a bank’s probability of insolvency, with different approaches to constructing Z-score being appropriate in a given context and data (Lepetit & Strobel, 2013).
Theoretically, the regulatory hypothesis refers to a positive relationship between capital and risk, meaning bank regulators increase their capital commensurably with the amount of risk taken. However, Ghosh (2014) and Shrieves and Dahl (1992), among others, argued that the positive relationship between risk and capital was not strictly the consequence of capital regulation but risk-based incentives, meaning that banks hold regulatory capital in excess of minimum requirement to offset an increase in asset risk. The above hypothesis and risk-based capital standards have been supported by a variety of other empirical studies such as Altunbas et al. (2007), Iannotta et al. (2007), Pettway (1976) and Rime (2001) with their main findings summarised in Table 1. They are also in line with the capital buffer theory that more capital tends to absorb adverse shocks and thus reduces the likelihood of failure, which is what Jokipii and Milne (2011) proposed for the U.S. bank holding companies and commercial banks (1986-2006) that well-capitalised banks set positive risk and capital buffer adjustments and low buffer banks experienced the reversed changes.
SDR OA Book valu e equity/T ot al asse ts Gr oss loa ns/T ot al asse ts Loan loss reser ves/Gr oss loans Liquid asse ts/T ot al asse ts The coe ffi cien t of varia tion of cus tomer and sho rt-t erm funds es tima ted in a thr ee-year mo ving windo w of annual ob ser va tions Table 1 . Con tinu ed Studies Sample Specific ation Measur emen t of risk Main findings Ghosh (2014) GCC bank s 3SLS Log (1+Z -sc or e) Bank s incr eased capit al in response (1996-2011) to an incr ease in risk, but not vice ver sa Jahankhani and U.S. commer cial OLS Book value equity/T ot al asse ts Neg ativ e rela tionship be tw een Lyng e (1980) bank s and bank Liquid asse ts/T ot al asse ts equity -to-t ot al asse ts and risk, only holding companies The coe fficien t of varia tion of signific an t f or tot al risk (1972-1976) cus tomer and short -term funds es tima ted in a thr ee-year mo ving windo w of annual ob ser va tions Kar els et al. (1989) U.S. bank s Corr ela tion Tot al risk Mix ed corr ela tions be tw een risk and (1977-1984) coe fficien ts Sy st ema tic risk capit al Uns ys tema tic risk Agusman, Monr oe, Asian bank s Neg ativ e but not signific an t Gasbarr o, and (1998-2003) rela tionship be tw een capit al and Zum w alt (2008) risk, ex cep t f or se ven lis ted Indonesian bank s Lee and Hsieh Asian bank s GMM Mix ed eff ects of capit al on risk (2013) (1994-2008) depending on bank type and coun tr y inc ome le vel Z-scor e = + RO AC AP SDRO A
OLS Fixed
An opposite strand of literature points out the negative effect of capital on risk, meaning banks with lower capital level are likely to adopt more risk, which Berger et al. (1995) called agency and asymmetric information problems. The latter point favours the moral hazard hypothesis that shareholders are inclined to substituting riskier assets for safer creditors taking advantage of deposit schemes, and the managers will have less moral hazard incentives with higher level of capital (Jeitschko & Jeung, 2005). Some studies came up with another explanation that a higher capital adequacy ratio would provide a greater buffer against default and risk (Peura & Keppo, 2006), or higher capital levels are more capable of absorbing the losses accumulated from non-performing loans while banks with higher levels of risk need larger amounts of capital to compensate the losses which leads to lower levels of capital (Tan & Floros, 2013).
Specifically, the literature on this topic is very scant for Vietnam. While the afore-mentioned literature offers contradictory results about capital’s effect on bank risk, depending on risk measures, specifications, levels of income, types of bank, etc., this paper is necessary to fill the gap by examining the impact of capital on the risk of the Vietnamese banking system.
3. Methodology and Data Sources
In order to analyse the relationship between capital and risk in the Vietnamese banking system, this study applies the two-step system GMM dynamic panel data approach. This approach was outlined by Arellano and Bover (1995) and fully developed by Blundell and Bond (1998) with the capability of addressing potential endogeneity, heteroskedasticity, and autocorrelation problems. Regarding the ‘difference GMM’ technique proposed by Arellano and Bond (1991), it can eliminate the time-invariant firm-specific effect and control the potential endogenous explanatory variables by using instrumental variables which are lags of their original level. However, the lagged levels of the regressors are sometimes poor instruments for the first-differenced regressors. Hence, the augmented version – or system GMM should be exploited. The system GMM estimator uses the level equation to obtain a system of two equations: one differenced and one in levels, so this mechanism allows more instruments to be obtained. In this case, the variables in levels are instrumented with their own first differences whereby estimators’ efficiency increases. Although two-step estimators are asymptotically more efficient, the default reported standard errors tend to be severely downward biased. To get consistent and unbiased two-step estimators, we employ Windmeijer’s (2005) finite-sample correction to report standard errors.
To examine how risk is sensitive to capital regulations in the Vietnamese banking industry, this paper employs a panel dataset for 43 banks over the period of 1999-2014. The model is established based on previous studies, nearest to the work of Lee and Hsieh (2013) for Asian banks. The equation estimated is as follows.
RISKit=β0+β1RISKit-1+β2CAPit+β3Xit+μi+νit (1) where i and t denote bank and time period respectively, μi is an unobserved bank-specific effect, and νit is the idiosyncratic error term. CAPit is bank capital level measured by the equity to total asset ratio. It is exposed based on the regulatory and moral hazard hypotheses that a change in capital affects bank’s risk. Therefore, the ratio of capital to total assets should be treated as an endogenous variable.
RISKit is risk of bank i in year t which is proxied by two alternative measures of Z-score, called Z1 and Z2. The adoption of Z-score as risk measures to reflect bank’s probability of insolvency has been widespread recently in literature such as Beck, De Jonghe and Schepens (2012), Berger, Goulding and Rice (2014), Bertay, Demirgüç-Kunt and Huizinga (2013), Delis, Hasan and Tsionas (2014), Deyoung and Torna (2013), Fu, Lin and Molyneux (2014) and Hakenes, Hasan, Molyneux and Xie (2015). In addition to variance of roa, roe, non-performing loans, and loan loss reserves served as traditional risk measures for both individual banks and the overall banking industry (for instance, see Lee & Hsieh, 2013; Lepetit, Nys, Rous, & Tarazi, 2008; etc.), time-varying Z-score is considered popular because of simplicity and the fact that it can be calculated using accounting information which is extremely useful for unlisted financial institutions (Lepetit & Strobel, 2013). Bank insolvency commonly refers to the state where (car +
roa) ≤ 0 with car being the bank’s capital-asset ratio. According to Boyd, Graham and Hewitt (1993), if roa is a random variable with finite mean μroa and variance σ2roa, the Bienaymé–Chebyshev inequality allows us to state an upper bound of the probability of insolvency as:
p(roa ≤ -car) ≤ Z—2 (2)
where (3)
So we could refer to the measure Z—2 as the traditional insolvency probability bound. However, there are various approaches to calculate Z-score (for summary, see Lepetit & Strobel, 2013). In this paper, we eliminate moving average-based approaches of Z-score due to the observation losses. Instead we exploit two approaches of time-varying Z-score, one proposed by Cihák and Hesse (2007) and another which seems hardly used in literature until Lepetit and Strobel (2013). The former, Z1, uses standard
deviation estimates σroa calculated over the full sample and combine these with current period t values of cart and roat. The latter, Z2, uses mean and standard deviation estimates, μroa and σroa, calculated over the whole sample and combine these with current period t value of cart. The formulas of Z1 and Z2 are:
(4)
Z≡car+µroa > σroa 0
Z t car roat t
roa
1 = + >0
(5)
with higher value of Z-score indicating lower risk for the bank. These two measure-ments are all consistent with the probabilistic interpretation of Z-score referred above and using them alternatively allows robustness check.
Xit refers to a set of explanatory variables including both internal (bank-specific characteristics) and macro control variables. The first set consists of total assets (LAS)
and total deposits in natural logarithm forms (LDEPO), the ratio of non-interest income to total revenues (NII_TR), the ratio of non-interest expenses to average assets (NIE_ AA), loan loss reserves to total loans (LLR_TL), and liquid assets to deposits and
short-term funding (LAD).
Total asset (LAS) is included to examine the sensitivity of bank risk corresponding to its size while total deposit (LDEPO) enters the model to proxy network embeddedness. According to Lim and Randhawa (2005), bigger banks with a wider network of branches had more exposure to larger depositors, which made them a cheaper source of funds and hence achieved higher efficiency level. In this case, a huge amount of deposits probably predicts lower risk. However, the opposite ending is not impossible, especially with the well-known collapse of the two giants in financial markets including American International Group and Lehman Brothers Holdings recently.
NII_TR represents off-balance sheet business activities and fees specifically, or non-traditional operations in the bank with ambiguous relationships with risk. Demsetz and Strahan (1997) showed evidence that better diversification did not translate into reductions in risk. In contrast, Lee, Yang and Chang (2014) suggested that the effects of non-interest income on bank risk are very mixed, greatly depending on bank specification and the income level of that country. Therefore, it is also necessary to consider how bank risk changes to different ways of expenses management (NIE_AA),
which involves staff expenses and operation costs rather than others such as taxes and depreciation, and macroeconomic conditions in the country.
The ratio of loan loss reserves to total loans (LLR_TL) is expected to positively relate to bank risk. In case of unpredictable level of portfolio risk, it is loan loss reserves that reflect management’s estimate of exposure to credit risk. Given other things constant, a higher loss provision indicates a higher degree of expected loss in the loan portfolio (Mansur, Zangeneh, & Zitz, 1993).
LAD is included to indicate liquidity rate and expected to be negatively related to risk as keeping more liquid assets is considered a safe against insolvency. Nevertheless, Lee and Hsieh (2013) found mixed patterns regarding the relationship.
The second set of variables represents external effects including inflation (INF),
logarithm of GDP (LGDP), and concentration level in the banking industry (CR3) which is measured via the ratio of three largest banks in terms of total assets to the total assets of the Vietnamese banking industry. The coefficient signs of inflation and GDP are hard to predict. The first may rely on counter-cyclical or pro-cyclical behaviour of the bank although a higher GDP probably goes with less risk for the bank. Similarly, during high-inflation periods, banks may charge customers more and may suffer from bad loans at the same time.
Z t cart roa
roa
2 = +µ >0
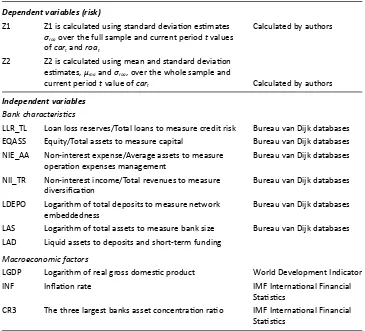
This study uses an unbalanced panel dataset of 43 commercial banks in the Vietnamese banking industry from 1999 to 2014, including both domestic and foreign-owned banks. All the bank data available from Bureau van Dijk databases are selected, leaving us 43 commercial banks which account for above 90 percent of the banking system’s assets in Vietnam. This paper focuses on the period of 1999-2014 when the crucial banking reforms were implemented, especially the regulations following Basel I standards to manage risk in commercial banks. Table 2 lists two proxies of bank risk as the dependent variables and the regressors as measures of bank-specific characteristics as well as external factors. It also points out the sources of the data.
All in all, the application of system GMM specification in this paper fits: (1) the linear functional relationship; and (2) the expectations that banking risk is influenced by a wide range of past and current behaviours in the economic and industrial markets as well as financial regulations. Importantly, in addition to resolving the possible Table 2. Description of the variables
Variable Description Database
Dependent variables (risk)
Z1 Z1 is calculated using standard deviation estimates Calculated by authors
σroa over the full sample and current period t values
of cart and roat
Z2 Z2 is calculated using mean and standard deviation
estimates, μroa and σroa, over the whole sample and
current period t value of cart Calculated by authors
Independent variables Bank characteristics
LLR_TL Loan loss reserves/Total loans to measure credit risk Bureau van Dijk databases
EQASS Equity/Total assets to measure capital Bureau van Dijk databases
NIE_AA Non-interest expense/Average assets to measure Bureau van Dijk databases
operation expenses management
NII_TR Non-interest income/Total revenues to measure Bureau van Dijk databases
diversification
LDEPO Logarithm of total deposits to measure network Bureau van Dijk databases
embeddedness
LAS Logarithm of total assets to measure bank size Bureau van Dijk databases
LAD Liquid assets to deposits and short-term funding
Macroeconomic factors
LGDP Logarithm of real gross domestic product World Development Indicator
INF Inflation rate IMF International Financial
Statistics
CR3 The three largest banks asset concentration ratio IMF International Financial
simultaneity between the degree of capital and risk, GMM model is able to take into consideration the causal effect of exogenous components.
4. Empirical Results and Discussion 4.1 Descriptive Statistics
Table 3 presents the summary statistics of the variables for the sample of 43 banks between 1999 and 2014. Z1 has the minimum value of 2.476 with MHB Bank, the maximum value of 76.644 with MB Bank in this period while Z2 varies from 2.920 (MHB Bank) to 75.636 (MB Bank). EQASS (Equity/Total assets ratio) reaches the highest value of 67.833 percent (HONGLEONG Bank) and has the lowest value of 1.076 percent (AGRI Bank). LAS (Logarithm of total assets) ranges between 5.748 and 13.385, with its mean
of 10.211. LDEPO (Logarithm of total deposits) reaches its maximum value of 12.996, drops to its minimum level at 5.030, and takes the average amount of 9.635. NII_TR
(Non-interest income/Total revenues) fluctuates from -12.01 percent to 83.34 percent, with its mean of 21.968 percent. NIE_AA (Non-interest expense/Average assets) reaches its highest value at 7.7 percent and its lowest value at about 0.75 percent, with its mean of 1.994 percent during the last 16 years. The mean of LLR_TL (Loan loss reserves/ Total loans) is 1.519 percent (higher than 1 percent) which signs the limitations in the risk management of the Vietnamese banking system. The fact is that banks went about increasing reserves as they face more bad due loans during the period. LAD (Liquid assets to deposits and short-term funding) ranges between 6.905 percent and 165.432
Table 3. Summary statistics of the variables
Variable Observation Mean Std. Dev. Min Max
Risk
Z1 380 26.404 16.387 2.476 76.644
Z2 380 26.402 16.182 2.920 75.636
Capital
EQASS 380 14.210 12.363 1.076 67.833
Bank specific characteristics
LAS 380 10.211 1.657 5.748 13.385
LDEPO 378 9.635 1.792 5.030 12.996
NII_TR 375 21.968 17.007 -12.010 83.340
NIE_AA 343 1.994 1.064 0.750 7.700
LLR_TL 356 1.519 1.318 0.101 7.192
LAD 378 38.647 24.783 6.905 165.432
Macroeconomic variables
LGDP 380 14.522 0.239 13.879 14.807
INF 380 9.154 5.928 -1.710 23.116
percent, with its mean of 38.647 percent. For LGDP (Logarithm of real gross domestic product), the mean value is 14.522, the lowest value is 13.879, and the highest value is 14.807. INF (Inflation rate) has mean value of 9.154 percent, fluctuates rather widely with standard deviation of 5.928 percent. CR3 (The three largest banks asset concentration ratio) varies from 36.693 percent to 99.998 percent, with its mean of 60.532 percent.
4.2. Correlations of the Variables
Table 4 presents the correlation matrix of the variables whereby EQASS (capital ratio) is significantly correlated with risk variables (Z1, Z2), predicting that capital ratio has a crucial effect on bank risk. For independent variables, there is extremely strong multicollinearity between LAS (bank size) and LDEPO (network embeddedness) with the correlation coefficients approximately 98.4 percent and quite strong correlation between the other variables. However, multicollinearity problem could be safely ignored with the regression specification employed being GMM in this study.
4.3. Regression Analysis
This section shows the two-step GMM dynamic system panel estimators on how capital and other determinants affect bank risk, where capital is treated as an endogenous variable. Our testable hypotheses are based on the moral hazard and regulatory hypotheses. In order to examine the instruments’ validity and the two hypotheses, we basically perform two tests, notably: the Sargan test (or Hansen test) which examines the over-identification restrictions and the Arellano and Bond test for autocorrelation. Both Sargan test (or Hansen test) and Arellano and Bond test are required for the validity of the GMM estimators.
It is important to emphasise the outperformance of two-step GMM estimators in this study compared to OLS, within groups (fixed effect), difference GMM and one-step GMM. According to econometric theory, OLS should yield an overestimate of the coefficient, while within-group should yield an underestimate (Bond et al., 2001). In addition, two-step GMM results in more asymptotic efficient estimates than one-step GMM, and the bias in the two-step standard errors is corrected by Windmeijer’s (2005) correction procedure. For these reasons, two-step GMM is employed. However, to save space, the comparison of coefficients in different specifications is present in Appendix Tables A1 and A2.
Table 4 . Corr ela tion ma trix of the variables Z1 Z2 EQASS LAS LDEPO NII_TR NIE_AA LLR_TL LAD LGDP INF CR3 Z1 1 Z2 0.9984 *** 1 EQASS 0.3437 *** 0.3374 *** 1 LAS -0.2930 *** -0.2860 *** -0.6474 *** 1 LDEPO -0.2953 *** -0.2883 *** -0.6804 *** 0.9835 *** 1 NII_TR 0.0475 0.0429 -0.0563 -0.0512 0.0292 1 NIE_AA -0.0164 -0.0156 0.4197 *** -0.2329 *** -0.1743 *** 0.1458 *** 1 LLR_TL -0.2715 *** -0.2647 *** -0.0000 0.2050 *** 0.2915 *** 0.0698 0.2195 *** 1 LAD 0.1548 *** 0.1465 *** 0.5254 *** -0.4978 *** -0.5313 *** 0.0973 * 0.0076 -0.0782 1 LGDP -0.0314 -0.0179 -0.0589 0.4666 *** 0.4474 *** -0.0446 0.2653 *** 0.0608 -0.4078 *** 1 INF 0.0293 0.0184 -0.0472 0.1569 *** 0.1066 ** 0.0023 0.0010 -0.0777 -0.0291 0.2277 *** 1 CR3 -0.0626 -0.0409 0.0500 -0.0463 0.0141 -0.0518 0.1328 ** 0.1534 *** -0.0837 0.0638 -0.6337 *** 1 Not e : ***, **, * denot
Table 5. Summary of risk models
All banks Domestic banks
Dependent variable Z1 Z2 Z1 Z2
(1) (2) (3) (4)
L.Z1 0.616*** 0.456*
(0.124) (0.267)
L.Z2 0.606*** 0.545***
(0.121) (0.159)
EQASS 0.745* 0.700** 1.420** 1.239**
(0.438) (0.296) (0.586) (0.489)
LAS -8.200** -7.256* -1.902 -9.647**
(3.211) (4.247) (4.826) (3.742)
LDEPO 9.288** 8.655** 5.275 11.315***
(3.569) (4.149) (8.254) (2.198)
NII_TR -0.004 0.013 -0.077 0.013
(0.037) (0.023) (0.412) (0.059)
NIE_AA -1.657 -1.368 -3.391 -2.645**
(1.313) (0.935) (2.664) (1.134)
LLR_TL -0.254 -0.466 -1.089 0.208
(0.579) (0.596) n.a. (1.327)
LAD -0.026 -0.015 -0.185 0.024
(0.036) (0.075) (0.371) (0.123)
LGDP 1.083 -0.224 94.840 0.750
(2.341) (1.724) (113.8) (6.081)
INF 0.100 0.232 -42.07 -0.088
(0.212) (0.177) (48.37) (0.234)
CR3 -0.462 -0.142 -11.46 -0.528
(0.600) (0.626) (13.22) (1.590)
Time control YES YES YES YES
Number of observations 315 315 254 254
Number of banks 43 43 34 34
Number of instruments 43 40 34 34
F test (p-value) 0.000 0.000 0.008 0.047
AR1 (p-value) 0.005 0.006 0.408 0.666
AR2 (p-value) 0.323 0.938 0.760 0.810
Sargan test (p-value) 0.361 0.492 0.104 0.104
Hansen test (p-value) 0.700 0.754 0.671 0.933
Hansen-in-Difference (p-value) 0.865 0.966
of instruments. The same results are concluded based on Hansen test and
Hansen-in-Difference test statistics.
In all risk models, the significantly positive relationship between capital and Z-score
(Z1, Z2) is found for all banks sample and domestic banks sample, implying that an increase in capital level goes with decreasing risk taken by the bank. These findings are consistent with other studies such as Agusman et al. (2008), Jacques and Nigro (1997), Jahankhani and Lynge (1980), Karels et al. (1989), Lee and Hsieh (2013), among others. On one hand, this result favours the moral hazard hypothesis, meaning that banks, especially the smaller ones, have high incentives to exploit deposit insurance schemes. Note that the deposit insurance schemes are not only to protect small depositors but also to protect the small banks against the larger ones for deposits due to the concern of potential fragility of small banks (Asli Demirgüç-Kunt & Kane, 2002). This concern is especially true in cases of Vietnamese domestic banks facing huge competition of new big foreign arrivals in the domestic financial market. Apart from the explicit insurance scheme, more importantly, this behaviour could be explained following the protection policy implicitly committed by the Vietnamese government. It is not surprising to observe the dramatic increases of bad loans ratio in the Vietnamese banking sector, especially in the 2010s, which is believed to have accumulated for a long period. Many of the bad loans of Vietnamese commercial banks have been rebought by the Vietnam Asset Management Company (VAMC), a state company which focusses on handling bad loans and reducing risk for credit institutions and enterprises. Therefore, it is the least efficient banks who are more inclined to take excessive risk. On the other hand, following Decree No. 141/2006/ND-CP dated 22/11/2006, the Vietnamese domestic commercial banks were forced to increase their charter capital to the minimum level of VND3,000 billion in order to ensure the system safety and payment security. However, not all domestic banks have been successful in achieving the required capital ratio at the end of the studied period. Nonetheless, the direct beneficiaries that can be seen in the specific circumstance are that the domestic banks having higher capital level are more likely to avoid default and risk and enhance their competitive position against foreign banks who potentially dominate the Vietnamese banking market in the near future. A higher capital ratio would probably provide a greater buffer against risk which results from non-performing loans and inefficient non-traditional activities. For riskier banks, the increase in capital ratio acts as a compensation for the losses, which results in lower capital ratio.
The effect of bank size (LAS) on Z-score is significantly negative in most of the cases except for domestic banks using Z1, indicating that larger banks are generally associated with higher risk. The impact of network embeddedness (LDEPO) on risk, in contrast, is positive and significant for all banks (both Z1 and Z2) and domestic banks (Z2 only), meaning that the banks should expand their branch network to achieve stable deposit resources and reduce liquidity risk. The relationship between operation cost
criteria to ensure the financial system safety. The impact of liquidity ratio (LAD), income
diversification (NII_TR), and credit risk (LLR_TL) on bank risk are mixed and insignificant. Regarding macroeconomic variables, the effects of real gross domestic product
(LGDP) and inflation (INF) are also mixed and insignificant. The estimated coefficients of the market concentration ratio (CR3) are also insignificant in all models.
Although the above results still satisfy the suggested rule of thumb as keeping number of instruments less than or equal to number of groups, we also consider a stricter case for all bank sample in which number of instruments is less than number of groups by using pca option. Overall, our results are robust since there are no significant differences in terms of the estimated signs and magnitude of the coefficients compared to the main results above, except the INF variable becomes significantly positive [see Appendix Table A3].
5. Conclusion
This paper applies the two-step system GMM technique to examine the relationship between bank capital and risk, using the latest and a wider range of panel data for 43 commercial banks in the Vietnamese banking sector from 1999 to 2014. We look into this relationship deeply by including two alternative proxies for risk (Z-score) which then reveal similar findings. This paper serves as one of the pioneering studies for Vietnamese banking industry specifically. The research on risk-capital nexus is also extremely necessary for this banking system, which faces continuing restructuring programs in which raising capital adequacy has been drawing much attention. The empirical results also reveal the persistence of risk variables from one year to the next, indicating that risk in the previous period will become greater in the next period. More importantly, the effects of bank capital on risk are shown to be significant and negative for the whole sample and domestic banks, supporting the moral hazard hypothesis. Based on this, there are some important policy implications. Increasing minimum capital requirements can decrease a bank’s risk; however, it is not sufficient to ensure the whole financial system safety. Therefore, the Vietnamese banking regulators should focus on improving the efficiency of operations management in addition to promoting the applications of Basel II and Basel III standards.
References
Agusman, A., Monroe, G.S., Gasbarro, D., & Zumwalt, J.K. (2008). Accounting and capital market
measures of risk: Evidence from Asian banks during 1998–2003. Journal of Banking &
Finance, 32(4), 480-488. https://doi.org/10.1016/j.jbankfin.2006.06.018
Altunbas, Y., Carbo, S., Gardener, E.P.M., & Molyneux, P. (2007). Examining the relationships
between capital, risk and efficiency in European banking. European Financial Management,
13(1), 49-70. https://doi.org/10.1111/j.1468-036X.2006.00285.x
Arellano, M., & Bond, S. (1991). Some tests of specification for panel data ¬ Monte Carlo evidence
and an application to employment equations. Review of Economic Studies, 58(2), 277-297.
https://doi.org/10.2307/2297968
Arellano, M., & Bover, O. (1995). Another look at the instrumental variable estimation of
error-components models. Journal of Econometrics, 68(1), 29-51.
Asli Demirgüç-Kunt, A., & Kane, E.J. (2002). Deposit insurance around the globe: Where does
it work? Journal of Economic Perspectives, 16(2), 175-195. https://doi.org/10.1257/
0895330027319
Barth, J.R., Caprio, G., & Levine, R. (2008). Bank regulations are changing: For better or worse?
Comparative Economic Studies, 50(4), 537-563. https://doi.org/10.1057/ces.2008.33
Beck, T., De Jonghe, O., & Schepens, G. (2012). Bank competition and stability: Cross-country
heterogeneity. Journal of Financial Intermediation, 22(2). https://doi.org/10.1016/j.jfi.2012. 07.001
Berger, A.N., Goulding, W., & Rice, T. (2014). Do small businesses still prefer community banks?
Journal of Banking & Finance, 44(July), 264-278. https://doi.org/10.1016/j.jbankfin.2014.
03.016
Berger, A.N., Herring, R.J., & Szegö, G.P. (1995). The role of capital in financial institutions. Journal
of Banking & Finance, 19(3-4), 393-430. https://doi.org/10.1016/0378-4266(95)00002-X
Bertay, A.C., Demirgüç-Kunt, A., & Huizinga, H. (2013). Do we need big banks? Evidence on
performance, strategy and market discipline. Journal of Financial Intermediation, 22(4),
532-558. https://doi.org/10.1016/j.jfi.2013.02.002
Blundell, R., & Bond, S. (1998). Initial conditions and moment restrictions in dynamic panel data
models. Journal of Econometrics, 87(1), 115-143. https://doi.org/10.1016/S0304-4076(98) 00009-8
Blundell, R., & Bond, S. (2000). GMM estimation with persistent panel data: An application
to production functions. Econometric Reviews, 19(3), 321-340. https://doi.org/10.1080/
07474930008800475
Bond, S., Hoeffler, A., & Temple, J. (2001). GMM estimation of empirical growth models (Economic
Papers 2000-W21). St. Louis: Federal Reserve Bank of St Louis.
Boyd, J.H., Graham, S.L., & Hewitt, R.S. (1993). Bank holding company mergers with nonbank
financial firms: Effects on the risk of failure. Journal of Banking & Finance, 17(1), 43-63.
https://doi.org/10.1016/0378-4266(93)90079-S
Bureau van Dijk databases. (2017). Orbis Bank Focus. Retrieved from: https://www.bvdinfo.com/
en-apac/our-products/company-information/international-products/orbis-banks
Cihák, M.M., & Hesse, H. (2007). Cooperative banks and financial stability (IMF Working Paper,
No. WP/07/2). Washington, DC: International Monetary Fund.
Delis, M.D., Hasan, I., & Tsionas, E.G. (2014). The risk of financial intermediaries. Journal of
Banking & Finance, 44(July), 1-12. https://doi.org/10.1016/j.jbankfin.2014.03.024
Demsetz, R.S., & Strahan, P.E. (1997). Diversification, size, and risk at bank holding companies.
Journal of Money, Credit and Banking, 29(3), 300-313. https://doi.org/10.2307/2953695
Deyoung, R., & Torna, G. (2013). Nontraditional banking activities and bank failures during the
financial crisis. Journal of Financial Intermediation, 22(3), 397-421. https://doi.org/10.1016/j.
jfi.2013.01.001
Fu, X., Lin, Y., & Molyneux, P. (2014). Bank competition and financial stability in Asia Pacific.
Journal of Banking & Finance, 38(January), 64-77. https://doi.org/10.1016/j.jbankfin.2013.
09.012
Ghosh, S. (2014). Risk, capital and financial crisis: Evidence for GCC banks. Borsa Istanbul Review,
14(3), 145-157. https://doi.org/10.1016/j.bir.2014.06.003
Hakenes, H., Hasan, I., Molyneux, P., & Xie, R. (2015). Small banks and local economic develop
-ment. Review of Finance, 19(2), 653-683. https://doi.org/10.1093/rof/rfu003
Iannotta, G., Nocera, G., & Sironi, A. (2007). Ownership structure, risk and performance in the
European banking industry. Journal of Banking & Finance, 31(7), 2127-2149. https://doi.
org/10.1016/j.jbankfin.2006.07.013
International Monetary Fund (IMF) (n.d.). International Financial Statistics (IFS), 2017. Retrieved
Jacques, K., & Nigro, P. (1997). Risk-based capital, portfolio risk, and bank capital: A simultaneous
equations approach. Journal of Economics and Business, 49(6), 533-547. https://doi.org/
10.1016/S0148-6195(97)00038-6
Jahankhani, A., & Lynge, M.J. (1980). Commercial bank financial policies and their impact on
market-determined measures of risk. Journal of Bank Research 11(3), 169-178.
Jeitschko, T.D., & Jeung, S.D. (2005). Incentives for risk-taking in banking – A unified approach.
Journal of Banking & Finance, 29(3), 759-777. https://doi.org/10.1016/j.jbankfin.2004.05.028
Jokipii, T., & Milne, A. (2011). Bank capital buffer and risk adjustment decisions. Journal of
Financial Stability, 7(3), 165-178. https://doi.org/10.1016/j.jfs.2010.02.002
Karels, G.V., Prakash, A.J., & Roussakis, E. (1989). The relationship between bank capital adequacy
and market measures of risk. Journal of Business Finance & Accounting, 16(5), 663-680.
https://doi.org/10.1111/j.1468-5957.1989.tb00045.x
Koehn, M., & Santomero, A.M. (1980). Regulation of bank capital and portfolio risk. The Journal of
Finance, 35(5), 1235-1244. https://doi.org/10.1111/j.1540-6261.1980.tb02206.x
Lee, C.-C., & Hsieh, M.-F. (2013). The impact of bank capital on profitability and risk in Asian
banking. Journal of International Money and Finance, 32(February), 251-281. https://doi.
org/10.1016/j.jimonfin.2012.04.013
Lee, C.-C., Yang, S.-J., & Chang, C.-H. (2014). Non-interest income, profitability, and risk in banking
industry: A cross-country analysis. The North American Journal of Economics and Finance,
27(January), 48-67. https://doi.org/10.1016/j.najef.2013.11.002
Lepetit, L., Nys, E., Rous, P., & Tarazi, A. (2008). Bank income structure and risk: An empirical
analysis of European banks. Journal of Banking & Finance, 32(8), 1452-1467. https://doi.
org/10.1016/j.jbankfin.2007.12.002
Lepetit, L., & Strobel, F. (2013). Bank insolvency risk and time-varying Z-score measures. Journal
of International Financial Markets, Institutions and Money, 25(July), 73-87. https://doi.
org/10.1016/j.intfin.2013.01.004
Lim, G.H., & Randhawa, D.S. (2005). Competition, liberalization and efficiency: Evidence from a
two-stage banking model on banks in Hong Kong and Singapore. Managerial Finance, 31(1),
52-77. https://doi.org/10.1108/03074350510769479
Mansur, I., Zangeneh, H., & Zitz, M.S. (1993). The association between banks’ performance ratios
and market-determined measures of risk. Applied Economics, 25(12), 1503-1510. https://doi.
org/10.1080/00036849300000154
Pettway, R.H. (1976). Market tests of capital adequacy of large commercial banks. The Journal of
Finance, 31(3), 865-875. https://doi.org/10.1111/j.1540-6261.1976.tb01929.x
Peura, S., & Keppo, J. (2006). Optimal bank capital with costly recapitalization. The Journal of
Business, 79(4), 2163-2201. https://doi.org/10.1086/503660
Rime, B. (2001). Capital requirements and bank behaviour: Empirical evidence for Switzerland.
Journal of Banking & Finance, 25(4), 789-805. https://doi.org/10.1016/S0378-4266(00)
00105-9
Shrieves, R.E., & Dahl, D. (1992). The relationship between risk and capital in commercial banks.
Journal of Banking & Finance, 16(2), 439-457. https://doi.org/10.1016/0378-4266(92)90024-T
Tan, Y., & Floros, C. (2013). Risk, capital and efficiency in Chinese banking. Journal of International
Financial Markets, Institutions & Money, 26(October), 378-393. https://doi.org/10.1016/j.
intfin.2013.07.009
Windmeijer, F. (2005). A finite sample correction for the variance of linear efficient two-step
GMM estimators. Journal of Econometrics, 126(1), 25-51. https://doi.org/10.1016/j.jeconom.
2004.02.005
Appendix
Table A1. OLS, Fixed effect, Difference GMM, One-step system GMM and Two-step system GMM
Dependent variable: Z1
Estimation Method OLS Within group Difference One-step Two-step
(Fixed effect) GMM system GMM system GMM
L.Z1 0.782*** 0.142** 0.275** 0.590*** 0.616***
(0.057) (0.058) (0.104) (0.104) (0.124)
EQASS 0.356** 1.066*** 0.617* 0.814** 0.745*
(0.152) (0.167) (0.336) (0.319) (0.438)
LAS -7.554*** -1.452 -6.935 -8.199*** -8.200**
(2.192) (2.888) (4.723) (2.915) (3.211)
LDEPO 7.970*** -0.319 -0.033 9.668*** 9.288**
(2.091) (2.094) (1.918) (3.080) (3.569)
NII_TR -0.012 0.012 0.023 0.026 -0.004
(0.024) (0.029) (0.034) (0.042) (0.037)
NIE_AA -0.592 -1.400** -0.861* -1.989* -1.657
(0.475) (0.601) (0.485) (1.170) (1.313)
LLR_TL 0.010 -0.917** -0.197 -0.652 -0.254
(0.271) (0.417) (0.572) (0.439) (0.579)
LAD -0.006 -0.016 0.006 -0.020 -0.026
(0.023) (0.022) (0.030) (0.028) (0.036)
LGDP 0.848 1.649 -0.498 1.083
(5.196) (5.863) (0.761) (2.341)
INF 0.182 0.315* 0.040 0.253** 0.010
(0.217) (0.162) (0.116) (0.110) (0.212)
CR3 -0.045 -0.007 0.065 -0.021 -0.462
(0.033) (0.015) (0.046) (0.022) (0.600)
Time control YES YES YES YES YES
Observations 315 315 264 315 315
R-squared 0.824 0.714
Number of banks 43 43 42 43 43
Number of instruments 35 43 43
AR1 (p-value) 0.036 0.001 0.005
AR2 (p-value) 0.508 0.889 0.323
Sargan test (p-value) 0.028 0.361 0.361
Hansen test (p-value) 0.028 0.700 0.700
Hansen-in-Difference (p-value) 0.214 0.865 0.865
Table A2. OLS, Fixed effect, Difference GMM, One-step system GMM and Two-step system GMM
Dependent variable: Z2
Estimation Method OLS Within group Difference One-step Two-step
(Fixed effect) GMM system GMM system GMM
L.Z2 0.793*** 0.154** 0.309** 0.634*** 0.606***
(0.056) (0.062) (0.118) (0.090) (0.121)
EQASS 0.337** 1.033*** 0.549* 0.780*** 0.700**
(0.148) (0.162) (0.324) (0.284) (0.296)
LAS -7.220*** -1.251 -7.315* -7.759*** -7.256*
(2.093) (2.806) (4.390) (2.710) (4.247)
LDEPO 7.568*** -0.322 0.122 9.213*** 8.655**
(2.000) (2.004) (1.806) (2.814) (4.149)
NII_TR -0.0168 0.011 0.017 0.015 0.013
(0.023) (0.027) (0.033) (0.040) (0.023)
NIE_AA -0.601 -1.380** -0.771 -1.891* -1.368
(0.472) (0.585) (0.508) (1.087) (0.935)
LLR_TL 0.055 -0.630 0.061 -0.472 -0.466
(0.256) (0.386) (0.514) (0.391) (0.596)
LAD -0.010 -0.016 0.003 -0.024 -0.015
(0.022) (0.020) (0.027) (0.027) (0.075)
LGDP -0.489 1.101 -0.658 -0.224
(4.986) (5.579) (0.743) (1.724)
INF 0.265 0.305** 0.068 0.294** 0.232
(0.202) (0.147) (0.117) (0.113) (0.177)
CR3 -0.039 -0.001 0.086* -0.005 -0.142
(0.030) (0.014) (0.046) (0.021) (0.626)
Time control YES YES YES YES YES
Observations 315 315 264 315 315
R-squared 0.833 0.715
Number of banks 43 43 42 43 43
Number of instruments 35 43 40
AR1 (p-value) 0.042 0.001 0.006
AR2 (p-value) 0.165 0.794 0.938
Sargan test (p-value) 0.033 0.516 0.492
Hansen test (p-value) 0.040 0.463 0.754
Hansen-in-Difference (p-value) 0.320 0.652 0.966
Table A3. Summary of risk models under pca option
Dependent variable Z1 Z2
Two-step One-step Two-step One-step
(1) (2) (3) (4)
L.Z3 0.586*** 0.613***
(0.171) (0.090)
L.Z5 0.557*** 0.605***
(0.148) (0.178)
EQASS 0.672* 0.807** 0.880** 0.741**
(0.381) (0.319) (0.421) (0.374)
LAS -5.617* -8.032*** -7.314** -7.861**
(3.126) (2.664) (2.824) (3.354)
LDEPO 7.147** 9.569*** 9.129** 9.058**
(3.527) (2.954) (3.479) (3.663)
NII_TR 0.000 0.024 0.005 0.020
(0.029) (0.039) (0.030) (0.043)
NIE_AA -1.103 -1.930* -1.658 -1.840
(1.029) (1.089) (1.306) (1.362)
LLR_TL -0.457 -0.600 -0.647 -0.496
(0.526) (0.407) (0.539) (0.627)
LAD 0.004 -0.019 -0.016 -0.020
(0.036) (0.028) (0.037) (0.030)
LGDP -0.721 -0.603 -1.373 -0.407
(0.935) (0.912) (1.448) (0.908)
INF 0.226* 0.257** 0.328** 0.284**
(0.123) (0.116) (0.165) (0.117)
CR3 -0.014 -0.021 0.158 -0.003
(0.030) (0.022) (0.251) (0.023)
Time control YES YES YES YES
Number of observations 315 315 315 315
Number of banks 43 43 43 43
Number of instruments 36 40 36 36
F-test (p-value) 0.000 0.000 0.000 0.000
AR1 (p-value) 0.015 0.002 0.010 0.005
AR2 (p-value) 0.678 0.851 0.910 0.781
Sargan test (p-value) 0.230 0.243 0.517 0.517
Hansen test (p-value) 0.329 0.218 0.353 0.353