Application of GIS and Remote Sensing Technique to Change Detection in
Land Use/Land Cover Mapping of Igbokoda, Ondo State, Nigeria
James R. Adewumi
1, James K. Akomolafe
2, Fidelis O. Ajibade
3and Blessing B. Fabeku
4 1,3Department of Civil and Environmental Engineering
,
Federal University of Technology, Akure, Nigeria.
2
Works and Physical Planning Unit, Ondo State University of Science and Technology,
Okitipupa, Ondo State, Nigeria
4
Meteorology Unit, Ondo State University of Science and Technology,
Okitipupa, Ondo State, Nigeria
.
1
Email: [email protected],
2Email: [email protected],
3Email: [email protected],
4Email: [email protected]
Abstract
This paper aims at establishing changes in land use and land cover in Igbokoda municipality using Geographic Information System and remote sensing techniques. Three satellite images for three different epochs 1986, 1999 and 2013 were used to produce a land use/land cover map classification for Igbokoda. In determining the extent of land use/land cover changes in the township from 1986 through 1999 to 2013, Landsat images of the town were downloaded from the United State Geological Survey online archive. The images were analyzed using change detection technique (NDVI differencing) along with SRTM 90m DEM of the study area to generate the extent of the changes that have occurred. Ground trotting was carried out to ascertain the accuracy of data and the major changes in the land use/land cover. Results show that vegetation has decreased from 75.04% in 1986 to 46.81% in 2013 which was due to increase in population and rapid urbanization. In 1996 the Built-up area covers 19.6321 km2 of the study area but has increased rapidly to 39.1505 km2 in the year 1999 with an average annual increment of 2.025Km2/year. By the year 2013, the built-up area has increased to 64.1520Km2. Also in the same vein, the bare surface area which was 13.28029km2 in 1986 was increased to 39.6053 and 50.240Km2 in 1999 and 2013 respectively. On the contrary, the vegetated area of Igbokoda reduced from 196.3046Km2 in 1999 to 122.4680Km2 in 2013. This study has demonstrated that remotely sensed data and GIS based approach is timely and cost effective than the conventional method of analysis, classification of land use pattern effective for planning and management. It further shows that If the rapid change in land use is not properly manage, the situation poses a serious threat to Igbokoda town by increasing surface runoff and susceptibility to flooding.
Keywords: GIS, Remote Sensing, Land Use/Land cover, Landsat TM imagery, NDVI
1. Introduction
grown in multiple folds over the years as an indispensable means of planning and implementation of developmental projects. Without considering the implications of planning for major developmental projects, there has been unprofessional use of agricultural land and open spaces in an unplanned situation. The data derived for land use/land cover gives insights to better understand land utilization aspects as well as play a vital role in the formulation of policies and programme implementation for development. It is important to note that, land is very important resource to man and it should be better managed for continuous existence and its progress depends on our ability to avoid its mismanagement [3]. Studies have shown that there remains only a few landscapes on Earth which are currently in their natural state. Due to anthropogenic activities, the Earth’ surface is being significantly altered and the presence of man and his use of land has had a profound effect upon the natural environment [4; 5]. As a result since the early 1980s vast transformations have occurred in the land use and land cover patterns as evidenced by persistent expansion in cultivated land, decrease in natural woodland and grassland in the world [6; 7; 8]. It can therefore be stated that the land use and land cover pattern of a region is an outcome of natural and socio-economic factors and their utilization by man in time and space.
Land-use suitability mapping and analysis is one of the most useful applications of Geographical Information System (GIS) for spatial planning and management [9; 10]. Such analysis is a multicriteria evaluation, which aims at identifying the most appropriate spatial pattern for future land uses according to specified requirements, preferences, or predictors of some activity [11; 9]. GIS serves the multicriteria evaluation function of suitability assessment well, providing the attribute values for each location and both the arithmetic and logical operators for combining attributes [12]. Remote sensing has long been an effective means for land cover mapping with its ability to quickly collect information on a large regional scale, and many land cover maps on global and regional scales have been produced in recent years using remote sensing data [13; 14].
Change detection is the technique, which is used for the assessment of resources, where multi-date images are compared to find out the type and amount of change that have occurred. The various applications of change detection are in agricultural, hydrological, forestry, environmental and ecological fields [15]. The important goal in change detection is to compare spatial representations of two points in time by controlling all variances caused by differences in variables of non-interest (i.e. variation in orbital and platform altitudes) and to measure change caused by differences in variables of interest. Currently, land use/land cover change detection relies primarily upon some types of techniques: map-to-map and image-to-image comparison. The goal of remote sensing change detection according to [16] is to:
a) detect the geographic location of change found when comparing two (or more) dates of imagery;
b) identify the type of change if possible (e.g., from forest to agriculture); and c) quantify the amount of change.
From the ecological perspective, land degradation is seen as damage to the healthy functioning of land-based ecosystems [17]. Soil degradation phenomena occurs via a complex interaction between natural (e.g. soil properties and climate conditions) and human factors (e.g. grazing, over-cultivation and deforestation) [18]. The main types of land degradation factors identified in the north Nile Delta include: salinity, compaction and water logging as well as water erosion which can be attributed to the Mediterranean Sea level rise [17].
Igbokoda area and its agricultural area have probably resulted very rapidly and have had a detrimental effect on the environment. Due to this, multi-temporal Landsat TM imagery for assessment land cover change is chosen as appropriate tool for this study. The study therefore is aimed at detecting the land use/land cover change in Igbokoda municipality using landsat TM imagery {Landsat 5 (TM), Landsat 7 (ETM+) and Landsat 8 (LC)}.
2.
Research Methodology
2.1. Descriptions of the Study Area
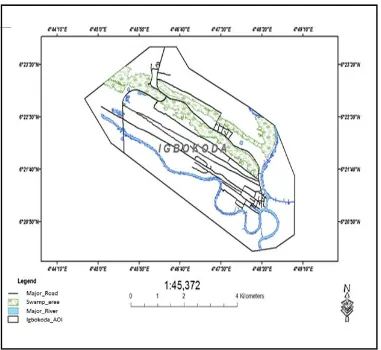
Igbokoda town extends from latitude 6’ 20’’ N to 6’24’’ N and longitude 4’45’’E to 4’48’’E. The town comprises of many quarters. It is about 24 km from the coast of Atlantic Ocean. The existing road network which links the town with the neighbouring towns such as Okitipupa, Aboto, Mayin, Igbo Nla, among others, further promotes the town accessibility to regional centers. History has it that the indigenes of Igbokoda are Ilajes who in the course of searching for dry land to promote their economic activities and make contact with the people of upland, settled in the present Igbokoda town.
Figure 2: Digitized Map of the Study Area showing the Road Network and other Features
2.2. Data Acquired, Sources and Software Packages
The steps involved in data collection are the downloading of Landsat satellite images, Ikonos Image and Aster SRTM DEM from USGS online data archives (www.glovis.usgs.gov); clipping of the area of interest, data processing, generation of the colour composite images and vegetation cover (VC) images, generation of Normalized Differential Vegetation Index (NDVI) map, generation of digital elevation model (DEM) and creation of cadastral map.
Other software packages used are:
a) ArcGIS 9.3 – This is used to create map boundary of the study area in this project, also the power option of IDW is used to interpolate the SPI results and its reclassification to obtain Drought Spatial Pattern maps. NDVI calculations and their images are also done here.
b) Erdas Imagine 9.1 – this is used for displaying and clipping area of interest from the downloaded imageries for it to be imported into Ilwis environment for further processing. c) Ilwis 3.5 – This is used to perform the bands staking in order to obtain the color composite
and image classification.
2.2.1. Satellite Data
These are sets of information about the features on the surface of the earth remotely acquired by the sensors onboard via the means of electromagnetic energy, stored in the form of digital picture (e.g. geotiff).
2.2.2. SRTM 90m DEM
The Shuttle Radar Topography Mission (SRTM) was launched on February 11, 2000 and was a joint project between U.S. National Geospatial Intelligence agency (NGA) and U.S. National Aeronautics and space Administration that obtained digital elevation data of the Earth’s surface on a near-global scale (almost 80% of the earth’s surface) between 56oS and 60oN [25]. Edited data became
available by year 2004 at a spatial resolution of one arc second for the United States (approximately 30m) and three arc second (90 m) for the rest of the world [25; 26]. The production of a near global SRTM data has enabled global assessments especially on extraction of drainage networks and upstream catchment areas in the flood risk zones [27].
SRTM 90 m DEM of the study area (Igbokoda) is derived from United State Geological Survey/National Aeronautics and Space Administration/Shuttle Radar Topography Mission (USGS/NASA SRTM) in which data already in decimal degrees and datum WGS84. The data is downloaded from the CIAT—CSI SRTM website (http://srtm.csi.giar.org). It is projected to the UTM coordinate system and clipped to the extent of the study area.
2.2.3. Landsat Data
The Landsat program originated in the United States in July 23, 1972, Landsat 1 was launched as the first Earth Observation Satellite with the objective of studying and monitoring landmasses on the Earth Surface. At the time of its launch, it was known as Earth Resources Technology Satellite ERTS [28], seven more Landsat satellites had been launched since then as Landsat 2, 3, 4, 5, 6, 7 and 8.
In this study, Landsat 5 (TM), Landsat 7 (ETM+) and Landsat 8 (LC) imageries are used. Landsat 5 was launched on 1st March, 1985. In addition to the multispectral scanner system that was
available in the first four Landsat satellites, Landsat 5 is developed with a unique feature, a sensor that has better spatial and spectral resolution that enable the satellite to capture image from a wider view [29]. This feature is the Thematic Mapper (TM). Landsat 7 was launched on 15th April, 1999 with an
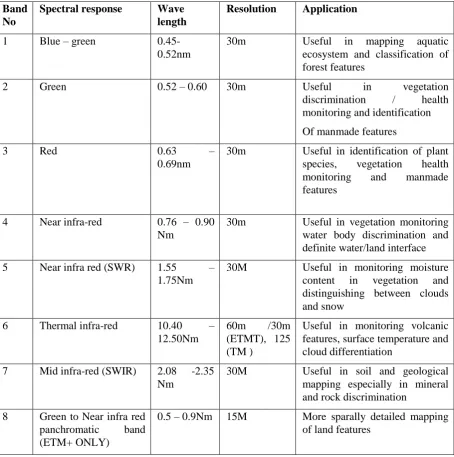
Table 1: Spectral bands of Landsat Satellites and their applications
Source:
[28; 29; 30; 31; 32]
Landsat images are generally known to be efficient, simple and first choice when it comes to mapping of flood vulnerable areas [33], three Landsat Images are downloaded from [34]. Table 2 shows a list of Landsat images acquired and their dates.
Band No
Spectral response Wave
length
Resolution Application
1 Blue – green 0.45-
0.52nm
30m Useful in mapping aquatic ecosystem and classification of forest features
2 Green 0.52 – 0.60 30m Useful in vegetation
discrimination / health monitoring and identification
Of manmade features
3 Red 0.63 –
0.69nm
30m Useful in identification of plant species, vegetation health monitoring and manmade features
4 Near infra-red 0.76 – 0.90 Nm
30m Useful in vegetation monitoring water body discrimination and definite water/land interface
5 Near infra red (SWR) 1.55 – 1.75Nm
30M Useful in monitoring moisture content in vegetation and distinguishing between clouds and snow
6 Thermal infra-red 10.40 –
12.50Nm
60m /30m (ETMT), 125 (TM )
Useful in monitoring volcanic features, surface temperature and cloud differentiation
7 Mid infra-red (SWIR) 2.08 -2.35 Nm
30M Useful in soil and geological mapping especially in mineral and rock discrimination
8 Green to Near infra red panchromatic band (ETM+ ONLY)
Table 2: Summary of Landsat Images Acquired
2.2.4. High Resolution Imagery----Ikonos Image
Geometrically rectified high resolution imagery (Ikonos image) of resolution of 0.8m covering the study area was obtained. Road networks and building across the town was digitized. Properties that will be affected were mapped out considering the buffering zone.
2.2.5. Vector Data
The study area boundary map used to clip out area of interest from the satellite imageries was curved out from the local government boundary map and Nigerian Administrative map on the scale of 1:15,140,906 which was obtained from National Space Research and Development Agency, Abuja (NASRDA).
2.2.6. Clipping of study area
Each composite of the satellite imageries used in this study were susbseted using Igbokoda boundary map gotten from NASRDA to delineate the spatial extent of the area of interest over each of the satellite scene. This was done using processed the vector data in Erdas Imagine 9.0 and later export to Iliwis 3.5 and ArcGIS 9.3 environment for further analysis.
2.2.7. Data Re-processing
The satellite imageries downloaded have already been corrected from the manufacturer radiometrically and geometrically to raster image (Geotiff). The images coordinate is in projection coordinate (WGS_84).
2.2.8. Panchromatic Sharpening
Pan- sharpening involves the fusion of the high resolution (1.5 m) panchromatic band/image with the lower resolution bands (30 m) of the same Landsat Image [35; 36; 37]. The three (3) Landsat composite images were pan- sharpened with their respective panchromatic images which enhanced their respective features for the purpose of image recognition while classifying the Images.
2.2.9. Generation of Composite image and Land Cover image
Colour composite involves stacking or combination of different bands (band 4, band 3, & band 2) together to produce a false colour composite image purposely for features recognition while classifying.
Land Cover (LC) image comprises of vegetation cover types which is a prime indicator of spatial impact extent and flood plain since their population and growth are greatly affected by human
S/N Landsat Satellite Date Pathrow
1. Landsat 5 (TM) 25 April, 1986 190/056
2. Landsat 7 (ETM+) 13 December, 1999 190/056
anthropogenic activities and prolong accumulation of flooding water. LC image for respective epoch was obtained after classifying the colour composite image using maximum likelihood method of image classification. The classification was done based on the selection of a set of pixels been assigned to each of the four classes created (Land cover categories) which are bare surface, built-up area, vegetation and water body.
Table 3: Land covers classification categories
S/N Classes Colour
1 Bare Surface Light Brown
2 Built-up Area Red
3 Vegetation Deep Green
4 Water Body Blue
The above (Table 3) Land Cover categories were arrived after a brief reconnaissance survey had been carried out to obtain information about the study area.
2.10. Generation of Greenness Index (NDVI) and Greenness Index image
NDVI calculation was performed to find out the changing pattern of the vegetation during the selected period of this study due to satellite data available (1986, 1999 and 2013). The following algorithm developed by [38] was used for the analysis.
𝑁𝐷𝑉𝐼 =
(𝑁𝐼𝑅−𝑅)(𝑁𝐼𝑅+𝑅) (1)Table 4: Greenness Index threshold values
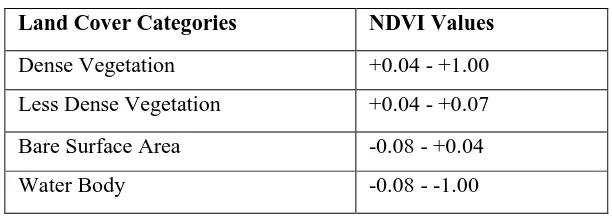
Land Cover Categories NDVI Values
Dense Vegetation +0.04 - +1.00
Less Dense Vegetation +0.04 - +0.07
Bare Surface Area -0.08 - +0.04
Water Body -0.08 - -1.00
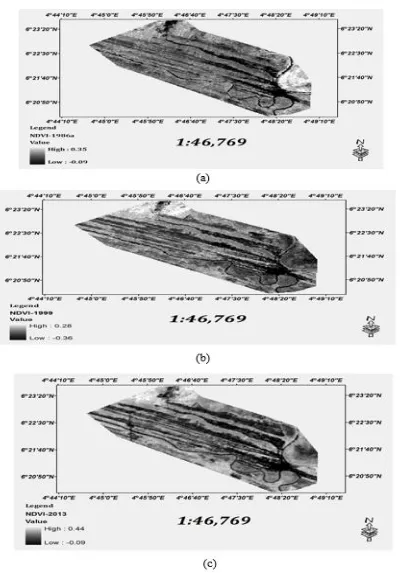
Greenness Index (GI) map reveals the spatial extent of vegetation cover over the selected parts of the study area.
2.11. Elevation of the study area above sea level
The elevations of the study area mapped out from the re-sampled Ikonos image were obtained from SRTM 30M DEM data in Arc GIS 9.3 environment.
3.
Result and Discussion
3.1. Vegetation Cover Index Maps
Figure 4: Greenness Index Map over the study area for periods: (a) 1986, (b) 1999 and (c) 2013
3.2. Land Cover Distribution Maps
Land use/Land cover geo-analysis of Igbokoda was carried out in order to depict the spatial extent to which, not only the vegetation has changed but the contribution of anthropogenic activities in this geographical location to flood occurrence. This become highly imperative in vegetation assessment analysis as related to flood event in any geographical location since vegetation depletion could result to reduction of the surface resistivity to water accumulation and high susceptibility to surface run off (water flow).
Figure 5 shows the classified Landsat image over the study area for the year 1986, 1999, and 2013 and simply revealed the change in the vegetation cover (the green tone), water bodies (the blue tone) and other features as depicted on their respective legend.
LAND USE/LAND COVER MAP FOR 2013 OVER IGBOKODA LAND USE/LAND COVER MAP FOR 1999 OVER IGBOKODA
LAND USE/LAND COVER MAP FOR 1986 OVER IGBOKODA
Table 5: The spatial extent of land cover over Igbokoda after classification
Table 6: Comparison of areas and rates of change of the four Landuse/Landcover classes between 1986-1999 and 1999-2013 for study area (Igbokoda)
Note: A decrease carries Negative sign while an increase carries positive sign
Land Cover types 1986 Area (km2) Area in % 1999 Area (km2) Area in % 2013 Area (km2) Area in %
Bare Surface 13.28029 5.08 39.60531 15.14 50.240 19.20
Built-up Area 19.63208 7.50 39.15045 14.97 64.152 24.52
Vegetation 196.30458 75.04 165.2766 63.18 122.468 46.81
Water Body 32.38441 12.38 17.56897 6.72 24.741 9.46
TOTAL 261.6014 100 261.6014 100 261.601 100
Land Cover types
1986 Area
(km2)
1999 Area
(km2)
2013 Area
(km2)
Change between 1986 and 1999
(Km2)
Average rate of change
(km2/yr)
Change between
1999 and 2013
(km2)
Average rate of change
(km2/yr)
Bare Surface 13.2803 39.6053 50.2400 26.325 2.025 10.6347 0.7596
Built-up Area 19.6321 39.1505 64.1520 19.5184 1.5014 25.0016 1.7858
Vegetation 196.3046 165.2766 122.4680 -31.02 -2.3868 -42.8086 -3.0578
5.08 7.50 75.04 12.38 15.14 14.97 63.18 6.72 19.20 24.52 46.81 9.46 0.00 10.00 20.00 30.00 40.00 50.00 60.00 70.00 80.00
Bare_Surface Built-up Area Vegetation Water_Body
LandUse/LandCover Categories Are a Cover ( %) 1986 1999 2013
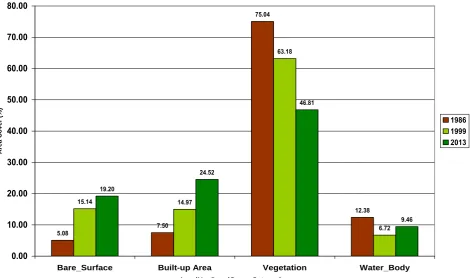
Figure 6: Percentage Area of the Land Cover Categories for 3 different years considered over Igbokoda
Figure 6 show that there exists a change in each of the Landuse/Landcover categories considered in this study (that is, Bare Surface, Built-up Area, Vegetation and water body). Vegetation which formed a resistive feature against flood has actually decreased from 75.04% in 1986 to 46.81% in 2013 which was due to increase in population resulting in high urbanization. The portion within the study area that reflects the influence of human activities (i.e., anthropogenic activities) was denoted as Built-up area. The Built-up area covers 1963.21 ha (19.6321 km2) of entire study area which was
7.50% of the whole spatial extent in 1986, but has increased to 14.97% that is 3915.05 ha (39.1505 km2) in the year 1999 and by the year 2013, 24.52% increment was recorded for Built-up (Table 5 and
Figure 6). Though, most of these built up are situated in the area associated with high elevation and along the road sides that had already been sand filled during road construction activity.
Figure 7: The map of the study area showing the elevation and slope angles
4.
Conclusion
GIS is a valuable tool to better manage, clarify and maintain resources. It is a proven decision support system employing land cover change maps among other data resources that are major products created from remotely sensed data. This study has established the fact that there has been a reduction in the vegetation cover over the area in 1986 towards 1999 and the decrease was still on the course towards 2013 which simply means there has been less hindrances to flow of water over the area and thereby enhancing the surface runoff. It could also be concluded from the DEM analysis that Igbokoda is a low land area with very low slope angle which make it highly susceptible to flooding.
References
[3] Ejemeyovwi, D. O. (2015). Change Detection in Land use/Land Cover Mapping in Asaba, Niger delta
between 1996 and 2015. A Remote Sensing and GIS Approach. British Journal of Environmental Sciences,
Vol.3, No.3, 42-61
[4] Wilkie, D.S. and Finn, J.T. (1996). Remote Sensing Imagery for Natural Resources Monitoring. Columbia
University Press, New York. Pp295
[5] Briney, A. (2008). An overview of Geographical Information
Systems.http://geography.about.com/od/geographyinter/a/gisoverview.htm. (Accessed 25 September 2014) [6] Zonneveld, I. S. (1979). Land evaluation and landscape science. Volume 11.4 of ITC textbook
International Institute of GeoInformation Science and Earth Observations (ITC) Enschede
[7] Miller, G. T. (1996). Living in the Environment. Principles, Connections and Solutions. Wardsworth. UK.
[8] Xiaomei, Y. and Ronqing, L.Q.Y. (1999). Change Detection Based on Remote Sensing InformationModel
and its Application to Coastal Line of Yellow River Delta – Earth Observation Center, NASDA, China. [9] Collins, M.G., Steiner, F.R. and Rushman, M.J. (2001). Land-use suitability analysis in the United States:
historical development and promising technological achievements. Environmental Management Vol. 28 No.5, 611 – 621.
[10] Malczewski J. (2004). GIS-based land-use suitability analysis: a critical overview. Progress in Planning
Vol.62 No.1, 3–65
[11] Hopkins, L. (1977). Methods for generating land suitability maps: a comparative evaluation. Journal for American Institute of Planners 34(1), 19 – 29.
[12] Jiang, H., and Eastman, J.R. (2000). Application of fuzzy measures in multi-criteria evaluation in GIS.
International Journal of Geographical Information System, Vol.14, 173 – 184.
[13] Adam, E., Mutanga, O., Odindi, J., Abdel-Rahman, E.M. (2014). Land-use/cover classification in a heterogeneous coastal landscape using Rapid Eye imagery: Evaluating the performance of random forest and support vector machines classifiers. International Journal of Remote Sensing Vol.35, 3440–3458. [14] Gong, P., Wang, J., Yu, L., Zhao, Y.C., Zhao, Y.Y., Liang, L., Niu, Z.G., Huang, X.M., Fu, H.H. and Liu,
S. (2013). Finer resolution observation and monitoring of global land cover: First mapping results with
Landsat TM and ETM+ data. International Journal of Remote Sensing, Vol.34, 2607–2654.
[15] Yacouba D., Hu, G. and Wen, X. (2010). Assessment of Land Use Cover Changes Using NDVI and DEM in Puer and Simao Counties, Yunnan Province, China.Report and Opinion, Vol.2 No.9, 7 – 16.
[16] Im, J., and Jensen, J. R. (2005). A change detection model based on neighborhood correlation image analysis and decision tree classification. Remote Sensing Environment. 99, 326 – 340.
[17] El Baroudy, A. A. (2011). Monitoring land degradation using remote sensing and GIS techniques in an area of the middle Nile Delta, Egypt. Catena Vol.87 No.2, 201–208.
[18] Liberti, M., Simoniello, T., Carone, M.T., Coppola, R., Emilio, M.D., and Macchiato, M. (2009). Mapping
badland areas using LANDSAT TM/ETM satellite imagery and morphological data. Geomorphology
Vol.106, 333 – 343.
[19] Gao, J., and Liu, Y. (2008). Mapping of land degradation from space: a comparative study of Landsat
ETM+ and ASTER data. International Journal of Remote Sensing, 29 (14), 4029 – 4043.
[20] Chafer, C. (2008). A comparison of fire severity measures: an Australian example and implications for predicting major areas of soil erosion. Catena Vol.74, 235 – 245.
[21] Geerken, R., and Ilawi, M. (2004). Assessment of rangeland degradation and development of a strategy for rehabilitation. Remote Sensing of Environment, Vol.90 No.4, 490–504
[22] Lu, D., Batistella, M., Mausel, P., Moran, E. (2007). Mapping and monitoring land degradation risks in the
Western Brazilian Amazon using multitemporal Landsat TM/ETM+ images. Land Degradation and
Development Vol.18, 41 – 54.
[23] Mathieu, R., Cervelle, B., Remy, D., Pouget, M. (2007). Field-based and spectral indicators for soil erosion mapping in semi-arid Mediterranean environments (Coastal Cordillera of central Chile). Earth Surf. Proc. Land. Vol.32, 13 – 31.
[25] Zandbergen, P. (2008). Applications of Shuttle Radar Topography Mission Elevation Data, Geography Compass, 2/5, pages 1401 – 1431, 10.1111/j.1749-8198.2008.00154.x
[26] Sanders, B. F. (2007). Evaluation of on-line DEMs for flood inundation modelling, Advances in Water Resources Vol.30, 1831 – 1843.
[27] Demirkesen, A. C., Evrendilek, F., Berberoglu, S. and Kilic, S. (2007). Coast flood risk analysis using
Landsat-7 ETM+ imagery and SRTM DEM: a case study of Izmir, Turkey, Environmental Monitoring and
Assessment, Vol.131 No.1-3, 293 – 300.
[28] National Aeronautics and Space Administration (NASA) (2011a). The Landsat Program, available at http://landsat.gsfc.nasa.gov/about/landsat1.html. (Accessed April 2, 2014)
[29] National Aeronautics and Space Administration (NASA) (2011b). Landsat 4 TM, available at http://landsat.gsfc.nasa.gov/about/landsat4.html (Accessed April 2, 2014)
[30] National Aeronautics and Space Administration (NASA) (2011c). Landsat 7 ETM+, available at http://landsat.gsfc.nasa.gov/about/landsat7.html. (Accessed April 2, 2014)
[31] Liew, S.C. (2001). Remote Sensing Tutorial, Principles of Remote Sensing, Centre for Remote Imaging,
Sensing and Processing, National University of Singapore, available at
http://www.crisp.nus.edu.sg/~research/tutorial/intro.htm. (Accessed October 10, 2014)
[32] National Aeronautics and Space Administration (NASA) (2011d). Landsat 6 ETM+, available at http://landsat.gsfc.nasa.gov/about/landsat6.html. (Accessed April 2, 2014)
[33] United States Geological Survey (USGS) (2011a). Earth Explorer Help Documentation, Version 0.5, available at http://edcsns17.cr.usgs.gov/NewEarthExplorer/documents/helptutorial.pdf. (Accessed October 30, 2014)
[34] Geospatial Innovation Facility (GIF) (2008).RS/GIS Quick Start Guides, Landsat Spectral Band Information, available at http://gif.berkeley.edu/documents/Landsat%20Band%20Information.pdfLast (Accessed September 20, 2014.)
[35] Ho, L. T. K., Umitsu, M. and Yamaguchi, Y. (2010). Flood hazard mapping by satellite images and SRTM DEM in the Vu Gia – Thu Bon Alluvial Plain, Central Vietnam, International Archives of the Photogrammetry, Remote Sensing and Spatial Information Science, 38, Part 8, Kyoto, Japan, available at http://www.isprs.org/proceedings/XXXVIII/part8/headline/TS-27/W01OH2_20100309140832.pdf, (Accessed November 30, 2014)
[36] United States Geological Survey (USGS) (2011b). Earth Explorer Landsat Product Type Descriptions, available at http://edcsns17.cr.usgs.gov/helpdocs/landsat/product_descriptions.html (Accessed October 30, 2014)
[37] United States Geological Survey (USGS) (2011c). Landsat Missions, Frequently Asked Questions about the Landsat Missions, available at http://landsat.usgs.gov/band_designations_landsat_satellites.php (Accessed November 5, 2014)
[38] United States Geological Survey (USGS) (2011d). Landsat Missions: Panchromatic Image Sharpening of landsat 7 ETM+, available at http://landsat.usgs.gov/panchromatic_image_sharpening.php (Accessed November 10, 2014)
[39] Rouse, J.W., Haas R. H., Schell J. A. & Deering D. W. (1974). Monitoring vegetationsystems in the Great Plains with ERTS. In: Fraden S.C., Marcanti E.P. & Becker M.A. (eds), Third ERTS-1 Symposium, 10 – 14 December 1973, NASA SP-351, Washington D.C. NASA, 309 – 317
[40] Adeyewa Z.D. (2007). Applications of Satellites in Monitoring Vegetation: The African Perspective, SAN. Conference, 3-6 September, Federal University of Technology, Akure
[41] Kwak, Y and Kondoh, A. (2008). A study on the extraction of multi-factor influencing floods from RS image and GIS data; a case study in Nackdong Basin, South Korea”, The International Archives of The Photogrammetry, Remote Sensing and Spatial Information Sciences, ISPRS Congress Beijing 2008, 37,
[42] Environmental Systems Research Institute (ESRI) (2009a). ArcGIS Desktop 9.3 Help, Creating a depressionless DEM, available at http://webhelp.esri.com/arcgiSDEsktop/9.3/index.cfm?TopicName= Creating_a_depressionless_DEM. (Accessed July 16, 2014)
[43] Environmental Systems Research Institute (ESRI) (2009b). ArcGIS Desktop 9.3 Help, Understanding
multivariate classification, available at http://webhelp.esri.com/arcgisdesktop/9.3/
index.cfm?id=6097&pid=6096&topicname=Under standing_multivariate_classification. (Accessed July 16, 2014)
Authors
James Rotimi Adewumi
James Rotimi Adewumi is currently a Senior Lecturer in the Department of Civil and Environmental Engineering at the Federal University of Technology Akure in Nigeria, where he teaches water engineering subjects at undergraduate and postgraduate levels. He obtained his PhD at the School of Civil and Environmental Engineering, University of the Witwatersrand, Johannesburg. His research interests lie in the fields of wastewater reuse, water resources planning and conservation. He has published several journal and conference papers, and has received two awards for portions of his PhD research.
Akomolafe James Kolawole
Akomolafe James Kolawole graduated from the Department of Civil and Environmental Engineering, Federal University of Technology Akure. He is currently a staff of Works and Physical Planning Unit at Ondo State University of Science and Technology Okitipupa Ondo State.His areas of interest include Water Resources Planning and Management
Ajibade Fidelis Odedishemi
Ajibade Fidelis Odedishemi is currently an Assistant Lecturer in the Department of Civil and Environmental Engineering, Federal University of Technology, Akure, Ondo State Nigeria. He obtained B.Eng. (Agricultural Engineering – Soil and Water Engineering option) in 2009 from University of Ilorin, Ilorin, Nigeria and Master degree in Civil Engineering from the Federal University of Technology, Akure, Nigeria in 2013. His research interests include Water and Wastewater Engineering, Solid Waste Management and Waste to Bioresource
Fabeku Blessing Bolarinwa