Turkish Journal of Fisheries and Aquatic Sciences 17:1219-1230(2017)
www.trjfas.org ISSN 1303-2712 DOI: 10.4194/1303-2712-v17_6_15
RESEARCH PAPAER
© Published by Central Fisheries Research Institute (CFRI) Trabzon, Turkey in cooperation with Japan International Cooperation Agency (JICA), Japan
Numerical Simulation of the Drag Force on the Trawl Net
Introduction
Trawl is one of the main fishing tools used in the world. The trawling system primarily comprises netting (a funnel-shaped net with top and bottom panels, a codend and sometimes side panels), ropes (footline, headline, bridles, warps and sweeps) and some other devices (otter boards, sinkers/ground gear and sometimes float) (Sterling, 2005).
Fish catch from trawling is today of great importance for both economics and food supply, and is responsible for 40% of the world catch (Reite, 2006). Trawl nets are designed to be towed by a boat through the water column (midwater trawl) or along the sea floor (bottom trawl). In order to improve the design of trawl system, it is necessary to conduct a series of researches on the hydrodynamics of trawl system.
To our knowledge, several researches were conducted to investigate the engineering performance of trawl system. Bridles, warps and parts of trawl nets can be treated as cables, and Johansen, Ersdal, Srensen, and Leira (2006) proposed a cable model suitable for real-time control applications, and validated its numerical model by comparing with the experimental data. The trawl doors are usually
three-dimensional multifoils with no thickness, large curvature and small aspect ratio. Mulvany, Tu, Chen, and Anderson (2004) estimated the hydrodynamic forces on the trawl doors using computational fluid dynamics (CFD) analysis through solving the Navier-Stokes equations with a finite element method. Takahashi, Fujimori, Hu, Shen, and Kimuraba (2015) conducted computational fluid dynamics analysis for a biplane-type otter board model to validate the use of CFD analysis in designing otter boards, indicating that CFD analysis is useful in the designing and development of otter boards. Several different methods have been proposed to construct mathematical models of general net structures, and some of these are focusing on trawl nets. Tsukrov, Eroshkin, Fredriksson, Swift, and Celikkol (2003) proposed a numerical model to analyze the hydrodynamic response of net panels to environmental loading with the concept of consistent finite element method. Priour (2005) developed a finite element method for simulating flexible structures made of nets, cables and bars, such as fishing gears and fish farming cages, which focus on a specific triangular element devoted to net modeling. Lader, Enerhaug, Fredheim, and Krokstad (2003) investigated dynamic properties of a flexible net sheet
Ming-Fu Tang
1, Guo-Hai Dong
1, Tiao-Jian Xu
1,2,*, Yun-Peng Zhao
1, Chun-Wei Bi
11 Dalian University of Technology, State Key Laboratory of Coastal and Offshore Engineering, Dalian 116024, China. 2University of Western Australia, School of Civil, Environmental and Mining Engineering, Crawley WA 6009, Australia.
* Corresponding Author: Tel.: +86.411 84708514-8102; Fax: +86.411 84708526; E-mail: [email protected]
Received 12 January 2017 Accepted 14 April 2017
Abstract
Trawling energy consumption is significantly affected by the drag on the trawl, which is determined by a series of design and operational variables. In this study, a fluid-net interaction model of a trawl system is developed to understand the hydrodynamic behavior of trawl. The k-ω shear stress turbulent (SST) model is applied to simulate the flow field through the net cage, and the large deformation nonlinear structural (LDNS) model is adopted to conduct the structural analysis of the flexible net cage. To validate the numerical model, the drag forces on the single circle cylinder and the net panel are
calculated and compared with the experimental data. The results indicate that the numerical model can be applied to calculate the drag force on the net panel. Then, the numerical model is adopted to calculate the drag force on the trawl, and the effect of twine diameter on the drag force acting on the trawl net is analyzed. In addition, an existing equation for analyzing the drag force on trawl net was expanded to consider the effect of twine diameter using this numerical model.
exposed to waves and current by numerical simulation, in which the net was modeled by dividing it into super elements. Kristiansen and Faltinsen (2012) proposed and discussed a screen type of force model for the viscous hydrodynamic load on nets, assuming that the net is divided into a number of flat net panels, or screens.
The previous research is generally focused on the hydrodynamic behavior of trawl system by numerical simulation and physical model tests. The fuel costs in trawl fishery account for 20 to 30% total costs, and the trawl energy efficiency is greatly affected by the drag. Therefore, it is beneficial for the trawler to save fuel consumption through analyzing the drag force (FD) on trawl nets in details. Priour
(2009) developed a numerical tool for the automatic optimization of the trawl design through reducing the drag per swept area. Fredheim (2005) developed a three-dimensional model for the flow around a net structure, such as a trawl, to predict selectivity of net structures, in which the twines are modeled as separate cylinders between knots and each of the twine elements is modeled as a set of source distributions and single point sources. FD on plane net
structure shows a strong dependency of FD on a net
structure with both the solidity ratio and the Reynolds number (Re). Broadhurst, Sterling, and Millar (2015) attempted to improve selection and engineering efficiency in an Australian penaeid fishery by considering different mesh size and side taper of a generic trawl design. The results indicate that the square-mesh wing/side panels were by far the most effective, reducing the catches of sub-commercial school prawns by up to 72%. Balash, Sterling, Binns, Thomas, and Bose (2016) examined the individual effects of the five design variables and the three operational variables on the drags and suggested that the physical model tests with the stiff, full-scale netting have produced significant model-to-full-scale prediction errors owing to the poor equivalence of net twine bending-stiffness-to-netting-tension ratio. In general, the hydrodynamic loads acting on the trawl net is usually calculated by using the modified Morison equation (Sterling, 2005), in which the drag coefficient (CD) is obtained from experimental data.
However, the trawl net after deformation is normally high solidity fish net, especially the codend part of trawl system. The flow field around the codend is complex, and the Morison equation may be not suitable for calculating the hydrodynamic loads on the nets, especially for the codend part of trawl nets. Thus, FD on the trawl net is calculated using
numerical model in this study, in which the flow field around and through nets are calculated and then the drag force on each net twine is obtained by integrating the pressure on net twines. The drag force and flow field around a single cylinder and FD on a net panel
obtained from experimental tests are applied to validate our numerical model. In addition, the PTPM model developed by Sterling (2005) for calculating
FD on trawl nets was expanded to consider the effect
of twine diameter on the drag force of trawl net through numerical simulations.
Given the above, the aim of this study is to develop a numerical model for investigating the influences of the diameter of net twine (d) on the deformations and the drag force (FD) of trawl in
current. The study is organized as follows: an elaborate numerical model is introduced, which the SST k-ω model is adopted to simulate the flow field around the trawl and the nonlinear structural finite element model was applied to analyze the deformation of trawl in current; and then, the numerical model is validated by comparing the numerical result with the existing experimental data of a circular cylinder and a plane net structure in current; after that, the impact of the twine diameter and the mesh size of trawl nets on FD and the netting
deformation are analyzed and some conclusions are presented.
Material and Methods
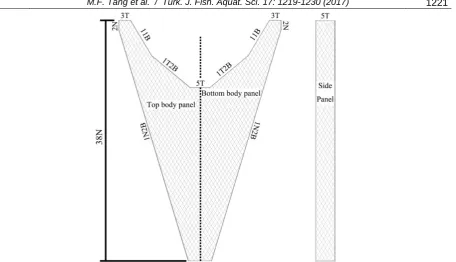
A numerical model for analyzing the flow field through trawl net and the deformation of trawl was proposed. The three-dimensional trawl model used in this study was established according to a 1/8-scale trawl, as shown in Figure 1. The Shear Stress Turbulent (SST) k-ω model is used to describe the flow field around the trawl, and the large deformation nonlinear finite element method is applied to describe the structural model of the trawl. The main concept of the numerical approach is to combine the SST k-ω model and the large deformation nonlinear finite element method to simulate the interaction between flow and trawl with one-way coupling techniques using software ANSYS. A more detailed description of the numerical model is given below.
Fluid Flow Model
The shear stress turbulent (SST) k-ω model is used to analyze the flow field around the trawl and FD
on the netting. The Navier-Stokes equation is solved using a finite volume method together with the SST k -ω model. More details about the fluid-netting interaction model are given below.
A numerical model of a net plane for a simple 1/8-scale trawl is shown in Figure 1, in which the net structure is represented by connections of cylinders, and it is introduced as an obstacle into the flow field. The finite volume method is applied to solve the governing equations of the flow field. Based on this numerical model, the flow field around every net mesh can be obtained.
model, in addition, the transport of the turbulence shear stress is also considered in the definition of viscosity. These features make the SST k-ω model more accurate and reliable for a wider class of flows and more sensitive to turbulent wall boundary layer than the other turbulent models.
The governing equations for describing the SST k-ω model are as follows:
The continuity equation:
(1)
The momentum equation:
(2) In Equations (1-2), is the density of the fluid,
and are the time-averaged velocity components for x, y and z, and and are the viscosity of the fluid and the eddy viscosity, respectively. , where p is the time-averaged pressure and P is the transient pressure; k is the turbulent kinetic energy; is the acceleration due to gravity, and i, j=1, 2, 3 (x, y, z).
The SST k-ω model solves two transport equations: the turbulent kinetic energy k and the turbulent dissipation rate ω, as follows:
(3)
(4) where is a production limiter for avoiding
build-up of turbulence in stagnation regions and F1 is a blending function, as follows:
(5)
(6)
With
and y is the distance to the nearest wall. In the near-wall region, F1=1, while it goes to zero in the outer region.
The turbulent kinetic eddy viscosity is defined as follows:
(7)
where S is the invariant measure of the strain rate and F2 is a second blending function defined by:
(8)
The constants used in the SST k-ω model are: α1=5/9, α2=0.44, β1=3/40, β2=0.0828, β=9/100, σk1=0.85, σk2=1, σω1=0.5, σω2=0.856.
boundary condition without shear force.
The turbulence parameters of the velocity-inlet boundary are given as follows,
, (9)
where ReD is the Reynolds number calculated
according to the hydraulic diameter of the flume (DH),
I is the turbulence intensity, l is the turbulence length scale, and is the empirical constant in the SST k-ω model.
The fluid-structure interface (fsi) is applied to define the contact surface between the flow and the fixed trawl, in which the fsi is modeled as a non-slip wall considering the viscosity force between the flow and the net twine. In addition, the roughness of the net twine is also considered in this numerical model, the roughness of the net twine is calculated as follows,
(10)
where and , fr is the
roughness function.
The governing equations for describing the flow field around the trawl are solved by using a three-dimensional pressure-based Navier-Stokes solver. The SIMPLEC (Semi-Implicit Method for Pressure Linked Equations-Consistent) algorithms (Vandoormaal & Raithby, 1984) are employed to deal with the pressure-velocity coupling. The discretization scheme for pressure, momentum, turbulent kinetic energy and turbulent dissipation rate are carried out using a second order upwind scheme. A converged solution is assumed to be reached when all residuals are less than 0.001.
Large Deformation Nonlinear Structural Model
A large deformation nonlinear structural (LDNS) model was applied to analyze the structural deformation of the trawl in current. The six-DoF
(degree of freedom) beam element is applied to simulate the net mesh, in which the beam element is connected with rotatable joints (i.e. the joint cannot withstand the bending moment). The beam element can only withstand the tension force, i.e. the compression stiffness of the beam element is assumed to be zero. The net material is polyethylene with elasticity modulus of 88 MPa and density of 900 kg∙m-3. The linear homogenous materials are applied for simulating the net twine. More details about the structural model of trawl net are given as follows.
The flexible trawl will suffer large deformation under the action of hydrodynamic loads, thus a large deformation nonlinear structure (LDNS) model (refer to Bathe, Ramm, & Wilson, 1975) is applied here to simulate the deformation of the trawl. It is assumed that the twine beam in the numerical model cannot withstand the compressive stress, i.e. the compressive yield strength and the compressive ultimate strength are set as zero for the structural model of trawl net. Beams are connected by hinge joint without rotational constraints.
The trawl structure will experience large deformation under the action of current, as shown in Figure 3. Therefore, the small deformation hypothesis has to be abandoned, and several basic assumptions were adopted here: the stress-strain relationship for the net material meets the generalized Hook’s law; both the normal force and the tangential force exist at each joint connecting beam element; the net twine can only withstand tensile force. For the large deformation nonlinear structural model, the structural stiffness of net is not only related with the initial configuration of net trawl and the net material, but also with the load on net trawl and the displacement of net trawl.
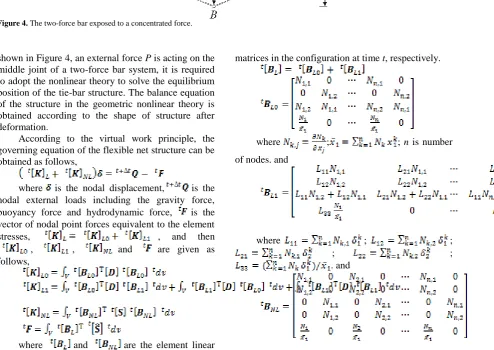
shown in Figure 4, an external force P is acting on the middle joint of a two-force bar system, it is required to adopt the nonlinear theory to solve the equilibrium position of the tie-bar structure. The balance equation of the structure in the geometric nonlinear theory is obtained according to the shape of structure after deformation.
According to the virtual work principle, the governing equation of the flexible net structure can be obtained as follows,
(11) where is the nodal displacement, is the
nodal external loads including the gravity force, buoyancy force and hydrodynamic force, is the vector of nodal point forces equivalent to the element
stresses, , and then
, , and are given as
follows,
(12)
(13) (14)
(15)
where and are the element linear and non-linear strain-displacement transformation
matrices in the configuration at time t, respectively.
(16)
(17)
where ; ; n is number
of nodes. and
(18)
where ; ;
; ;
. and
(19) Figure 3. Deformation of a plane net under the action of current.
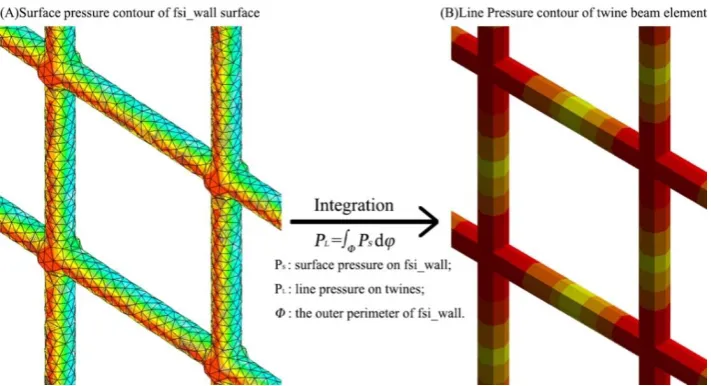
In this numerical model, there are two sets of elements and nodes, one for the flow fluid and the other for the trawl net structure. As shown in Figure 5, the pressure (Ps) on the fluid nodes located at the
fluid-structure interface can be obtained from solving the SST k-ω model, and then the line loads (PL) acting
on the trawl net element can be calculated by integrating the pressure on the fluid-structure interface along the outer perimeter of the net twine,
i.e. , where Ps is the surface pressure
on the fluid-structure interface (fsi), PL is the line load
on the net twine element, is the outer perimeter of net twine. The line load is acting on each net twine element as an input hydrodynamic load to calculate the deformation of net structure in current through the large deformation nonlinear structural model.
Due to the nonlinearity of the trawl system in current, the Newton-Raphson iteration method is applied to solve the Eq. (11), as follows:
(l=0, 1,
2,…) (20)
Where and l is
the number of iteration.
Experimental Validations of the Fluid-Net Interaction Model
Two existing experiments were adopted to verify the fluid-net interaction model which is used to calculate FD on the net trawl. FD acting on single
circular cylinder towed at different speeds is calculated and compared with the experimental data obtained from Fredheim (2005), and FD on a plane net
with different angles of attack is also calculated and compared with the experimental data obtained from Rudi, Løland, and Furunes (1988). In order to reduce the boundary effect of numerical water flume and to avoid the iteration non-convergence of numerical
simulation, numerical water flume (1.0 m 1.5 m 4.0 m-length width length) is applied to calculate FD on single circular cylinder and numerical
water flume (4.5 m 4.5 m 5.5 m- length width length) is adopted for calculating FD on the plane
net, respectively.
In Fredheim’s experiment, the vertical aluminum cylinder was attached to a horizontal steel cylinder and the vertical cylinder is 4.0 cm in diameter and 0.8 m in draught. The vertical aluminum cylinder is located at the upstream part of a water flume with 25.0 m length, 2.8 m width and 1.0 m depth. For the numerical simulation, the top of the circular cylinder model is fixed to the center of the water surface normal to the flow direction and the cylinder is simulated as a rigid body. The full-hexahedral grids are applied to generate the mesh of the numerical flume and the O-type grids are adopted to refine the mesh around the cylinder. The mesh size distribution is shown in Figure 6, and the total number of elements is 4, 186, 456.
FD on a circular cylinder was calculated for
different incoming velocities: u0=0.25, 0.375, 0.50 and 1.0 m∙s-1. F
D on the circular cylinder reaches a
steady state level for the numerical simulation after 15 s. The time step is set as 0.05 s and the twenty iterations are adopted for each time step to obtain a convergence result.
The numerical simulation for FD on the cylinder
was performed. Re is an important factor that will influence FD on circular cylinders, and is defined as
, where d is the diameter of net twine, is the kinematic viscosity and it is equal to 1.14×10⁻⁶ m2∙s-1 for fresh water with temperature of 15 and is the incoming flow velocity. The flow over a cylinder is affected by Re, which is typically 102-105 for the trawl structure. FD obtained from the
numerical simulation and the physical model test are
presented as a function of Re in Figure 7. The mean value and the maximum value of relative errors between the numerical simulation and the physical model test is 4.85% and 8.22%, respectively. It indicates that the numerical model can be applied to simulate the hydrodynamic loads on the cylinder.
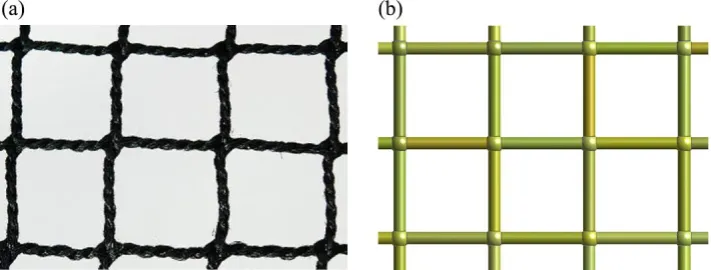
A 1.5 m × 1.5 m knotted net panel (Figure 8) with square mesh is applied here, and the net is fixed at a rigid frame to maintain its shape under the action of current. The properties of nets used here are shown in Table 1, and the angle of attack (α) is set to be 90°. The knotted net structure is simulated as a series of separate cylinders connected with spheres whose diameter is taken to be 1.5 times of the diameter of the net twine. The non-structured tetrahedral element is used to generate the mesh, and the curvature size
function (curvature normal angle is equal to 13.5°) is applied to refine the mesh close to the net twines, as shown in Figure 9.
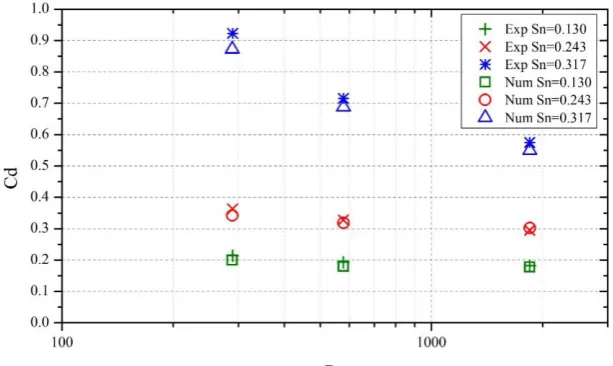
The current velocities applied in the numerical simulation are 0.18 m∙s-1, 0.36 m∙s-1 and 1.15 m∙s-1. CD for the net panel with different net solidities when
α is 90° are calculated and compared with the experimental data, as shown in Figure 10. CD for the
net panel with a solidity of 0.243 at different angles of attack are calculated and compared with the experimental data, as shown in Figure 11. In general, the numerical results are agreed well with the experimental data. The results indicate that CD is
increased with the increasing net solidity. When α is larger than 45°, CD is decreased with the increasing
Re; however, in the event that α is smaller than 30°,
Figure 7. Drag force on the circular cylinder as a function of Re.
Figure 8. Knotted net panel used in (a) the physical model test and (b) the numerical simulation.
Table 1. Properties of the nets used in the numerical simulation
Parameters No. 1 No. 2 No. 3
Net solidity (-) 0.13 0.243 0.317
Twine diameter dt (mm) 1.83 1.83 1.83
Figure 9. Non-structured tetrahedral meshes distribution for the numerical simulation of net in current
Figure 10. Cd of net panel with different net solidities as a function of Re
the relationship between CD and α becomes more
complicated. It is because with the decreasing α, the wake effect of the upstream net twine is significantly increased.
Results
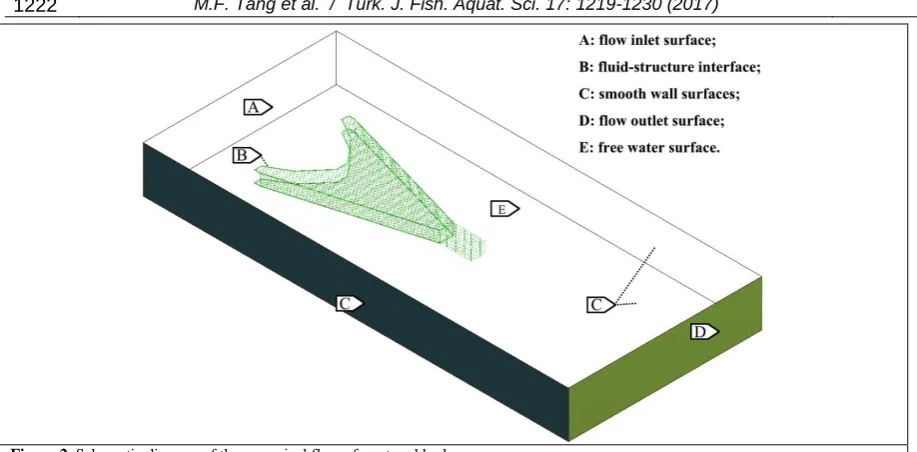
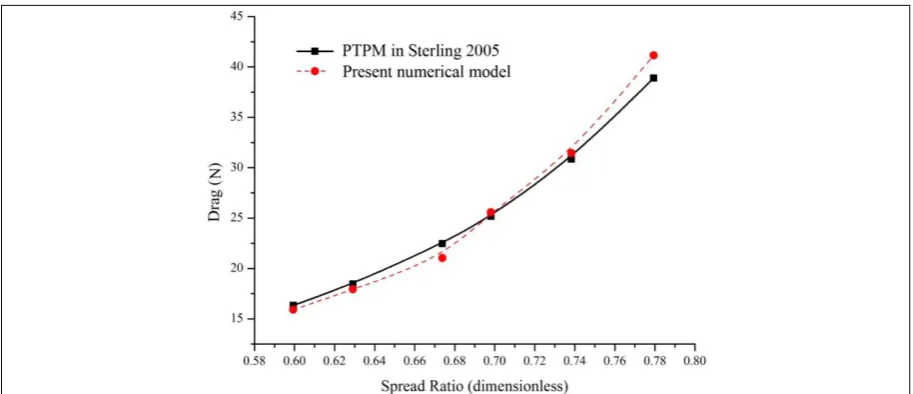
A 5.5 m long, 2.5 m wide and 0.6 m depth numerical water flume was adopted here and the trawl model is located at 0.5 m behind the inlet surface of the water flume. To ensure the reliability of the calculated results, a reference trawl model was built, in which the mesh size (mesh) is 50 mm and the net twine diameter is 1.45 mm corresponding to the thick of 27 ply, number of strands in netting twine, applied in Sterling (2005). The reference model was tested over a wide range of SRs from 0.60 to 0.78, with the increment of 0.03 and the flow velocity of 1.0 m∙s-1. Figure 12 shows that the calculated drags on the reference trawl model obtained from the numerical simulation agree well with the data estimated using the PTPM ver3 (Sterling, 2005) and the relative errors were less than 6.36%. It means that the numerical model can be applied to calculate FD on trawl nets.
In Sterling (2005), a series of design parameters were considered in the experiments to analyze their contribution to FD on trawl net, in which d is 1.45
mm, the effect of it on FD on trawl cannot be
analyzed. To improve the Sterling’s PTPM equation (Equation 21) for calculating FD on trawl net,
different diameters of net twine is considered and the effect of d on FD is analyze to expand the PTPM
equation. To expand the PTPM equation for calculating the drag on trawl net, a series of trawl models were considered with varying spread ratios, while the total number of net mesh is the same as that of the reference trawl model, as shown in Table 2. For each trawl model, several twine diameters (1-5 mm with increment of 1 mm) are analyzed and the current velocity is 1 m∙s-1. The spread ratio of trawl is constant because the end of head line and foot line is fixed and FD on trawl with different diameters of net
twine is calculated using this numerical simulation, as shown in Table 3.
The deformation of trawl (TM 1) with different diameters of net twine was analyzed to investigate the effect of net twine diameter on the deformation of trawl. The Elasticity modulus of net twine is 880 Mpa and the density of net twine is 910 kg∙m-3. As shown in Figure 13, the translation displacements of endpoints of the foot line and the head line of trawl are zero in the numerical simulation. The vertical
opening ratio is
defined to describe the deformation of trawl, where is the distance between points a and c; is the distance between the
Figure 12. Comparison of drag force on trawl with different spread ratios from the results of numerical simulation and Sterling’s PTPM equation (2005)
Table 2. Design parameters of trawl models (TM) used in the numerical simulation
Items Reference Model TM 1 TM 2 TM 3
Mesh size (2a; mm) 50.00 57.75 61.03 64.03
Hanging ratio (E) 0.46-0.73 0.50 0.57 0.62
Headline length (HL;m) 1.26-1.36 1.54 1.71 1.85
Headline height (HH; mm) 145 145 175 200
Body taper 1N2B 1N2B 1N2B 1N2B
highest point of the head line and the lowest point of the foot line of trawl in current. And Table 4 shows the vertical opening ratio of trawl in current (1 m∙s-1) when the deformation of trawl reached steady state.
Discussion and Conclusions
The selectivity of trawl is defined as the property of a trawl to catch fish of a certain size and species from a given mixed population in Fridman (1992). The selectivity of trawl net is affected by the fishing method and the design parameters of trawl net, such as mesh size, thickness of net twine, towing velocity and trawl body taper. Based on the experimental data, Sterling (2005) proposed an equation for calculating FD on the trawl net as a function of the design
parameters, as follows:
(21) where:
(21-1)
(21-2)
(21-3)
(21-4) where HL is trawl headline length; HH is trawl
headline height; MR is the ratio of the vertical length of the wing-end netting to HL and MT is that to HH; SR (Spread Ratio) is lateral spread expressed as a percentage of HL; Tapf is a factor that accounts for differences in trawl drag due to various trawl body taper and gape is the ratio of the lateral width of the trawl mouth to the mouth’s longitudinal depth; Kf is the ratio of ground effect forces to the hydrodynamic force at unit velocity.
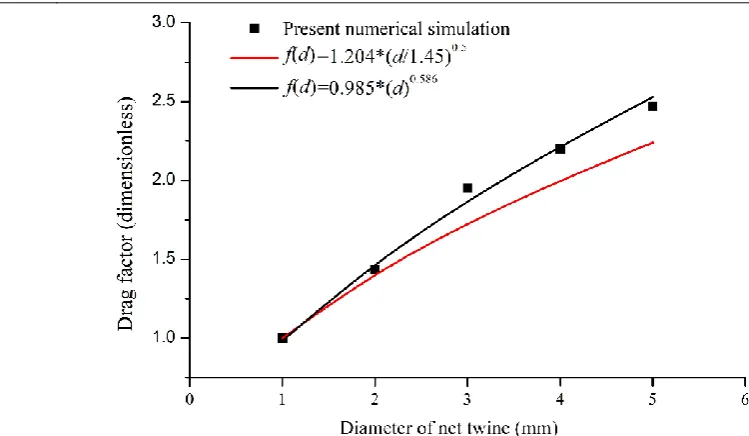
Based on the current study, the Equation 22 for expanding the PTPM model is obtained by fitting the numerical results, shown in Table 3, through the least-squared-method. Equation 23 is an existing equation proposed by Sterling (2005) for calculating FD on
trawl, in which the relationship between FD and the
diameter of net twine (d) is obtained by experience.
(22)
(23) The effect of d on the FD is shown in Figure 14.
The results indicate that FD on trawl is significantly
affected by d. Because the diameter of net twine in all experiments of Sterling (2005) is a constant, the Equation 25 in Sterling (2005) was not validated by
Table 3. Simulation results of drag factor of twine diameter with reference to 1 mm twine diameter
Twine diameter (mm) Drag factor
TM 1 TM 2 TM 3
1.0 1.00 1.00 1.00
2.0 1.41 1.45 1.41
3.0 1.94 1.97 1.95
4.0 2.11 2.23 2.25
5.0 2.47 2.56 2.55
Figure 13. Front view of deformation of the trawl model
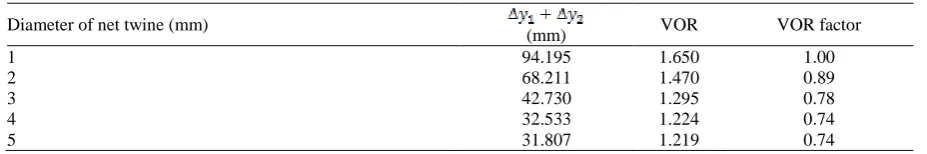
Table 4. Vertical opening ratio (VOR) of trawl model (TM1) in current after steady state
Diameter of net twine (mm)
(mm) VOR VOR factor
1 94.195 1.650 1.00
2 68.211 1.470 0.89
3 42.730 1.295 0.78
4 32.533 1.224 0.74
physical model experiments. According to the current numerical simulation, Equation 22 can estimate the effect of d on FD more accurately and expand the
PTPM equation to consider the factor of d more reasonably.
The effect of d on the VOR of trawl in current is shown in Table 4. The results indicate that the vertical deformation of trawl is decreased significantly with the increasing d. Non-dimensionalization of VOR can be performed to obtain the VOR factor, as shown in the last column of Table 4, and the VOR factor is fitted to be a function of d, as follows: . The influence of diameter of net twine is decreased with the increasing d.
Acknowledgements
This work was financially supported by the National Natural Science Foundation (NSFC) Projects No. 51239002, 51409037, 51579037, and 51221961, China Postdoctoral Science Foundation (No.2014M560211 and No.2015T80254), the Fundamental Research Funds for the Central Universities No. DUT16RC(4)25, and Cultivation plan for young agriculture science and technology innovation talents of Liaoning province (No.2014008).
References
Balash, C., Sterling ,D., Binns ,J., Thomas , G., & Bose, N. (2016). Drag characterisation of prawn-trawl bodies.
Ocean Engineering, 113, 18-23. doi: 10.1016/j.oceaneng.2015.12.034.
Bathe, K.J., Ramm, E., & Wilson, E.L. (1975). Finite element formulations for large deformation dynamic analysis. International Journal for Numerical
Methods in Engineering, 9, 353-386. DOI: 10.1002/nme.1620090207.
Broadhurst, M.K., Sterling, D.J., & Millar, R.B. (2015). Increasing lateral mesh openings in penaeid trawls to improve selection and reduce drag. Fisheries Research, 170, 68-75. DOI: 10.1016/j.fishres.2015.05.014.
Fredheim, A. (2005). Current forces on net structures. (PhD thesis). Norwegian University of Science and Technology, Trondheim, Norway.
Fridman, A.L. (1992). Calculations for fishing gear design, Fishing News Books Ltd, Farnham.
Johansen, V., Ersdal, S., Srensen, A.J., & Leira. B. (2006). Modelling of inextensible cable dynamics with experiments. International Journal of Non-Linear Mechanics, 41(4), 543-555. DOI: 10.1016/j.ijnonlinmec.2006.01.002.
Kristiansen, T., & Faltinsen, O.M. (2012). Modelling of current loads on aquaculture net cages. Journal of Fluids and Structures, 34, 218-235. DOI: 10.1016/j.jfluidstructs.2012.04.001.
Lader, P.F., Enerhaug, B., Fredheim, A., & Krokstad, J. (2003). Modelling of 3d net structures exposed to waves and current. In 3rd International Conference on Hydroelasticity in Marine Technology, Oxford, UK.
Mulvany, N., Tu, J.Y., Chen, L., & Anderson. B. (2004). Assessment of two-equation turbulence modelling for high Reynolds number hydrofoil flows. International Journal for Numerical Methods in Fluids, 45(3), 275-299. DOI: 10.1002/fld.698.
Priour, D. (2005). FEM modeling of flexible structures made of cables, bars and nets. In G. Soares and G. Fonseca, editors, Maritime Transportation and Exploration of Ocean and Coastal Resources (pp. 1285-1292). Taylor & Francis Group, London. DOI: 10.1201/9781439833728.ch158.
Priour, D. (2009). Numerical optimisation of trawls design to improve their energy efficiency. Fisheries Research, 98, 40-50. DOI: 10.1016/j.fishres.2009.03.015.
Rudi, H., Løland, G., & Furunes, I. (1988). Experiments with nets; forces on and flow through net panels and
cage systems (Report No. MT 51 F88-0215), MARINTEK, Trondheim, Norway.
Sterling, D. J. (2005). Modelling the physics of prawn trawling for fisheries management (PhD thesis), Curtin University of Technology, Perth, Australia. Reite, K. J. (2006). Modeling and control of trawl systems
(PhD thesis), Norwegian University of Science and Technology, Trondheim, Norway.
Takahashi, Y., Fujimori, Y., Hu, F.X., Shen, X.L., & Kimuraba, N. (2015). Design of trawl otter boards
using computational fluid dynamics. Fisheries Research, 161, 400-407. DOI: 10.1016/j.fishres.2014.08.011.
Tsukrov, I., Eroshkin, O., Fredriksson, D., Swift, M.R., & Celikkol, B. (2003). Finite element modeling of net panels using a consistent net element. Ocean Engineering, 30(2), 251—270. DOI: 10.1016/S0029-8018(02)00021-5.