_____________________________________________________________________________________________________ *Corresponding author: Email: dendeghterwaseabraham@gmail.com;
Quality Characteristics of Bread Produced from
Wheat and White Kidney Bean Composite Flour
M. T. Ukeyima
1*, T. A. Dendegh
1and S. E. Isusu
11
Department of Food Science and Technology, University of Agriculture, P.M.B 2373, Makurdi, Benue State, Nigeria.
Authors’ contributions
This work was carried out in collaboration among all authors. Author MTU designed the study, performed the statistical analysis, wrote the protocol and wrote the first draft of the manuscript.
Author TAD managed the analyses of the study. Authors TAD and SEI managed the literature searches. All authors read and approved the final manuscript.
Article Information
DOI: 10.9734/EJNFS/2019/v10i430120 Editor(s): (1)Dr. Kristina Mastanjevic, Assistant Professor, Department of Process Engineering, Faculty of Food Technology,
Josip Juraj Strossmayer University of Osijek, Croatia. Reviewers: (1) Tamer El. Sisy, Agriculture Research Center, Egypt. (2)Sazelin Arif, Universiti Teknikal Malaysia Melaka (UTeM), Malaysia. Complete Peer review History:http://www.sdiarticle4.com/review-history/51619
Received 15 July 2019 Accepted 20 September 2019 Published 31 October 2019
ABSTRACT
Aim: To evaluate the Quality characteristics of Bread produced from Wheat and Kidney Bean composite flour blend.
Study Design: Composite bread was produced from wheat and kidney bean flour of various proportions (10, 15, 20 and 25%). Proximate (protein, ash, moisture, fibre, fat and carbohydrate) composition, functional (Bulk density, foaming capacity, swelling index, water absorption capacity and oil absorption capacity) properties and sensory (appearance, taste, flavour, texture and overall acceptability) attributes were determined.
Results: Bread was produced from wheat and kidney beans composite (B, C, D and E) flour. The bread samples were subjected to physical, proximate and sensory analyses. The functional properties of the composite flour blends were also determined. The functional properties shows a significant (P<0.05) difference in water absorption capacity, oil absorption capacity and swelling index with values ranged from 1.10 – 0.60 ml/g, 1.03 – 0.76 ml/g and 5.92 – 2.89 ml/g respectively. The bulk density and foaming capacity shows significant (P<0.05) difference with its values ranging from 0.90 – 0.97 g/ml and 32.69 – 26.94 cm3 respectively as kidney beans flour increases. The result of the physical properties shows significant (P<0.05) difference in dough height, proofing
rate, loaf volume, specific volume, baking loss and oven spring with values ranging from 1.169 – 3.39 cm3, 0.01 – 0.02 cm3/min, 0.79 – 1.19 cm3, 0.32 – 0.48 cm3/g, 1.59 – 2.79 and 101.58 – 102.79 respectively while the loaf weight ranged from 243.21 – 246.09 g. proximate composition of the sample were also analyzed and the result shows significant (P<0.05) difference in crude protein, moisture content, ash, crude fat, crude fibre and carbohydrate with values ranging from 8.36 – 10.47%, 22.18 – 23.28%, 0.97 – 1.38%, 11.80 – 12.94%, 0.29 – 0.59% and 51.33 – 57.10% respectively. The results of the sensory scores shows a significant (P<0.05) difference in all the samples analyzed. However, sample C with 15% kidney beans flour was most preferred.
Conclusion: It could be concluded that increased in kidney beans flour addition in the production of composite bread had significant (P<0.05) impact on the proximate, physical and organoleptic properties of the bread. Hence, 85% wheat to 15% kidney bean flour should be used in bread making.
Keywords: Wheat; kidney beans; bread; composite flour.
1. INTRODUCTION
Bread is a staple food prepared from the dough of flour and water, usually by baking. Throughout recorded history, it has been popular around the world and is one of the oldest artificial foods, having been of importance since the dawn of Agriculture [1]. In Nigeria, Bread has been one of the most widely consumed food products after rice. Till date, most Nigerians have not been introduced to other types of bread apart from that made from 100% wheat flour. To cut the nation's expense on wheat importation and find wider utilization for the increasingly produced cassava roots, the Federal Government mandated the use of composite cassava-wheat flour for baking by adding a minimum of 10% cassava flour to wheat for a start [2]. To ensure the commercial success of this composite cassava wheat flour technology, systematic studies need to be conducted to fully understand the best way to formulate product and to determine the optimal processing conditions required to realize high quality baked products [2]. Most of the previous studies conducted on the use of composite flour for bread making purposes were devoted to determining the effect of the biological origin of flour and level of wheat flour substitution on their bread making quality [3]. The composite flours used were either binary or ternary mixtures of flours from some other crops with or without wheat flour. They generally observed a reduction in loaf volume and impairment of sensory qualities (e.g., appearance, texture and flavor) as the level of substitution of wheat with non wheat flour increased. Some varietal differences within the same crop in terms of bread making potential were also reported. Bread is the loaf that results from the baking of dough which is obtained from a mixture of flour, salt, sugar, yeast and water. This other ingredients like fat, milk solids, sugar,
egg, and anti-oxidant may be added. Nowadays, the emphasis is on healthy bread with low glycemic index, more protein and increase dietary fibre. Cassava is a major source of dietary energy for low income consumers in many parts of tropical Africa [4]. Cassava flour is one of the major flour used for composite blend. It can be substituted into many products (such as wheat flour) that provide the same function as it. Cassava flour seems to be golden products that have surpassed the imagination of stakeholders in the industry. Wheat flour which is used to produce many finished products is now gradually being replaced gradually with composite flour in Nigeria. The fact is not far from the reason that it improves the economic value of bakers [2].
Legumes on the other hand are important source of protein and dietary minerals by a number of ethnic groups in East, South and Central Africa [5]. Among the legume that is preferred by most Africans are the bean varieties. Beans are consumed in many forms: the young leaves, green pods and fresh bean grains are used as vegetables. Dry bean grains are used in various food preparations and both are used as relish or dishes together with the staple food [6]. The common bean such as kidney bean, soybeans etc is rich and inexpensive source of proteins, carbohydrates, dietary fibre to millions of people [7]. In addition to being an important source of protein, legumes are also reported to be a good source of minerals such as K, P, Ca, Mg and trace element [8]. Metals such iron, zinc and manganese are essential metals, since they play an important role in biological systems. Cu and Zn are essential micronutrients [9]. Kidney bean (Phaseolus vulgaris) in Africa, India, Latin America and Mexico is the most consumed pulse seed [5]. Worldwide, is the greatest consumed
unprocessed kidney bean are; 36.5 – 37.1% protein, 1.1 -1.2% fat, 61.7% carbohydrate (36.1%), 7.0 – 20% fibre and 3.04 – 4.4% ash [8].
2. MATERIALS AND METHODS
2.1 Materials
Dried white kidney bean (Phaseolus vulgaris) seed varieties were purchased from Akwanga local government of Nasarawa state while wheat flour and other ingredients were such as salt, sugar was purchased from North Bank market in Makurdi, Benue state.
2.2 Preparation of Kidney Bean Flour
The kidney bean seeds were cleaned to remove foreign materials, defected seeds, insect etc. the healthy beans were washed and conditioned for germination. After four (4) days of germination, the seeds were cooked at boiling temperature (100ºC) for 30 minutes. The water was drained after cooking and allowed to cool to prevent further cooking. The beans were dehulled to remove the skin. It then was washed and placed in a hot air oven to dry at 60ºC for 6 hrs. The dried beans were milled using a hammer mill into flour. It was then sieved using a 500 µm aperture as shown in Fig. 1. [11].
2.3 Bread Production Process
Bread was produced from wheat and kidney bean composite flour according modified method as described by Dendegh et al. [1]. The following formula was used for making bread: 250 g flour, 2 g yeast, 0.8 g salt, 80 ppm ascorbic acid, and variable water. Ingredients were weighed and made into dough in a Mono-Universal laboratory dough mixer for 40 min at speed of 500rpm. The dough was placed in a fermentation cabinet at 28ºC and 85% relative humidity for 90 min. After removal from the fermentation cabinet, the dough was divided into three pieces of 250 g each and formed into by hand. The dough were allowed to rest for 30 min under the same conditions, then dusted with flour and shaped into a rectangular pan by hand. The dough pieces were returned to the fermentation cabinet and proofed for 90 min then baked in a commercial oven (Real Forni- VERONA) at 250ºC for 15 min. The bread was left to cool for 20 min, then kept closed in polyethylene bags at room temperature (25ºC)
for sensory evaluation and physical
characteristics measurement.
Fig. 1. Flow chart for the production of kidney bean flour
Source: modified method of Yatnatti et al., (2014)
2.4 Functional Properties of Flour Produced from Kidney Bean and Wheat Flour
2.4.1 Bulk Density (BD)
This was done according to the method as described by Giami and Bekebain [12]. Ten (10) mil capacity graduated cylinder was weighed on a digital scale. The cylinder was gently filled with five (5) grams of the flour. The cylinder was then tapped on the laboratory bench several times until no further diminution of the sample level was observed from the 10 mil mark.
= weight of sample (g)
Table 1. Blend formulation for composite bread production
Samples Wheat flour Kidney bean Salt Sugar Yeast Fat
A 100 0 0.8 16 2 8
B 90 10 0.8 16 2 8
C 85 15 0.8 16 2 8
D 80 20 0.8 16 2 8
E 75 25 0.8 16 2 8
Fig. 2. Flow chart for the production of composite bread
Source: modified method of Dendegh et al., (2018)
2.4.2 Water Absorption Capacity (WAC)
This was done according to the method as described by Giami and Bekebain [12]. One gram of the sample was weighed into a graduated centrifuge tube. Ten (10) mil of distilled water was added and the sample was then mixed thoroughly with a glass rod. It was then transferred to a centrifuge at 500rpm for 30
min, after which the volume of the supernatant was read directly from the graduated centrifuge tube.
2.4.3 Swelling Index (SI)
The swelling index was determined using the method as described by Giami and Bekebain [12]. Five (5) gram of the sample was weighed into a clean and dry graduated measuring cylinder. Fifty (50) ml of boiled distilled water was added and stirred with a glass rod. It was then allowed to stand for one (1) hour after which the change in volume of the sample was recorded every fifteen (15) min. the ratio of the initial volume to the final volume as swelling Index was calculated as;
2.4.4 Foam Capacity (FC)
The foam capacity was determined according to the method as described by Giami and Bekebain [12]. One (1) gram of sample was blended with fifty (50) ml of distilled water and whipped for five
(5) min at 1600rpm. The whipped mixture was transferred into a 250 ml measuring cylinder and the volume was recorded after 30
sec. the foam capacity was the expressed as percentage increase in volume using as
follows;
2.5 Physical Properties of Bread
2.5.1 Loaf weight
2.5.2 Loaf volume
This was determined by using the rape seed displacement method of Adeleke and Odedeji [14]. This was done by placing the bread sample inside a graduated container and adding 3 kg of sorghum grain into a graduated container containing the bread sample to the bread level. After which the bread was then removed and the volume of the sorghum grain in the container was measured and recorded as loaf volume cm3.
2.5.3 Specific loaf volume
The specific volume (volume to mass cm3/g) was calculated as described by Puhr and Applonia [13].
= loaf mass X100
2.5.4 Determination of baking loss
This was analyzed in terms of moisture loss as described by Ihekoronye and Ngoddy [15]. Loss was also calculated by the baking yield. Dough baking yield was determined by comparing the fresh dough weight (w1) before placing in the oven and with the final bread weight (w2). The loaves were weighed one hour after removing from the oven (w2). This baking loss was a measure of loss moisture of the bread during baking and expressed in terms of percentage;
= baking loss
ℎ X100
2.5.5 Loaf height
The bread height was determined by using a measuring rule.
2.6 Proximate Composition of Bread Produced from Wheat and Kidney Beans Composite Flour
The proximate composition was done by the method as described by Malomo et al. [16].
2.6.1 Moisture content determination
The moisture content of the flour samples was determined according to the method described by Malomo et al. [16]. Two grams each of the flour samples were weighed into different moisture cans. It was then placed in an oven at 150ºC for three hours. Drying was stopped after obtaining two consecutive values differing by
0.001. The samples were cooled in desiccators and weighed.
% = weight loss
ℎ X100
2.6.2 Ash content determination
Porcelain crucible was dried and cooled in desiccators before weighing. Two (2) grams of the sample flours were weighed into the crucible and the weight taken. The crucible containing the samples were placed in the muffle furnace and ignited at 550ºC. This temperature was maintained for three hours. The muffle furnace was then allowed to cool; the crucibles were then brought out, cooled and weighed. The ash content was calculated as follows:
% ℎ = w2 − w3
ℎ X100
2.6.3 Crude fat content determination
The fat content of the flour samples was determined using two (2) grams each of the flour samples in a filter paper and placed in a soxhlet reflux flask which is connected to a condenser on the upper side and a weighed oil extraction flask full with two hundred ml petroleum ether. The ether was brought to its boiling point, the vapor condensed into the reflux flask immersing the samples completely for extraction to take place on filling up the reflux flask siphons over carrying the oil extract back to the boiling solvent in the flask. The process of boiling, condensation, and reflux was allowed to go on for four hours before the defatted samples were removed. The oil extract in the flux was dried in the oven at 60ºC for thirty minutes and then weighed.
% = weight of oil
ℎ X100
2.6.4 Crude fibre determination
crucible. The residue was then dried in an electric oven and weighed; the residue was incinerated, cooled and weighed.
% =w2 − w3
1 X100
Where:
W1 = weight of sample used, W2 = weight of crucible plus sample, W3 = weight of sample crucible + ash.
2.6.5 Crude protein determination
Crude protein of the sample flours was determined using the Kjeldahl method. One gram of the sample was introduced into the digestion flask. Kjedahl catalyst (Selenium Tablets) was added to the sample. Twenty ml of concentrated sulphuric acid was added to the sample and fixed to the digester for eight hours until a clear solution was obtained. The cooled digest was transferred into one hundred ml volumetric flask and made up to the mark with distilled water. The distillation apparatus was set and rinsed for ten minutes after boiling. Twenty ml of 4% boric acid was pipetted into a conical flask. Five drops of methyl red were added to the flask as an indicator and the sample was diluted with seventy-five ml distilled water. Ten ml of the digest was made alkaline with twenty ml of NaOH (20%) and distilled. The steam exit of the distillatory was closed and the change of color of the boric acid solution to green was timed. The mixture was distilled for fifteen minutes. The filtrate was then titrated against 0.1 N HCl. The percentage total was calculated:
% =(b − a) x 0.1N x 0.142
ℎ X 100
% = % nitrogen x 6.25
2.6.6 Carbohydrate content determination
Carbohydrate content of the flour samples was determined by using the formula described by Emmanuel-Ikeme et al. [17].
% Carbohydrate = 100 − % (protein + fat + fibre + ash +moisture content)
2.6.7 Sensory evaluation of bread samples
The sensory scores of the bread sample was done using the 9 – point hedonic scale ranging from 1 (dislike extremely) to 9 (like extremely) as described Emmanuel-Ikeme et al. [17]. Twenty (20) semi- trained panelists were presented with the samples and they were asked to evaluate for appearance, taste, texture and overall acceptability.
3. RESULTS AND DISCUSSION
3.1 Functional Properties of Wheat and Kidney Bean Composite Flour
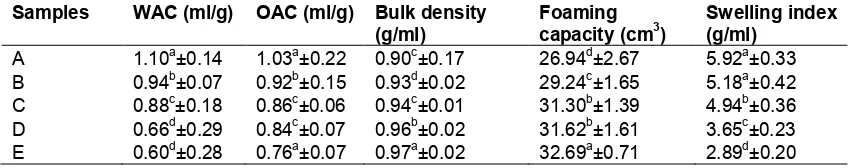
The functional property of wheat and kidney bean composite flour is presented in Table 2. The water and oil absorption capacities decreases (1.10 to 0.60 and 1.03 to 0.76 respectively) as the quantity of kidney bean flour increased. The result tends to agree with [12] who reported similar findings. The foam capacity increased in all the samples with increase in kidney bean addition. This agrees with Abdeghafor et al. [18] who reported that legumes have high foaming capacity. The swelling Index of the composite flour decreases with increase kidney bean addition while the bulk density of the flour increased from 0.90 to 0.97 g/ml.
Table 2. Functional properties of wheat and kidney bean composite flour
Samples WAC (ml/g) OAC (ml/g) Bulk density
(g/ml)
Foaming capacity (cm3)
Swelling index (g/ml)
A 1.10a±0.14 1.03a±0.22 0.90c±0.17 26.94d±2.67 5.92a±0.33
B 0.94b±0.07 0.92b±0.15 0.93d±0.02 29.24c±1.65 5.18a±0.42
C 0.88c±0.18 0.86c±0.06 0.94c±0.01 31.30b±1.39 4.94b±0.36
D 0.66d±0.29 0.84c±0.07 0.96b±0.02 31.62b±1.61 3.65c±0.23
E 0.60d±0.28 0.76a±0.07 0.97a±0.02 32.69a±0.71 2.89d±0.20
Values are means ± SD of triplicate determinations. Value followed by a different superscript within the same column are significantly (P<0.05) different
Keys: A = Control (100%); B = Wheat flour 90% and kidney bean 10%; C = Wheat flour 85% and kidney bean 15%; D = Wheat flour 80% and kidney bean 20%; E = Wheat flour 75% and kidney bean 25%; WAC = Water
3.2 Physical Properties of Dough and Bread Produced from Wheat and Kidney Bean Composite Flour
The result of the physical properties of the composite bread is presented in Table 3. The average dough height decreases (3.39 to 1.69 cm) with increase in kidney bean flour addition. This is because of the reduction in the gluten network of wheat flour which in turn impairs the retention of carbon dioxide produced Greene and Bovell-Benjamin [19]. The proofing rates also decrease from 0.02 to 0.01 cm3/min while the loaf weight tends to increase with increased kidney bean addition. The loaf weight of the composite bread as compared to the control sample was higher. This could be due to the increased amount of kidney bean flour addition and probably poor leavening ability of the composite flour dough. This could however lead to poor carbon dioxide production and entrapment due to dilution in the gluten content [20]. More so, Eke et al. [21] reported that bulk bread is desirable to hungry consumers because it is stomach filling and satisfying. The loaf volume of the composite bread samples were observed to increased with increase in kidney bean flour addition. Though, increase in the composite bread samples was less than that of the control sample. This was because more gas was produced in the control sample than the composite bread samples [1]. The result tends to agree with those presented by Makinde and Akinoso [22]. Specific volume, baking loss and oven spring decreased with increased in kidney bean addition which results in reduced gluten content.
3.3 Effect of Kidney Bean Addition on the Proximate Composition of Wheat Composite Bread
Table 4 shows the proximate composition of wheat and kidney bean composite bread. The high crude protein content in this work was due to kidney bean addition. The crude protein was also found to be higher than that of the control (100% wheat) bread. This result agrees with those presented by Cornell et al. [23] but is less than those presented by Olaoye et al. [24]. The Ash content of the composite bread is higher than the control. The increase in ash content could be due to increase in kidney bean flour inclusion as reported by Makinde and Akinoso [22]. The crude fat content also was found to be higher than the control (100% wheat). This could possibly be as a result of the amount of
margarine added during ingredient mixing. However, Makinde and Akinoso [22] suggested that more butter, sugar etc. to aid production of carbon dioxide in composite bread. The moisture content of the bread was below that reported Michael et al. [25]. The moisture content presented in Table 4 agrees with the study reported by [23;25]. Moisture 30 – 35% for bread is good compared to the maximum value of 40% specified by SON. The moisture content of food is usually used as an indicator of food quality. Hence, the moisture content presented above was satisfactory. Too high moisture content in bread could have a potential impact on the
sensory physical and even microbial
characteristic of the bread [26]. The crude fibre content of the composite bread was higher than that of the control (100% wheat). Increase in the crude fibre content of the composite bread arising from kidney bean flour. This adverse effect as suggested by Olaoye et al. [24] could be seen in the dough structure and volume. This is because of the reduction in the gluten network of wheat flour which in turn impairs the retention of carbon dioxide produced. It had also been reported that crude fibre had an adverse effect on the mineral element in the body [19].
3.4 Effect of Kidney Bean Flour Addition on the Sensory Properties of Bread Produced from Wheat
270
Table 3. Physical properties of dough and bread produced from wheat and kidney bean composite flour
Sample Average dough
height (cm)
Proofing rate (cm3/min)
Loaf weight (g) Loaf volume (g) Specific volume (cm3/g)
Baking loss Oven spring
A 3.39a±0.13 0.02a±0.00 243.21c±0.86 1.19a±0.05 0.48a±0.21 2.79a±1.20 102.79a±0.03
B 2.55b±0.17 0.02a±0.00 245.63b±3.53 1.07b±0.11 0.44a±0.16 1.78c±0.90 101.78b±0.02
C 2.42b±0.07 0.01b±0.00 245.27b±3.16 1.02b±0.10 0.42a±0.14 1.93b±1.03 101.92b±0.03
D 1.94c±0.21 0.01b±0.00 245.80b±0.76 0.86c±0.05 0.35b±0.10 1.71c±0.86 101.70b±0.02
E 1.69c±0.17 0.01b±0.00 246.09a±0.98 0.79c±0.02 0.32b±0.09 1.59d±0.42 101.58c±0.01
Values are means ± SD of triplicate determinations. Value followed by a different superscript within the same column are significantly (P<0.05) different Keys: A = Control (100%); B = Wheat flour 90% and kidney bean 10%; C = Wheat flour 85% and kidney bean 15%; D = Wheat flour 80% and kidney bean 20%
E = Wheat flour 75% and kidney
Table 4. Proximate composition of bread produced from wheat and kidney bean composite flour (%)
Sample Moisture Ash Crude fat Crude fibre Crude protein Carbohydrate
A 22.18e±0.03 0.66e±0.02 11.31e±0.11 0.29d±0.03 8.36e±0.04 57.10a±0.06
B 22.49d±0.43 0.97d±0.02 11.80d±0.12 0.36c±0.03 8.66d±0.03 56.50b±0.08
C 22.49c±0.03 1.13c±0.04 11.97c±0.05 0.43b±0.10 9.92c±0.04 54.64c±0.07
D 24.00a±0.04 1.53a±0.10 12.77b±0.04 0.48b±0.11 10.18b±0.11 51.03d±0.12
E 23.28b±0.03 1.38b±0.05 12.94a±0.03 0.59a±0.02 10.47a±0.10 51.33d±0.09
Values are means ± SD of triplicate determinations. Value followed by a different superscript within the same column are significantly (P<0.05) different Keys: A = Control (100%); B = Wheat flour 90% and kidney bean 10%; C = Wheat flour 85% and kidney bean 15%; D = Wheat flour 80% and kidney bean 20%;
E = Wheat flour 75% and kidney
Table 5. Sensory scores of bread produced from wheat and kidney bean composite flour
Samples Texture Flavor Texture Crumb colour Crust colour Overall acceptability
A 6.80b±0.42 6.55b±0.21 6.40c±0.12 6.85b±0.04 6.95c±0.10 6.65b±0.13
B 6.50b±0.33 6.70b±0.30 6.40c±0.04 7.50a±0.10 7.40b±0.13 7.05a±0.15
C 7.20a±0.63 7.30a±0.03 6.95a±0.13 7.35a±0.03 7.80a±0.08 7.20a±0.09
D 6.50b±0.83 7.50c±0.10 6.55b±0.04 7.60a±0.17 7.45b±0.04 7.00a±0.12
E 6.00c±0.61 6.10b±0.23 6.20d±0.14 6.50b±0.13 7.70c±0.09 6.10c±0.14
Values are means ± SD of triplicate determinations. Value followed by a different superscript within the same column are significantly (P<0.05) different Keys: A = Control (100%); B = Wheat flour 90% and kidney bean 10%; C = Wheat flour 85% and kidney bean 15%; D = Wheat flour 80% and kidney bean 20%;
Crumb and crust colour respectively. Generally, the baking properties of composite flour are often impaired as well as the organoleptic attributes of the product because of the dilution of the gluten content [27]. Nevertheless, it is evident from the result that the composite bread samples were more acceptable by the panelists.
4. CONCLUSION
It could be concluded that bread was produced from wheat and kidney beans composite flour. Though, the composite samples were found to be high in ash, fat, fibre and protein. The carbohydrate contents were found to be lower than that of the control sample. Water absorption capacity, Oil absorption capacity, bulk density and Swelling index decrease with increased kidney bean flour. On the other hand the foaming capacities increase with increase kidney bean flour addition. The sensory properties indicated that sample C was the most preferred sample.
COMPETING INTERESTS
Authors have declared that no competing interests exist.
REFERENCES
1. Dendegh TA, Gernah DI, Eke MO.
Investigate the effects of increased yeast addition and proofing time on the quality characteristic of bread from wheat and cassava flour. Asian Food Science Journal. 2018;3(4):1-10.
[Article no.AFSJ.42697]
2. FIIRO. The prospects and challenges of cassava bread and confectioneries in Nigeria. Retrieved from Lagos, Nigeria. FIIRO; 2013.
3. Shittu TA, Raji AO, Sanni LO. Bread from composite cassava-wheat flour: I. effect of baking time and temperature on some physical properties of bread loaf. Food Research International. 2007;40:280. DOI: 10.1016/j.foodres.2006.10.012 4. Berry SS. Socio-economic aspect of
cassava cultivation and use in Afica: Implication for the development of appropriate technology. Retrieved from Ibadan; 1993.
5. Shimelis EA, Rakshit SK. Effect of Processing on antinutrients and in vitro protein digestibility of kidney bean (Phaseolus vulgaris) varieties grown in East Africa. Food Science. 2007;270–275.
6. Edema MO, Sanni LO, Sanni AI.
Evalauttion of Maize-Kidney bean flour blends for sour maize bread production in Nigeria. African Journal of Biotechnology. 2005;4(9):911-918
7. Wang N, Hatcher DW, Tyler RT, Toews R, Guwalko EJ. Effect of cooking on the composition of bean (Phaseolus vulgaris L.) and Chicken Pea (Cicer arietinum L.) food Research International. 2009;43:589-594
8. Genccelep H, Uzun Y, Tuncturk Y, Demirel K. Determination of mineral content of wild-grown mushroom. Food Chemistry. 2009; 133:1033-1036
9. Jangchud K, Bunag N. Effect of soaking
time and cooking time on the quality of red kidney bean flour. Kasetsart Journal of natural Science. 2001;3(5):409-413.
10. Yatnatti GI. Processing and nutritive value of Mango seed kernel flour. Current Research in Nutrition AND Food Science. 2014;2(3):170-175
11. Onwuka GI. Food analyses and
instrumentation. Theory and practice, Surulere, Lagos. Nigeria. Naphthali prints A division off AG support Nigeria ltd no 6 Adeniyi Jones Close; 2005.
12. Giami SY, Bekebain DA. Proximate composition and functional properties of raw and processed full-fat fluted pumpkin seed flour. Journal of Science, Food and Agriculture. 2004;59:321–325.
13. Puhr DP, Applonia BI. Effect of baking absorption on bread yield, crumb moisture and crust water activities. Cereal Chemical. 2002;69:582–586.
14. Adeleke RO, Odedeji JO. Functional properties of wheat and sweet potato flour blends. Pakistan Journal of Nutrition. Asian Network for Scientific Information. 2010; 9(6).
[ISSN: 1680-5194]
15. Ihekoronye AI, Ngoddy PO. Integrated food science and technology for the tropics. Macmillan Publishers Limited Lodon. 1985;236–253.
16. Malomo SA, Eleyinmi AF, Fashakin JB. Chemical composition, rheological
properties and bread making potentials of composite flour from breadfruit, breadnut and wheat. African Journal of Food Science. 2011;5(7):400–410.
and tiger nut. British Journal Sci Abd Tech. 2012;2(4:356-366).
18. Abdeghafor RF, Mustafa AI, Ibrahim AMH, Krishnan PG. Quality of bread from composite flour of sorghum and hard white winter wheat. Advance Journal of Food Science and Technology. 2011;3(1):9–15.
19. Greene JL, Bovell-Benjamin AC.
Macroscopic and sensory evaluation of Bread supplemented with sweet potato flour. Journal of Food Science. 2004;69(4): 167–173.
20. Eduardo M. Enhancing composite cassava
bread quality effect of cassava
pretreatment and baking improvers; 2015. 21. Eke MO, Ariahu CC, Gernah DI. Chemical
and sensory evaluation of bread sold in benue and Nasarawa States of Central Nigeria. Advance Journal of Food Science and Technology Maxwell Scientific Organization. 2013;5(5).
22. Makinde FM, Akinoso R. Physical, nutritional and sensory qualities of bread samples made with wheat and black sesame (Sesamum indicum Linn) flours.
International Food Research Journal. 2014;21(4):1635-1640.
23. Cornell H. (Ed.). The functionality of wheat starch. England: Woodhead Publishing Limited; 2004.
24. Olaoye OA, Onilude AA, Idowu OA. Quality characteristics of bread produced from composite flours of wheat, plantain and soybeans. Afri. J. Biotechnol. 2006;11: 1102-1106.
25. Michael OA, Gernah DI, Igbabul BD. Physico-chemical and sensory evaluation of wheat bread supplemented with stabilized undefatted rice bran. Food and Nutrition Sciences. 2013;4:43-48.
Available:http://dx.doi.org/10.4236/fns.201 3.49A 2007
26. Kent NL, Evers AD. Technology of cereals–an introduction for students of food science and agriculture. ((4th ed.) ed.). UK: Elsevier Science Ltd.; 1994.
27. Jideani V. Optimisation of wheat-sprouted soybean flour bread using response surface methodology. African Journal of Biotechnolology. 2009;8(22):6364-6373.
© 2019 Ukeyima et al.; This is an Open Access article distributed under the terms of the Creative Commons Attribution License (http://creativecommons.org/licenses/by/4.0), which permits unrestricted use, distribution, and reproduction in any medium, provided the original work is properly cited.
Peer-review history: