Cite as
Dereń-Wagemann IE, Kuliczkowski K. Significance of apoptosis and autophagy of leukemic blasts for the outcomes of acute myeloid leukemia patients. Adv Clin Exp Med. 2019;28(7):861–869. doi:10.17219/ acem/93849
DOI
10.17219/acem/93849
Copyright
© 2019 by Wroclaw Medical University This is an article distributed under the terms of the Creative Commons Attribution Non-Commercial License (http://creativecommons.org/licenses/by-nc-nd/4.0/)
Address for correspondence
Izabela Elżbieta Dereń-Wagemann E-mail: izabeladw@gmail.com
Funding sources
None declared
Conflict of interest
None declared
Acknowledgements
We are deeply grateful for the help in performing the measurements and analyses to: Professor Piotr Dzięgiel (Head of the Department of Histology and Embryology, Wroclaw Medical University, Poland), Professor Maciej Ugorski (Head of the Depart-ment of Biochemistry and Molecular Biology, Faculty of Veterinary Medicine, Wrocław University of Environmental and Life Sciences), Mateusz Olbromski, MSc (Department of Histology and Embryology, Wroclaw Medical University), and Jarosław Suchański, PhD (Department of Biochem-istry and Molecular Biology, Faculty of Veterinary Medicine, Wrocław University of Environmental and Life Sciences).
Received on September 17, 2017 Reviewed on December 6, 2017 Accepted on July 31, 2018 Published online on June 12, 2019
Abstract
Background. Cytostatic treatment induces apoptosis or other types of cell death like autophagy, necro-sis, mitotic catastrophe, etc. Autophagy can play a role in the drug resistance of neoplastic cells, allowing the survival of blast cells under stressful conditions, such as the use of cytostatics. Studies on apoptosis and autophagy 12–24 h after the start of treatment have not been conducted until now.
Objectives. The study aimed to investigate the predictive and prognostic significance of autophagy and apoptosis in patients with acute myeloid leukemia (AML).
Material and methods. The study included 38 patients. Blood was collected before and 12–24 h after the start of treatment, since at that time point, the appropriate blast cell count was still available. Autophagy was measured with the expression of the ATG5, MAP1L3, LC3-I, and LC3-II proteins. The percentage of mono-nuclear cells in early and late apoptosis was evaluated with flow cytometry, using the annexin V and propidium iodide (PI) binding assay.
Results. The percentage of apoptotic blast cells before treatment was not associated with the response. However, in the remission group, the overall percentage of apoptotic cells measured 12–24 h after the start of treatment was higher than in non-remission patients, which was statistically significant. In neither group we found any difference in the level of autophagy before and 12–24 h after the start of treatment. Neverthe-less, we observed an increasing tendency of the MAP1LC3 protein expression (not statistically significant) in the remission group 12–24 h after the start of treatment. Patients with a higher percentage of blast cells in apoptosis and with a higher expression of MAP1LC3 protein measured 12–24 h after the start of the therapy had longer overall survival (OS).
Conclusions. A higher percentage of apoptotic as well as autophagic blast cells measured 12–24 h after the start of the chemotherapy is an independent factor associated with better outcomes.
Key words: apoptosis, acute myeloid leukemia, autophagy
Significance of apoptosis and autophagy of leukemic blasts
for the outcomes of acute myeloid leukemia patients
Izabela Elżbieta Dereń-Wagemann
A–D, Kazimierz Kuliczkowski
A,C,E,FDepartment of Hematology, Blood Cancers and Bone Marrow Transplantation, University Hospital No. 1, Wrocław, Poland
A – research concept and design; B – collection and/or assembly of data; C – data analysis and interpretation; D – writing the article; E – critical revision of the article; F – final approval of the article
Introduction
The results of several studies have shown that chemo-therapeutic drugs can induce non-apoptotic types of can-cer cell death. These processes include autophagy, mitotic catastrophe and necrosis as well as ageing.1–4
Apoptosis is a programmed cell death, which under phys-iological conditions makes it possible to maintain tissue homeostasis, both in embryonic development and in adult life, by preserving a sufficient number of cells in the de-veloping organism and by eliminating abnormal damaged cells. It is involved in the tissue regeneration process, but also in the organ involution process (thymus atrophy).5–7
The induction of apoptosis can occur under the influence of intrinsic factors (derived from other cells) or extrinsic factors, such as ultraviolet radiation, ionizing radiation, high temperature, cytostatics, and free radicals.8–10
Autophagy, unlike other processes, does not always lead to cell death. It may be one of the mechanisms of cancer cell death, but on the other hand, it can be an adaptive process that allows the survival of tumor cells under stressful condi-tions, such as the use of cytostatics. In such situacondi-tions, it can allow cells to adapt to stressors and is a survival strategy for them. There are few reports on the role of autophagy in the treatment of acute leukemia. It seems that autophagy is the most common mechanism of cancer cell proliferation through generating resistance to the chemotherapy. The re-sults of the studies are ambiguous – some point to its cyto-protective role for leukemia cells, while others show its anti-tumor role. At present, we can observe constant attempts to investigate the effects of modifying autophagy in various types of cancers, including hematologic malignancies.11–15
The few reports on the role of apoptosis and autophagy in the treatment of patients with acute myeloid leukemia (AML) prompted us to investigate their role in the induc-tion therapy.
This study investigated the percentage of early and late apoptotic cells. Autophagy was measured with the expression of the products of 2 important genes (ATG5 and MAP1LC3B) – ATG5 and LC3B proteins.16 The ATG5 protein is the part
of the ATG12-ATG5-ATG16L complex, which is essen-tial for the phagophore elongation. The oligomerization of this complex causes the lengthening of the phagophore. In the next stage, the phagophore closes, which leads to the formation of the autophagosome.
The autophagosome closes the part of the cytoplasm with components to be digested. During the autophagosome for-mation, the LC3 protein undergoes a lipid-mediated transfor-mation of the cytosolic form (LC3-I form), thereby producing a lipid form (LC3-II), which is equivalent to the production of autophagosomes in the cell, and the expression of this pro-tein reflects the number of produced autophagosomes.17–20
Thus, it was investigated whether cytostatic treatment activated the transcription of both genes as well as the post-translational transformation of the LC3B protein, required for the production of autophagosomes.
Objectives
The primary objective of the study was to investigate the predictive and prognostic significance of the autophagy and apoptosis of blast cells in patients with AML – before and 12–24 h after the start of the induction therapy. In this study, we attempted to determine the potential differenc-es in the percentage of apoptotic cells and the exprdifferenc-ession of markers such as ATG5, MAP1LC3, LC3-IB, and LC3-IIB measured before (spontaneous apoptosis) and after the start of the treatment, depending on the response to the ther-apy. The study also investigated the correlation between the percentage of apoptotic cells, the level of expression of the MAP1LC3 and ATG5 genes before and after the start of the induction therapy, and overall survival (OS).
Material and methods
Patients
In total, this study enrolled 38 patients with AML (20 men and 18 women): 29 patients with de novo diagnosis, 2 patients with AML relapse, and 7 with AML secondary to myelodys-plastic syndrome (MDS) or myeloproliferative disease (MPD). Depending on the remission status achieved after the in-duction therapy, 2 groups of patients were identified:
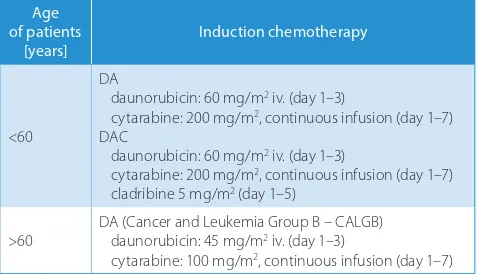
Group I: 20 patients (aged 18–67 years; median: 36 years) who achieved remission, including 18 patients with de novo diagnosis, 1 patient with a relapse (22 months after the completion of the treatment) and 1 with the blast crisis during MPD; the DAC (daunorubicin, cytosine arabinoside, cladribine) regimen was used in 8 patients and the DA (dau-norubicin, cytosine arabinoside) regimen in 12 patients, without a reduction in the scheduled doses (Table 1 sum-marizes the DAC and DA regimens);
Group II: 18 patients (aged 35–77 years; median: 55.5 years) who did not obtain remission after the induc-tion treatment, including 11 patients with de novo diag-nosis, 6 patients with AML secondary to MDS or MPD and 1 patient with a relapse 3 years after the completion
Table 1. Protocols of the induction chemotherapy used in patients with
acute myeloid leukemia (AML)
Age of patients
[years] Induction chemotherapy
<60
DA
daunorubicin: 60 mg/m2 iv. (day 1–3)
cytarabine: 200 mg/m2, continuous infusion (day 1–7)
DAC
daunorubicin: 60 mg/m2 iv. (day 1–3)
cytarabine: 200 mg/m2, continuous infusion (day 1–7)
cladribine 5 mg/m2 (day 1–5)
>60 DA (Cancer and Leukemia Group B – CALGB)daunorubicin: 45 mg/m2 iv. (day 1–3)
cytarabine: 100 mg/m2, continuous infusion (day 1–7)
of the maintenance treatment; the DA men was used in 17 patients and the DAC regi-men in 1 patient. In 5 patients, it was necessary to reduce the dose of the drugs for various rea-sons: old age (n = 2), pregnancy (n = 1), venous thrombosis (n = 1), and prevoius use of low doses of cytosine arabinoside (20 mg/m2 over
10 days) (n = 1).
In all patients, blood was collected before and 12–24 h after the start of the induction chemotherapy into 9-milliliter tubes to iso-late mononuclear cells. The data is presented in Tables 1–3.
Measurement of early
and late apoptosis
Simultaneous administration of propidium iodine (PI) and annexin makes it possible to distinguish between healthy cells and ne-crotic cells as well as early and late apoptotic cells. The percentage of mononuclear cells in early and late apoptosis and their viability was evaluated with flow cytometry before and 12–24 h after the start of the induction therapy with the use of the annexin V and PI (Becton Dickinson, Franklin Lakes, USA) binding assay. Half a million cells were in-cubated in 100 μL of the annexin V binding buffer (10 mM Hepes/NaOH, pH 7.4, 0.14 M NaCl, 2.5 mM CaCl2) with 5 μL of bound
annexin V-FITC (fluorescein isothiocya-nate) and 5 μL of PI at room temperature for 15 min. At the end of incubation 1 mL of the buffer was added and the cytometry analysis was performed (flow cytometer Partec PAS (Particle Analysing System), Partec GmbH, Münster, Germany). Next, the percentage of annexin V-binding cells corresponding to early apoptosis, not stained with PI, was measured. The annexin-binding and red-stained (PI) cells showed late apop-tosis. The total percentage of apoptotic cells was expressed as the sum of early apoptosis and late apoptosis.
Molecular studies
Ribonucleic acid isolation
Total ribonucleic acid (RNA) was isolated from the mononuclear cells obtained from the peripheral blood of patients diagnosed with AML, using the RNeasy® Mini Kit
(Qia-gen, Hilden, Germany) according to the man-ufacturer’s protocol. A 10 × 106 cell pellet was
Table 2. Clinical characteristics of patients with remission after the start of the induction therapy
Clinical characteristics of patients with remission after the start of the
induction therapy n M min max 25Q 75Q
AML de novo
AML secondary to MPD Recurrence of AML
18 1
1 –
Age [years] 20 36.0 18.0 67.0 26.0 56.5
Sex female male
9 11
–
FAB M0 M1 M2 M4 M5 M6
0 4 9 4 3 0
–
White blood cells [109/L] 20 47.4 4.7 225.6 19.4 134.1
Hemoglobin [g%] 20 9.60 6.40 14.10 8.65 10.70
Platelets [109/L] 20 44.5 17.0 292.0 30.0 89.0
Percentage of blasts in blood at diagnosis 16 85.0 7.0 96.0 37.0 89.5 Percentage of blasts in bone marrow
at diagnosis 20 76.0 25.0 93.0 49.0 87.0
Unfavorable cytogenetic or molecular
abnormalities 3 –
AML – acute myeloid leukemia; FAB – French-American-British classification; M – median; MPD – myeloproliferative disease; n – number of patients; 25Q – upper quartile; 75Q – lower quartile.
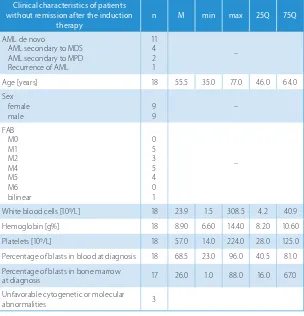
Table 3. Clinical characteristics of patients without remission after the induction therapy
Clinical characteristics of patients without remission after the induction
therapy n M min max 25Q 75Q
AML de novo
AML secondary to MDS AML secondary to MPD Recurrence of AML
11 4 2 1
–
Age [years] 18 55.5 35.0 77.0 46.0 64.0
Sex female
male 99 –
FAB M0 M1 M2 M4 M5 M6 bilinear
0 5 3 5 4 0 1
–
White blood cells [109/L] 18 23.9 1.5 308.5 4.2 40.9
Hemoglobin [g%] 18 8.90 6.60 14.40 8.20 10.60
Platelets [109/L] 18 57.0 14.0 224.0 28.0 125.0
Percentage of blasts in blood at diagnosis 18 68.5 23.0 96.0 40.5 81.0 Percentage of blasts in bone marrow
at diagnosis 17 26.0 1.0 88.0 16.0 67.0
Unfavorable cytogenetic or molecular
abnormalities 3
lysed in 600 μL of the RLT buffer with the addition of 1 μL of 6-mercaptoethanol and homogenized by passaging sev-eral times through a syringe needle. After centrifugation (3 min, 13,400 rpm), the supernatant was transferred into new Eppendorf tubes. One volume of 70% ethanol was added to the supernatant and the sample was thoroughly mixed. The obtained solution was applied in 700-μL ali-quots on a nucleic acid-binding silica column, mounted in 2-mL tubes, followed by rinsing with high ionic strength buffers supplied by the manufacturer, and rotating for 15 s, 10,000 rpm. The bound RNA was eluted into fresh tubes collecting RNase-free water with a volume of 30 μL (1 min, 10,000 rpm).
Reverse transcription
Complementary deoxyribonucleic acid (cDNA) was ob-tained on the matrix of the isolated RNA, using the High Capacity cDNA Reverse Transcript Kit (Applied Biosys-tems, Foster City, USA) as recommended by the manu-facturer. The reaction was performed at 37°C for 120 min in a DNA Engine® Peltier Thermal Cycler (Bio-Rad
Labo-ratories, Inc., Hercules, USA). Reverse transcriptase was thermally inactivated by heating the samples at 85°C for 5 min. The obtained cDNA was stored at −20°C until poly-merase chain reaction (PCR) was performed.
Real-time polymerase chain reaction
We assessed the expression of the ATG5 and MAP1LC3
genes with the use of real-time quantitative PCR (RQ-PCR). The primers and probes of Life Technologies (Carlsbad, USA), TaqMan® Real-Time PCR Assay, Hs00169468_m1 and
Hs99999908_m1 were used for MAP1LC3 and β-glucuronidase reference gene (GUSB), respectively. The reaction was per-formed in a Universal Master Mix (Life Technologies) on a 7500 Real-Time PCR System from Applied Biosys-tems. We used the following universal protocol: 45 cycles of 95°C for 15 s, 60°C for 1 min, with previous incubation at 50°C for 2 min, and 95°C for 10 min (the polymerase activation). Each assay was repeated 3 times. For each assay, the difference Ct was determined for the test and reference genes (ΔCt), and 2-ΔCt was calculated. The value obtained
was the measure of the expression of the test gene.
Western blot
Preparation of cell lysates
The cell lysis was performed at 4°C for 30 min after the suspension of the cell pellet in 60 μL of radioimmuno-precipitation assay (RIPA) lysis buffer supplemented with 1mM of phenylmethanesulfonyl fluoride (PMSF) (Sigma-Aldrich, St. Louis, USA). Then, the samples were centri-fuged at 4°C for 10 min at 8000 × g and the supernatant was transferred into new tubes. After adding a sufficient
quantity of the loading buffer (4 times concentrated), the samples were denatured by placing them in a boiling water bath for 5 min.
Electrophoresis of proteins in denaturing conditions (sodium dodecyl sulfate–polyacrylamide gel electrophoresis – SDS-PAGE)
After the denaturation in a boiling water bath, the pro-tein samples were briefly centrifuged and then placed into 15% polyacrylamide gel wells. The quantity of lysate in the gel well corresponded to 40 μg of protein. The sep-aration was held in the electrophoresis buffer, initially at 80 V and in the later phase at 110 V. The electrophoresis was conducted for approx. 2 h and was terminated when the loading buffer reached the lower gel layer.
Detection of the LC3-I and LC3-II proteins using western blot
Upon completion of gel electrophoresis, the gel protein was transferred to the nitrocellulose membrane by elec-troblocking. The transfer was carried out in the electro-lytic buffer at 350 mA for 60 min. After the blocking step (1 h at room temperature) in a 5% solution of skimmed milk in TBST (tris-buffered saline, Tween 20) (Sigma-Al-drich), the membrane was incubated with mouse mono-clonal antibody against human protein LC3B (MB-M186-3 anti-LC3; MBL International Corporation, Woburn, USA) in TBST with 0.5% skimmed milk. After overnight incuba-tion at 4°C, the membrane was washed 4 times with TBST at room temperature and then incubated with second-ary antibodies against Fc fragment of murine immuno-globulin G (IgG) conjugated with horseradish peroxidase (Dako A/S, Glostrup, Denmark), dissolved in TBST with 0.5% skimmed milk. After 4-fold membrane rinsing with TBST, the protein bands, bound by the antibody con-jugated to the enzyme, were detected using the chemi-luminescence assay. For this purpose, the West Femto Chemiluminescent Substrate (Thermo Fisher Scientific, Waltham, USA) reagent was used. This reagent contains luminol, which, under the influence of horseradish per-oxidase, emits light. The solution of this reagent, prepared according to the manufacturer’s instructions, was spot on the membrane and then the membrane was inserted into the plastic foil. After exposure to photographic film, the film was developed using the reagents Kodak® GBX
developer and Kodak GBX fixer (Sigma-Aldrich).
peroxidase. The detection of chemiluminescence after spotting the substrate for horseradish peroxidase was similar to that of LC3. The LC3-II protein migrates faster than LC3-I in western blot.
Due to the differences in the migration rates of the LC3-I (18 kD) and LC3-II (16 kD) proteins, 2 separate bands were obtained in the western blot procedure.
Statistical methods
In each group, the median values (M), range (min–max), and lower and upper quartiles (25Q–75Q) of the continuous parameters were calculated. Statistical significance between the means for different groups was calculated with the non-parametrical Mann–Whitney U test, because the number of cases in the control group was small and the variances in the groups were not homogeneous (the homogeneity of variance was determined with Bartlett’s test). Statistical significance between the means for dependent groups was calculated with the non-parametrical Wilcoxon parity test, because the number of cases in the control group was small and the variances in groups were not homogeneous (the ho-mogeneity of variance was determined with Bartlett’s test). Since the expected value in the cell was below 5, the Fisher test was used for discrete parameters to analyze the inci-dence of features in the study groups.
For the chosen pairs of parameters, a correlation analy-sis was performed and Pearson’s correlation factor r was calculated. The p-value ≤0.05 was considered statistically significant.
Results
Evaluation of the total percentage
of apoptotic cells (in the early and late
apoptotic phase) determined 12–24 h
after the start of the induction therapy,
depending on the remission status
A statistically significant intergroup difference was found in the total percentage of apoptotic cells (in the early and late apoptotic phase) after the start of the induction therapy between the non-remission (n = 18) and remission (n = 20) groups (p = 0.0078). In the remission group, the overall
percentage of apoptotic cells after the start of the induction treatment was higher compared to non-remission patients. The data is presented in Table 4 and Fig. 1.
Comparison of the total percentage
of apoptotic cells (in the early and
late apoptotic phase) in patients
with remission, before and after the start
of the induction therapy
After the start of the induction therapy, a statistically sig-nificant increase in the total percentage of apoptotic cells (in the early and late apoptotic phase) was observed in the re-mission group compared to the values before treatment (p = 0.00059). The data is presented in Table 5 and Fig. 2.
Comparison of the MAP1LC3 protein
expression in the remission group
before and after the start of the induction
therapy
In the remission group, the comparison of the MAP1LC3 protein expression before and after the start of the induc-tion therapy demonstrated an increasing trend, although without statistical significance (p = 0.0930). The data is presented in Table 6 and Fig. 3.
Fig. 1. Total percentage of apoptotic cells (in the early and late
apoptotic phases) determined after the induction therapy, depending on the remission status
median 25–75% min-max
NR CR
0 10 20 30 40 50 60 70
to
ta
l ap
op
totic
ce
ll perc
entage
(in
ea
rly an
d late ap
op
totic phas
e)
p = 0.0078
Table 4. Total percentage of apoptotic cells in the early and late apoptotic phases, determined after the induction therapy, depending on the remission status
Total percentage of apoptotic cells in the early
and late apoptotic phases after induction therapy of patientsGroup M min max 25Q 75Q p-value*
Percentage of apoptotic cells in the early and late apoptotic phases after the induction therapy
I
(n = 18) 7.86 0.82 23.66 4.27 12.91
0.0078 Percentage of apoptotic cells in the early and late
apoptotic phases after the induction therapy (n = 20)II 26.3 0.8 62.2 6.7 47.4
Results of the LC3-I and LC3-II protein
expression assay performed with the use
of the western blot procedure
In the remission group, cell pellets were tested in 16 of 20 patients, while in the non-remission group in 16 of 18 subjects. This was due to the inability to obtain a sufficient number of mononuclear cells in the precipitate in some patients (patients with leukopenia at diagnosis).
The differences in the speed of the migration of the LC3-I and LC3-II proteins resulted in 2 separate bands in the western blot procedure. LC3-II (16 kD) mi-grates faster than LC3-I (18 kD). The level of the LC3-II protein directly correlates with the quantity of autophago-somes. In the remission and non-remission groups, differ-ences in the LC3-I and LC3-II expression before and after the start of the chemotherapy were not reported. The data is presented in Fig. 4.
Correlation between selected parameters
and overall survival of patients
The longer OS was related to the percentage of cells in the late stages of apoptosis and to the total percentage of apoptotic cells (in early and late apoptosis) after the start of the induction therapy. The data is presented in Table 7.
Discussion
This study investigated whether the percentage of apop-totic cells as well as the expression of selected autopha-gic markers in mononuclear populations, before and af-ter the start of the induction chemotherapy, may impact the therapeutic response in AML patients.
Table 6. Expression of the MAP1LC3 protein in patients with remission before and after the start of the induction therapy
Expression of the MAP1LC3 protein in patients with remission before and after the start of the induction therapy
Group
of patients M min max 25Q 75Q p-value*
Expression of the LC3 protein before the induction
chemotherapy (n = 20)I 0.115 0.033 9.872 0.058 0.498
0.0930 Expression of the LC3 protein after the induction chemotherapy I
(n = 20) 0.54 0.00 18.15 0.10 1.19
* Wilcoxon test; II – remission group of patients.
Table 5. Percentage of apoptotic cells in the early and late apoptotic phases, determined in patients with remission, before and after the start
of the induction therapy
Percentage of apoptotic cells in the early and late apoptotic phases, determined in patients with
remission, before and after the start of the induction therapy
Group
of patients M min max 25Q 75Q p-value*
Percentage of apoptotic cells in the early and late apoptotic phase before the induction therapy
I
(n = 20) 11.9 0.6 55.6 2.9 20.1
0.00059 Percentage of apoptotic cells in the early and late
apoptotic phase after the induction therapy (n = 20)I 26.3 0.8 62.2 6.7 47.4
* Wilcoxon test; II – remission group of patients.
Fig. 2. Total apoptotic cell percentage (the early and late apoptotic
phases) in the remission group before and after the start of the induction therapy
median 25–75% min-max
before after 0
10 20 30 40 50 60 70
to
ta
l ap
optoti
c
ce
ll
percen
ta
ge
(in
earl
y an
d la
te
ap
optoti
c
phas
e)
p = 0.00059
Fig. 3. Expression of the MAP1LC3 protein before and after the induction
therapy in patients with remission
median 25–75% min-max
before after -2
0 2 4 6 8 10 12 14 16 18 20
expression
of
MA
P1
LC3 pr
otei
n
A small number of reports confirm the importance of apoptosis as a prognostic factor in the treatment of acute leukemia. A study by Smith et al. demonstrat-ed that the percentage of blast cells in the spontaneous phase of apoptosis correlated with a good response fol-lowing an intravenous (iv.) cytarabine administration.21
The median proportion of blasts in the apoptosis phase in the blood of patients achieving complete remission (CR) after the treatment (after 24 h of culture) and in non-remis-sion (NCR) subjects was 19.5% (range: 3.6–64%) and 4.2% (range: 1.8–7.0%), respectively. This intergroup difference was statistically significant (p = 0.0007).21
Other reports have also pointed at the importance of apoptosis as a prognostic factor in the treatment of acute leukemia. Its role has been confirmed through the measurement of apoptosis markers, such as the pres-ence of Fas receptors and tumor necrosis factors (TNFs), the Smac/DIABLO expression levels, and the caspase-3 activity. It has been found that a loss of receptors for
ligands like Fas or TNF before the induction therapy re-sulted in resistance to daunorubicin-induced apoptosis of the test Jurkat or U937 cell lines.22 Other studies have
demonstrated that a higher expression of Smac/DIABLO is an independent predictor of greater overall remission and longer OS (p < 0.001 and p = 0.003, respectively), while a reduced caspase-3 activity correlated with resistance to apoptosis.23,24
The results of our study did not show any statistical-ly significant differences in the percentage of apoptotic cells before the induction therapy (cells in the spontane-ous phase of apoptosis), depending on the achievement of remission after the treatment. There are few studies on the effects of cytostatic treatment on apoptosis, re-garding its level before treatment and the remission status after therapy.21–24 One study examined mononuclear cells
isolated from the bone marrow of 31 patients diagnosed with de novo acute leukemia. The study demonstrated that the abovementioned cytostatics induced caspase-dependent apoptosis. Moreover, spontaneous apoptosis did not correlate with treatment-induced apoptosis, while induced apoptosis was significantly higher in patients who achieved CR after cytostatic treatment. Tests performed after the induction therapy showed that the percentage of cells in the apoptotic phase was significantly higher in those patients compared to the NCR group (p = 0.0130 and p = 0.0078, respectively).25
In our study, a significant increase in the percentage of apoptotic cells after the induction therapy in the re-mission group was crucial. However, the non-rein the re-mission group patients did not obtain such a result.
There are few reports on the role of autophagy in the treatment of acute leukemia, and the results of the available studies are ambiguous. Some point to its cytoprotective role for leukemia cells, while others show its anticancer role. Modification of the autophagy process can also influence the proliferation of leukemia cells.
Bosnjak et al. demonstrated that cytarabine used in leu-kemia test cell lines inhibited the mammalian target of ra-pamycin (mTOR) kinase phosphorylation by inhibiting AKT kinase, and thus stimulated autophagy.11 Adding
autophagy inhibitors such as bafilomycin or chloroquine stimulated the apoptosis of leukemia cells.11 This fact may
indicate the cytoprotective role of autophagy in leukemia cells. In another paper, treatment with daunorubicin in-duced autophagy by stimulating ERK1/2 kinase.12
The hibition of this process by the use of the chloroquine in-hibitor of the kinase and small interfering RNA (siRNA), which mute the expression of the ATG5 and ATG7 genes, reduced the viability of leukemia cells.12 This may also
indicate the cytoprotective role of autophagy in these cells. Palmeira dos Santos et al. showed that autophagy sup-pression may initially increase the antiproliferative effect of cytarabine on leukemia cells. After 24 h, however, this process may, quite to the contrary, promote the resistance of leukemia cells to treatment.13
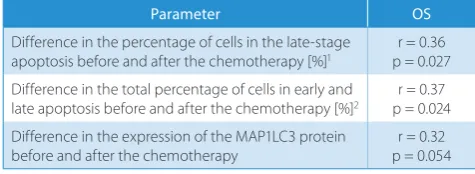
Table 7. Correlation between overall survival (OS) and selected
parameters
Parameter OS
Difference in the percentage of cells in the late-stage
apoptosis before and after the chemotherapy [%]1 p = 0.027r = 0.36
Difference in the total percentage of cells in early and
late apoptosis before and after the chemotherapy [%]2 p = 0.024r = 0.37
Difference in the expression of the MAP1LC3 protein before and after the chemotherapy
r = 0.32 p = 0.054
1 cell percentage in the late-stage apoptosis after the chemotherapy −
percentage of cells in the late apoptotic phase before the chemotherapy/ percentage of cells in the late apoptosis phase before the chemotherapy;
2 total percentage of cells in apoptosis after the chemotherapy − total
percentage of cells in apoptosis before the chemotherapy/percentage of cells in the late apoptosis phase before the chemotherapy.
Fig. 4. Expression of the LC3-I and LC3-II proteins in patients diagnosed
with acute myeloid leukemia (AML) determined with the western blot assay
One study evaluated the combination of daunorubicin and rapamycin in the therapy of patients with acute lym-phoblastic leukemia (Ph+).14 The synergistic effect
of inhib-iting the leukemia cell proliferation while using the above-mentioned drugs was associated with mTOR blockade, autophagy increase and cell cycle arrest in the G1 phase.14
In mice implanted with myeloblasts, Willems et al. demon-strated that the inhibition of the mTORC1 and mTORC2 complex improved survival by reducing the tumor mass without generating visible toxicity effects.15 The inhibitor
stimulated apoptosis in leukemic cells without inducing that effect in normal immature CD34+ cells, and also in-tensively stimulated autophagy.15
In our studies, the expression of the ATG5 and MAP1LC3 proteins showed no intergroup difference, both before and after the treatment between the remission and non-remission groups. In the remission group, however, an upward trend in the expression of the MAP1LC3 pro-tein after the start of the induction therapy is noteworthy (p = 0.0930).
Moreover, we did not observe any differences in the LC3-I and LC3-II protein expression, before and after the chemo-therapy, between the remission and non-remission groups. In the remission group, the observed that the increase in the MAP1LC3 expression after the start of the induction therapy was not associated with the change in the LC3-IB and LC3-IIB protein levels measured with western blot assay. It may, therefore, be suspected that the expression of the MAP1LC3 protein is further regulated by another factor, e.g., micro-ribonucleic acid (miRNA), which acts on the level of post-transcriptional regulation of gene ex-pression. In the remission group, the increased expression of the MAP1LC3 protein after the start of the treatment may indicate higher susceptibility of mononuclear cells to enter a pathway of autophagy. Nevertheless, the nega-tive factor acting at the level of post-transcriptional gene regulation eventually changes the course of this process.
Cytostatics used in the induction regimen potentially stimulate apoptosis, provided that an adequate supply of blasts to the chemotherapy is maintained. Blast cell sensitivity depends not only on cytogenetic prognosis, but also on the genesis of the disease (de novo vs secondary leukemia) and the intensity of the cytostatic treatment.
In our studies, longer OS was related to the percent-age of cells in the late stto the percent-ages of apoptosis and to the total percentage of apoptotic cells (in early and late apoptosis) after the start of the induction therapy.
Conclusions
Our results indicate that patients with a good therapeu-tic response experience more intense cytostatherapeu-tic-induced apoptosis compared to non-remission subjects. Following the above, it is concluded that apoptosis disturbances are one of the causes of chemotherapy failure.
Based on the presented results, we can assume that apoptosis activity is a useful indicator of good progno-sis in AML. At present, we need further studies to con-firm the impact of autophagy on the therapeutic response of AML patients, to evaluate the possibility of modifica-tion of this process and to assess the effect of this change on patients’ response.
References
1. Stępień A, Izdebska M, Grzanka A. Rodzaje śmierci komórki. Postepy
Hig Med Dosw. 2007;61:420–428.
2. Roninson IB, Broude EV, Chang BD. If not apoptosis, then what? Treat-ment-induced senescence and mitotic catastrophe in tumor cells. Drug Resist Updat. 2001;4(5):303–313.
3. Kramer G, Erdal H, Mertens HJ, et al. Differentiation between cell death modes using measurements of different soluble forms
of extra-cellular cytokeratin 18. Cancer Res. 2004;64(5):1751–1756.
4. Eom YW, Kim MA, Park SS, et al. Two distinct modes of cell death induced by doxorubicin: Apoptosis and cell death through mitotic
catastrophe accompanied by senescence-like phenotype. Oncogene.
2005;24(30):4765–4777.
5. Bellany CO, Malcomson RD, Harrisin DJ, Wyllie AH. Cell death in health
and disease: The biology and regulation of apoptosis. Semin Cancer
Biol. 1995;6(1):3–16.
6. Yajima N, Sakamaki K, Yonehara S. Age‐related thymic involution
is mediated by Fas on thymic epithelial cells. Int Immunol. 2004 Jul;
16(7):1027–1035.
7. Wyllie A. Apoptosis and the regulation of cell numbers in normal
and neoplastic tissues: An overview. Cancer Metastasis Rev. 1992;11(2):
95–103.
8. Barni S, Pontiggia P, Bertone V, et al. Hyperthermia-induced cell death
by apoptosis in myeloma cells. Biomed Pharmacother. 2001;55(3):
170–173.
9. Di Pietro R, Secchiero P, Rana R, et al. Ionizing radiation sensitizes erythroleukemic cells but not normal erythroblasts to tumor necro-sis factor-related apoptonecro-sis-inducing ligand (TRAIL)-mediated
cyto-toxicity by selective up-regulation of TRAIL-R1. Blood. 2001;97(9):
2596–2603.
10. Nakao K, Otsuki Y, Akao Y, et al. The synergistic effects
of hyperther-mia and anticancer drugs on induction of apoptosis. Med Electron
Microsc. 2000;33(1):44–50.
11. Bosnjak M, Ristic B, Arsikin K, et al. Inhibition of mTOR-dependent autophagy sensitizes leukemic cells to cytarabine-induced
apoptot-ic death. PLoS One. 2014;8:9(4):e94374.
12. Han W, Sun J, Feng L, et al. Autophagy inhibition enhances
dauno-rubicin-induced apoptosis in K562 cells. PLoS One. 2011;6(12):
e28491.
13. Palmeira dos Santos C, Pereira GJ, Barbosa CM, Jurkiewicz A, Smaili SS, Bincoletto C. Comparative study of autophagy inhibition by 3MA and
CQ on cytarabine-induced death of leukaemia cells. J Cancer Res Clin
Oncol. 2014;140(6):909–920.
14. Yang X, Lin J, Gong Y, et al. Antileukaemia effect of rapamycin alone or in combination with daunorubicin on Ph+ acute lymphoblastic
leukaemia cell line. Hematol Oncol. 2012;30(3):123–130.
15. Willems L, Chapuis N, Puissant A, et al. The dual mTORC1 and mTORC2 inhibitor AZD8055 has anti-tumor activity in acute myeloid leukemia. Leukemia. 2012;26(6):1195–1202.
16. Tanida I. Autophagosome formation and molecular mechanism
of autophagy. Antioxid Redox Signal. 2011;14(1):2201–2214.
17. Glick D, Barth S, Macleod KF. Autophagy: Cellular and molecular
mechanisms. J Pathol. 2010;221(1):3–12.
18. Klionsky DJ. Autophagy: From phenomenology to molecular
under-standing in less than a decade. Nat Rev Mol Cell Biol. 2007;8(11):
931–937.
19. Towler MC, Hardie DG. AMP-activated protein kinase in metabolic
control and insulin signaling. Circ Res. 2007;100(3):328–341.
20. Wysokińska E, Kałas W. Metody badania autofagii oparte na
przem-ianach białek MAP1LC3 i p62/SQSTM1. Postepy Hig Med Dosw. 2013;
21. Smith BD, Bambach BJ, Vala MS, et al. Inhibited apoptosis and drug
resistance in acute myeloid leukaemia. Br J Haematol. 1998;102(4):
1042–1049.
22. Martinez-Lorenzo MJ, Gamen S, Etxeberria J, et al. Resistance to apop-tosis correlates with a highly proliferative phenotype and loss of Fas
and CPP32 (caspase-3) expression in human leukemia cells. Int J Cancer.
1998;75(3):473–481.
23. Pluta A, Wrzesien-Kus A, Cebula-Obrzut B, et al. Influence of high expression of Smac/DIABLO protein on the clinical outcome inacute
myeloid leukemia patients. Leuk Res. 2010;34(10):1308–1313.
24. Oliver L, Vavasseur F, Mahé B, et al. Assessment of caspase activity
as a possible prognostic factor in acute myeloid leukaemia. Br
J Hae-matol. 2002;118(2):434–437.
25. Belaud-Rotureau MA, Durrieu F, Labroille G, et al. Study of apopto-sis-related responses of leukemic blast cells to in vitro anthracycline