Dr. Jayaprakasam. R, M.Pharm, Ph.D., Assistant Professor,
Department of Pharmaceutical Analysis, College of Pharmacy,
Sri Ramakrishna Institute of Paramedical Sciences, Coimbatore -641 044, India
Email: [email protected]
Address for correspondence
Access this article online www.japer.in
Development of validated analytical methods for the
simultaneous estimation of biomarkers in the leaves of
Barleria
cristata
and bio analysis of the selected marker in plasma
INTRODUCTION
Herbal Medicine is the oldest form of medicine known to mankind. It was the mainstay of many early civilizations and even today the most widely practiced form of medicine in the world according to World Health Organization figures. [1]
Herbal medicine is still the mainstay of about 75 - 80% of the world population, particularly in the developing countries, for primary health care. According to the World Health Organization (WHO), the use of herbal remedies throughout the world exceeds that of the conventional drugs by two to three times. [2]
Nature provides a medicine cabinet full of extraordinary herbs and flowers, which form the basis for many modern medicines.
The herbalists believe that the sum of the action of the whole plant is more balanced than that of any one of
its main constituents. However, it should be borne in mind that plant remedies are very powerful and can be dangerous if prescribed dosages are exceeded. Continuous and unconditional intake of herbal medicines by world population indicates their safety and efficacy. [4]
In the present study an attempt is made to develop HPTLC and HPLC methods for the simultaneous analysis of the respective active constituents present in the plant extract using standard markers and also to carry out the bio analytical estimation of selected marker in human plasma.
MATERIALS AND METHODS
Chemicals:
Quercetin, apigenin and naringenin were purchased from Sigma Aldrich, India. AR/HPLC grade methanol, acetonitrile, sulphuric acid, lead acetate, water, petroleum ether, ethyl acetate, chloroform, diethyl ether, formic acid and potassium dihydrogen phosphate were supplied by S. D. Fine Chemicals Ltd., and Merck Pvt. Ltd., Mumbai.
INSTRUMENTS:
The analysis was performed on the Camag HPTLC system with Linomat 5 applicator, Camag TLC scanner 3 and WinCATS software. Shimadzu HPLC system with
Research ResearchResearch
Research ArticleArticleArticleArticle
Two simple accurate and economical HPTLC and RP-HPLC methods were developed for the simultaneous estimation of biomarkers in Barleria cristata and bio analysis of the selected marker in plasma was also carried out. The successive extraction of leaves of Barleria cristata was carried out by using soxhlet apparartus. In the case of standardization as well as bioanalysis by HPTLC, the separation was achieved by using methanol: ethyl acetate: toluene: formic acid (1:1: 7.5: 0.2 %v/v/v/v) as the mobile phase. The detection was made at 308nm. In the case of RP-HPLC, the separation was achieved by using potassium dihydrogen phosphate buffer : methanol (30:70%v/v) and the detection wavelength used was 330nm. The proposed methods were validated as per ICH guidelines and the bio analytical method was validated as per USFDA guidelines. The methods were accurate, precise and rapid and found to be suitable for the quantitative analysis of plants and formulation containing phytochemical markers.
Keywords: Barleria cristata, HPTLC, RP-HPLC, Bioanalytical estimation
ABSTRACT ABSTRACT ABSTRACT ABSTRACT
Jayaprakasam Rajendran*,
Liji Jacob, RaviThengungal Kochupappy
Department of Pharmaceutical Analysis, College of Pharmacy, Sri Ramakrishna Institute of Paramedical Sciences, New siddhapudur, Coimbatore-641044, Tamil Nadu, India.
J. Adv. Pharm. Edu. & Res.
409
LC AT10 VP Pump, SPD M 10 AT VP Detector and CLASS M 10A software. Jasco V-560 UV/Vis-Spectrophotometer.
METHODS
Collection of the plant:
The plant material collected was confirmed as Barleria cristata by Dr. C. Kunhikannan, Scientist E, Biodiversity division, Institute of Forest Genetics and Tree Breeding, Coimbatore, Tamil Nadu, India.
Extraction:
The leaves of Barleria cristata were ground well for the extraction process which was carried out for a period of 3 days for 100g of the powdered drug. It was done by continuous hot percolation method using soxhlet apparatus successively using solvents of increasing polarity such as petroleum ether, chloroform and methanol. Volume of solvent used was 1000ml.
HPTLC method
The optimized solvent system used for the separation of active markers quercetin, apigenin and naringenin present in the extracts of plant was methanol: ethyl acetate: toluene: formic acid (1:1: 7.5: 0.2 %v/v/v/v). The stationary phase was pre-coated plates containing silica gel 60F254 on aluminium sheets and detection was done at 308nm.
a) Preparation of standard stock solution of
markers
Quercetin:
A solution of quercetin with a concentration of 1000µg/ml was obtained by transferring 50mg of quercetin into a 50ml standard flask and dissolving it in a small quantity of methanol and making up the volume to 50ml with methanol.
Apigenin:
10mg of apigenin was transferred into 10ml standard flask, dissolved in a small quantity of methanol and the volume was made up to 10ml with methanol to get a concentration of 1000µg/ml.
Naringenin:
50mg of naringenin was taken in a 50ml standard flask and dissolved in a small quantity of methanol and sufficient quantity of methanol was added to make up the volume to 50ml to get a concentration of 1000µg/ml.
Marker mixture:
From the stock solution of individual markers, 10ml of quercetin solution, 1ml of apigenin solution and 5ml of naringenin solution were transferred into a 100ml standard flask and the volume was made up with methanol to get a concentration of 100µg/ml, 10µg/ml and 50µg/ml of quercetin, apigenin and naringenin respectively.
Validation of HPTLC method
The validation of the developed method was carried out as per ICH guidelines in terms of linearity, limit of detection (LOD), limit of quantification (LOQ), inter and intraday precision, repeatability of sample application and measurement and stability studies. Standard chromatograms are shown in Fig. 1 and are tabulated in table. 1.
Analysis of Barleria cristata extracts
Preparation of stock solution of the petroleum
ether extract of the leaves of Barleria cristata
10mg of the extract was weighed, placed in a 10ml standard flask and dissolved in a small quantity of petroleum ether. The volume was made up to 10ml to get a concentration of 1000µg/ml solution. The solution was filtered through Whatmann filter paper. 10µl/spot of the filtrate was applied on the TLC plate. Preparation of stock solution of the chloroform
extract of the leaves of Barleria cristata
10mg of the extract was weighed, placed in a 10ml standard flask and dissolved in a small quantity of chloroform. Then the volume was made up to 10ml with chloroform to get a concentration of 1000µg/ml solution and the solution was filtered through Whatmann filter paper. 10µl/spot of the filtrate was applied on the TLC plate.
Preparation of stock solution of the methanol
extract of the leaves of Barleria cristata
10mg of the extract was weighed, placed in a 10ml standard flask and dissolved in a small quantity of methanol. Then the volume was made up to 10ml with methanol to get a concentration of 1000µg/ml solution and the solution was filtered through Whatmann filter paper. 10µl/spot of the filtrate was applied on the TLC plate.
Recording of the chromatogram
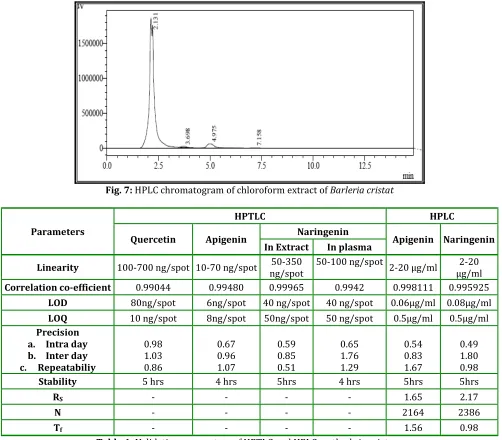
Peak areas of the chromatograms of the extracts were compared with that of standard chromatograms (Fig. 2-4) and the amount present was calculated and tabulated in table 2.
Estimation of naringenin in plasma
The above developed validated HPTLC method was utilized for the estimation of naringenin from plasma. Selection of internal standard
On the basis of polarity and solubility different drugs like quercetin and apigenin were tried. The peak of apigenin was well resolved from naringenin peak and had good peak shape. Hence, apigenin was selected as the internal standard.
Fixed extraction procedure
Naringenin and apigenin drug solutions were taken in centrifuge tubes, 0.25ml of plasma was added and vortexed for about 60 seconds. To this 2ml of methanol was added and centrifuged at 3000 rpm for 5 minutes. The supernatent layer was separated and transferred into test tubes. From these 10µl lots were spotted on pre-coated TLC plate.
Preparation of calibration graph
Series of aliquots of naringenin solutions of 10, 20 40, 60, 80, 100 and 120µg/ml concentrations each containing apigenin 40µg/ml were prepared with methanol. To each of seven centrifuge tubes 1ml of above prepared solutions were transferred. To this 0.25ml of plasma was added, vortexed for 60 seconds and fixed extraction procedure was followed. From the separated supernatent layer 10µl was spotted. The final concentration was found to be in the range of 50 to 600ng/spot.
Validation of the method
The validation of the developed method was carried out as per USFDA guidelines in terms of linearity, limit of detection (LOD), limit of quantification (LOQ), inter and intraday precision, repeatability of sample application and measurement, stability, specificity and recovery. Standard chromatograms are shown in Fig. 5 and the values are tabulated in table. 1
RP-HPLC method
The optimized solvent system used for the separation of active markers apigenin and naringenin present in the extracts of the plant was potassium dihydrogen phosphate: methanol (30:70%v/v). The stationary phase was lichrosphere 100, RP 18e (5µm) column and detection was done at 330nm at a flow rate of 1ml/min.
Preparation of standard stock solution of markers
5mg of apigenin and 5mg of naringenin were weighed accurately and dissolved together in sufficient quantity of methanol to get a concentration of 100µg/ml.
Preparation of standard solutions
From the combined stock solution 0.2 to 2ml were transferred to 10ml standard flasks and the volume was made up with methanol to obtain a series of concentration ranging from 10 to 80µg/ml.
Validation of HPLC method
The validation of the developed method was carried out as per ICH guidelines in terms of linearity, limit of detection (LOD), limit of quantification (LOQ), inter and intraday precision, repeatability of injection, robustness, stability and system suitability studies. Standard chromatograms are shown in Fig. 6 and are tabulated in table. 1
Analysis of extract of the leaves of Barleria cristata
Preparation of sample solution for methanol
extract
10mg of methanol extract was weighed and dissolved in 10ml of methanol. The mixture was filtered through Whatmann filter paper to remove the solid particles. Recording of the chromatogram
leaves of Barleria cristata and bio analysis of the selected marker in plasma Drug
411
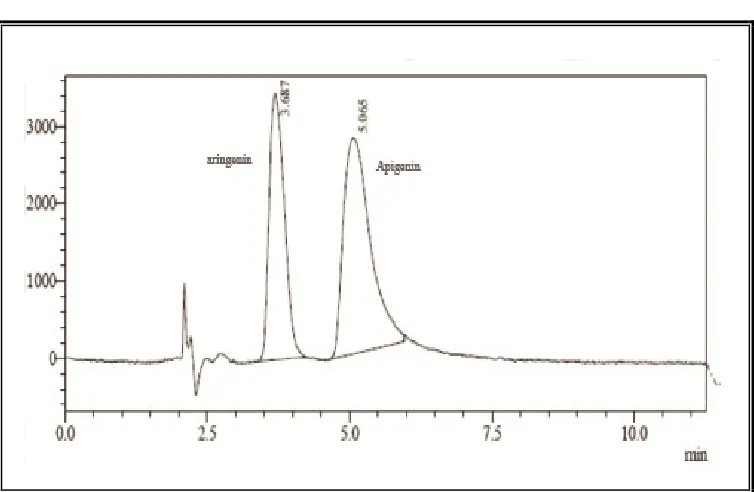
A steady baseline was recorded with the fixed chromatographic conditions. The extract was injected and the chromatogram was recorded (Fig. 7).
RESULTS AND DISCUSSION
The leaves of Barleria cristata contain significant amount of flavonoids like quercetin, apigenin, naringenin, which have pharmacological actions like antiarthritic, hepatoprotective, antiinflammatory, anticancer and antiasthmatic actions. Hence, this plant was selected for the present study.
The literature review on the studies of leaves of Barleria cristata suggested that till date, no analytical work has been reported for quercetin, apigenin and naringenin. Therefore quercetin, apigenin and naringenin were simultaneously estimated in the leaves of Barleria cristata in the present study. Successive extractions were carried out for the extraction of powdered leaves of Barleria cristata. Petroleum ether, chloroform and methanol were selected as suitable solvents for extracting the crude drug. The percentage yield of the various extracts were calculated and the methanol extract was found to give the highest yield of 26.2% .
A system comprising of methanol: ethyl acetate: toluene: formic acid (1:1: 7.5: 0.2 %v/v/v/v) was selected for the determination of quercetin, apigenin and naringenin by HPTLC. The system gave symmetric peaks with Rf values of 0.26, 0.32 and 0.46 for quercetin, apigenin, and naringenin respectively at the selected wavelendth of 308nm. Calibration curves were plotted for the mixture of querctin, apigenin and naringenin. The concentration range of 100 - 800ng/spot for quercetin, 10 - 80ng/spot for apigenin and 50 - 400ng/spot for naringenin was found to be linear (r = 0.99044 , 0.99480 and 0.99965 ). The validation parameters were carried out for marker mixture and they are tabulated (table. 32)
The HPTLC method developed was used for the estimation of naringenin in plasma using apigenin as internal standard. To extract the naringenin from plasma, methanol was chosen as it gave the maximum
After extraction the separated supernatant layer was spotted on TLC plates. A set of solutions were spiked into plasma and chromatographed. The blank plasma was also chromatographed and this showed that there was no interference.
Calibration graph was plotted between concentration and peak area of the standards. The linearity were found to be in the range of 50 -600ng/spot for naringenin. The slope, intercept and correlation co-efficient values were found to be 4.737, 190.177 and 0.99427 respectively.
The blank plasma did not show any peak at the Rf values of naringenin. This showed the selectivity of the method. The drug was found to be stable for 4hrs under room temperature and 24 hrs under refrigeration temperature. The results have shown that precision are within their USFDA guidelines limitation.
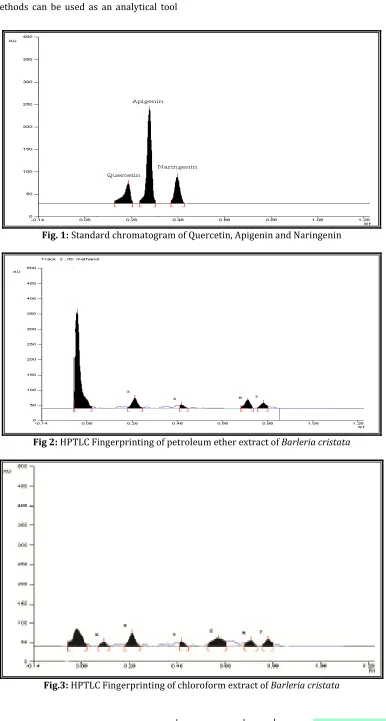
In RP - HPLC method, a mobile phase system consisting of potassium dihydrogen phosphate buffer: methanol (30:70%v/v) was employed for the detemination of apigenin and naringenin because this system gave symmetric peak shape and minimum of tailing with retention time of 3.7 and 5.1 minutes. Linearity for the mixture of apigenin and naringenin was found over the range of 2-10µg/ml (r = 0.998111 and 0.995925) showing good correlation between concentration and peak area response. The validation parameters were carried out for marker mixture and they are tabulated (table. 1).
CONCLUSION
Investigation, standardization and bio analytical estimation of Barleria cristata were carried out in the present work. The leaves of Barleria cristata contains significant amount of flavonoids, which is responsible for the main pharmacological actions. Therefore, the leaves were selected for the presesnt work. The tests for the presence of active constituents such as quercetin, apigenin and naringenin were carried out for Barleria crisata and further confirmed with the respective markers. Their quantification in the extract
Bioanalytical estimation of selected marker in plasma was carried out by HPTLC method. Proposed HPTLC and HPLC methods can be used as an analytical tool
for quality evaluation of plants and formulation containing phytochemical markers.
Fig. 1: Standard chromatogram of Quercetin, Apigenin and Naringenin
Fig 2: HPTLC Fingerprinting of petroleum ether extract of Barleria cristata
Fig.3: HPTLC Fingerprinting of chloroform extract of Barleria cristata
leaves of Barleria cristata and bio analysis of the selected marker in plasma Drug
413
Fig.4: HPTLC Fingerprinting of methanol extract of Barleria cristata
Fig. 5: HPTLC chromatograms of standard naringenin and apigenin
Fig. 6: HPLC chromatogram of naringenin and apigenin
Fig. 7: HPLC chromatogram of chloroform extract of Barleria cristat
Parameters
HPTLC HPLC
Quercetin Apigenin Naringenin Apigenin Naringenin
In Extract In plasma
Linearity 100-700 ng/spot 10-70 ng/spot 50-350 ng/spot
50-100 ng/spot
2-20 µg/ml 2-20 µg/ml Correlation co-efficient 0.99044 0.99480 0.99965 0.9942 0.998111 0.995925
LOD 80ng/spot 6ng/spot 40 ng/spot 40 ng/spot 0.06µg/ml 0.08µg/ml LOQ 10 ng/spot 8ng/spot 50ng/spot 50 ng/spot 0.5µg/ml 0.5µg/ml Precision
a. Intra day b. Inter day c. Repeatabiliy
0.98 1.03 0.86
0.67 0.96 1.07
0.59 0.85 0.51
0.65 1.76 1.29
0.54 0.83 1.67
0.49 1.80 0.98
Stability 5 hrs 4 hrs 5hrs 4 hrs 5hrs 5hrs
RS - - - - 1.65 2.17
N - - - - 2164 2386
Tf - - - - 1.56 0.98
Table 1: Validation parameters of HPTLC and HPLC methods in mixture
ACKNOWLEDGEMENT
The authors are thankful to SNR Sons Charitable Trust, Coimbatore-641044, Tamil Nadu, India for providing adequate facilities in our institution for carrying out this work.
REFERENCES
1. Pal S.K., Shukla Y. Herbal Medicine: Current Status
and the Future. Asian Pacific J Cancer Prev. 2003;
4: 281-288.
2. Bele A. A., Khale A. Standardisation of herbal drugs:
An overview. IRJP. 2011; 2(12): 56-60
3. Ekka N, R., Namdeo K. P, Samal P.K. Standardization
Strategies for Herbal Drugs-An Overview. Research J
Pharm. and Tech. 2008; 1(4): 310-312.
4. Rasheed A., Reddy S., Roja C. A Review on
Standardisation of Herbal Formulation. Inte J of
Phytotherapy. 2012; 2(2):74-88.
5. Sharma B.K. Instrumental methods of chemical
analysis. 18th ed. Meerut: Krishna Prakashan media
Pvt. Ltd; 1999 p S10-S30.
6. Beckett A.H., Stenlake J.B. Practical pharmaceutical
chemistry. 4th ed. Vol ΙΙ. New Delhi: CBS publishers
and distributors; 2005. p. 1-7, 275-277, 284- 298.
7. Sharma YR. Elementary organic spectroscopy. 4th ed.
New Delhi: S Chand and company Ltd; 2007. p.
15-20.
8. Skoog D A, Holler J F, Nieman TA. Principles of
instrumental analysis. 5th ed. Singapore: Thomson
learning Inc; 1998. p. 110- 300.
9. Willard HL, Dean JA, Settle FA. Instrumental method
of analysis. 7th ed. New Delhi: CBS publishers and
distributors; 1986. p. 60- 75, 600-680.
leaves of Barleria cristata and bio analysis of the selected marker in plasma Drug
415
10. Mendham J, Denney R, Barnis JD, Thomas MJ. Vogel’s
text book of quantitative chemical analysis. 6th ed.
New Delhi: Pearson education; 2003. p. 1-11,
251-261, 676.
11. Munson JW. Modern methods of Pharmaceutical
analysis,. Part A. Mumbai: International medical
book distributors;2001.p.230-231, 239-262.
12. Food and Drug Administration, guidance for industry
Bioanalytical method
validation.2001,www.fda.gov/cv m
13. Murugan S, Pravallika N, Sirisha P, Chandrakala K.A
review on bioanalytical method development and
validation by using LC-MS/MS. JCPS. 2013; 6 (1):
41-45.
14. The Wealth of India. A dictionary of Indian raw
materials and industrial products, vol-2:B.
Publications and information directorate, CSIR, New
Delhi. 2004: p. 47.
15. Chopra RN. Indian material medica, vol-1, 3rd edition.
Popular Prakasham. Mumbai. p. 12-15.
16. www.en.wikipedia.org/wiki/quercetin, www. en.
wikipedia.org/wiki/apigenin, www.en. wikipedia.
org/wiki/naringenin.
How to cite this article: Jayaprakasam Rajendran*, Liji
Jacob, Ravi Thengungal Kochupappy; Development of
validated analytical methods for the simultaneous
estimation of biomarkers in the leaves of Barleria cristata
and bio analysis of the selected marker in plasma; J. Adv. Pharm. Edu. & Res. 2014: 4(4): 409-416.
Source of Support: Nil, Conflict of Interest: Nil