R E S E A R C H
Open Access
Magnetic resonance imaging in
categorization of ovarian epithelial cancer
and survival analysis with focus on
apparent diffusion coefficient value:
correlation with Ki-67 expression and
serum cancer antigen-125 level
Guofu Zhang
1†, Weigen Yao
2†, Taotao Sun
3, Xuefen Liu
1, Peng Zhang
1, Jun Jin
4, Yu Bai
5, Keqin Hua
6and
He Zhang
1*Abstract
Background:To determine whether magnetic resonance (MR) imaging features combined with apparent diffusion coefficient (ADC)values could be used as a tool for categorizing ovarian epithelial cancer (OEC) and predicting survival, as well as correlating with laboratory tests (serum cancer antigen 125, serum CA-125) and tumor proliferative index (Ki-67 expression).
Methods and materials:MRI examination was undertaken before invasive procedures. MRI features were interpreted and recorded on the picture archive communication system (PACS). ADC measurements were manually performed on post-process workstation. Clinical characteristics were individually retrieved and recorded through the hospital information system (HIS). Cox hazard model was used to estimate the effects of both clinical and MRI features on overall survival.
Results:Both clinical and MRI features differed significantly between Type I and Type II cancer groups (p< 0.05). The mean ADC value was inversely correlated with Ki-67 expression in Type I cancer (ρ=−0.14,p< 0.05). A higher mean ADC value was more likely to suggest Type I ovarian cancer (Odds Ratio (OR) = 16.80, p< 0.01). Old age and an advanced International Federation of Gynecology and Obstetrics (FIGO) stage were significantly related to Type II ovarian cancer (OR = 0.22/0.02, p< 0.05). An advanced FIGO stage, solid components, and old age were significantly associated with poor survival (Hazard Ratio (HR) = 23.54/3.69/2.46, p< 0.05). Clear cell cancer type had a poorer survival than any other pathological subtypes of ovarian cancer (HR = 13.6, p < 0.01). Conclusions: MR imaging features combined with ADC value are helpful in categorizing OEC. ADC values can reflect tumor proliferative ability. A solid mass may predict poor prognosis for OEC patients.
Keywords: Ovarian epithelial cancer, Magnetic resonance imaging, Diffusion magnetic resonance imaging, Prognostic factor
© The Author(s). 2019Open AccessThis article is distributed under the terms of the Creative Commons Attribution 4.0 International License (http://creativecommons.org/licenses/by/4.0/), which permits unrestricted use, distribution, and reproduction in any medium, provided you give appropriate credit to the original author(s) and the source, provide a link to the Creative Commons license, and indicate if changes were made. The Creative Commons Public Domain Dedication waiver (http://creativecommons.org/publicdomain/zero/1.0/) applies to the data made available in this article, unless otherwise stated. * Correspondence:[email protected]
†Guofu Zhang and Weigen Yao contributed equally to this work. 1Department of Radiology, Obstetrics and Gynecology Hospital, Fudan University, Shanghai, People’s Republic of China
Background
Ovarian cancer is the most lethal disease in women’s gynecological malignancies [1]. In China, the latest epi-demiology survey disclosed that there were an estimated 52,100 newly diagnosed cases and 22,500 deaths in 2015, and the mortality has still been increasing over the past decade [2]. Ovarian epithelial cancer (OEC) accounts for more than 70% of all ovarian malignancies. Based on the histology and gene research, OEC is classified into two subtypes: Type I and Type II ovarian cancer. Type I can-cer includes low-grade endometrioid, mucinous, clear cell, and serous carcinomas. Type II cancer mainly com-prises of high-grade serous, endometrioid, undifferenti-ated carcinomas, and malignant mixed mesodermal tumors [3, 4]. Both Type I and Type II OEC subgroups have unique biological behaviors and treatment re-sponses [5]. Therefore, how to trigger patients into the right category before invasive procedure will help clini-cians to design individual therapy. Sonography is the first modality of choice in evaluating adnexal masses. However, for most of complicated cases, MR imaging is usually needed to determine tumor characteristics in most of tertiary medical centers [6]. In gynecological malignancies, an ADC value derived from diffusion weighted imaging (DWI) is generally lower than benign conditions [7–10]. Currently, CA-125 is considered an important biomarker for early detection and a prognos-tic tool for prediction of ovarian disease recurrence after treatment [11,12]. Ki-67 antigen is a marker of cell pro-liferation and a higher Ki-67 expression is associated with more aggressive disease and worse survival rates in OEC patients [13,14]. Owing to the advancement of im-aging techniques, imim-aging biomarkers have gradually gained attention for their potential application [15]. It has been reported that MRI parameters could be used to predict survival in cancer patients [16]. Nakamura et al. reported that the ADC value was an independent prognos-tic factor for disease-free survival after radical hysterectomy in patients with cervical cancer [17]. Until now, there has been limited literature reported for categorization and sur-vival analysis correlated with MRI features, especially with ADC measurements, for patients with both OEC subtypes. The purpose of this study was two folds: First, to clarify whether OEC MRI characteristics coupled with clinical markers (Ki-67 expression and serum CA-125 level) could be used as an index for differentiating between Type I and Type II OEC and second, to determine that some MRI fea-tures could be used as prognostic factors for predicting overall survival for OEC patients.
Methods Patients
Our institutional review board (Gynecological and Obstetric Hospital, School of Medicine, Fudan University, P.R.China)
approved this retrospective study, and the requirement for informed consent was waived for all participants. From January to December 2017, data from 438 patients who underwent MRI examination for clinically suspected gynecological disease were retrieved from our institutional patient archive communication system (PACS). The inclu-sion criteria included: 1) no previous pelvic surgery; 2) no previous gynecological disease history; and 3) MRI examina-tions before pelvic or laparoscopic surgery that was per-formed at our institution. The exclusion criteria were: 1) previous pelvic surgical history or radiation history; 2) MRI data was unavailable either as the examination was per-formed in another institution or from claustrophobia; and 3) no histological results. Finally, the total number of pa-tients in the studied sample was 250 (average age, 52.7 ± 12.3 years). The sample comprised 145 patients with Type I (24 cases of low-grade serous carcinomas, 17 endometroid carcinomas, 31 clear cell carcinomas, and 74 borderline ser-ous/mucinous cystadenomas (BOTs) and 105 patients with Type II (high-grade serous carcinoma, HGSC) cancer. All of the included samples were pathologically proved by laparos-copy or laparotomy. All patients were followed up every 6 months during the first 3 years, and annually thereafter.
MR acquisition and interpretation
MRI was performed using a 1.5-T MR system (Magnetom Avanto, Siemens) with a phased-array coil. The routine MRI protocols used for the assessment of pelvic masses included the axial turbo spin-echo T1-weighted imaging (T1WI), sagittal TSE T2-weighted imaging (T2WI), and axial/sagittal fat-suppressed T2WI (FS T2WI). DWI was performed in the axial plane with parallel acquisition tech-nique by usingb value = 0, 100, and 800 s/mm2. The de-tailed MRI acquisition parameters are listed in Additional file1: Table S1. All lesion interpretation was performed by one experienced radiologist (H.Z. with more than 10 years of experience). The location, size (the largest dimension in two orthogonal planes), irregular septa (present/absent), and mass component (mainly solid with more than 70% solid components, mainly cystic with more than 70% cys-tic components, and mixed components), visibility of high signal on T1WI (hemorrhage or mucinous protein signal) within the lesion, and presence of both pelvic-free fluid and lymph nodes were noted. The ADC value was calculated by one observer (X.L.) on a commercially available post- processing workstation (Leonardo, Sie-mens, Germany). Regions of interest were drawn manually in both the cystic and solid areas, with no more than three sites in each lesion on b= 800 mm− 2
before treatment, and Ki-67 expression) were respectively recorded through the hospital information system.
Data statistical analysis
Continuous variables were expressed as the mean ± standard deviation. A logistic model was applied to as-sess the effects of MRI parameters and laboratory tests on ovarian cancer subgroups. A Cox hazard regression model was established for survival analysis. Missing data in this study accounted for 1.4 to 23.9% across the vari-ables. Multiple imputation procedures were applied to handle missing data issue in this study. Stata 14.2 (Stata-Corp, Austin, TX, USA) was used to perform statistical analyses. P values < .05 were considered statistically significant.
Results
Comparison between patients with type I and type II OEC Considering clinical parameters, Type II cancer (Fig. 1) was found in older patients (average 54.4 yrs.) and those with a more advanced FIGO stage (average 2.6) when compared with Type I cancer (average 44.0 yrs. and aver-age FIGO staver-age 1.7, Additional file 1: Figure S1) (p< 0.01). The Ki-67 expression and CA-125 level in the Type II group were also higher than Type I cancer (36.5% vs. 18.0%,p< 0.01; 839.1 IU/mL vs. 220.0 IU/mL,
p< 0.01, respectively). Statistically significant differences in MRI parameters were also noted between both groups. Type II OEC had a lower average ADC value (819.4 vs. 1275.9 × 10−3s/m2, p< 0.01; Additional file 1:
Figure S2), a smaller tumor size (74.7 mm vs. 112.7 mm,
p< 0.05), and less likelihood of presenting with septa and high signal on T1WI than Type I ovarian cancer (p< 0.05) (Table 1). The significant difference in the mean ADC value was also observed across both clinical and MRI subgroups (Additional file 1: Table S2). The ADC value was inversely related with Ki-67 expression in Type I cancer (ρ=−0.14, p< 0.05) (Fig. 2), while it was not significantly related with the Type II cancer group (ρ= 0.02,p> 0.05) (Additional file1: Figure S3).
Clinical and MRI predictors of ovarian cancer subtypes Older patients were less likely to be diagnosed with Type I (OR = 0.22, p< 0.01). In addition, patients in a more advanced stage were also less likely to be diagnosed with Type I (p< 0.05). Alternatively, if either a higher mean ADC value or a larger tumor was found on MRI, the pa-tients would be more likely to be diagnosed with Type I ovarian cancer (OR = 16.80, p< 0.01; OR = 2.24, p< 0.01, respectively). When leaving BOTs out, a higher ADC value also predicted a Type I cancer diagnosis (Table2).
Survival analysis
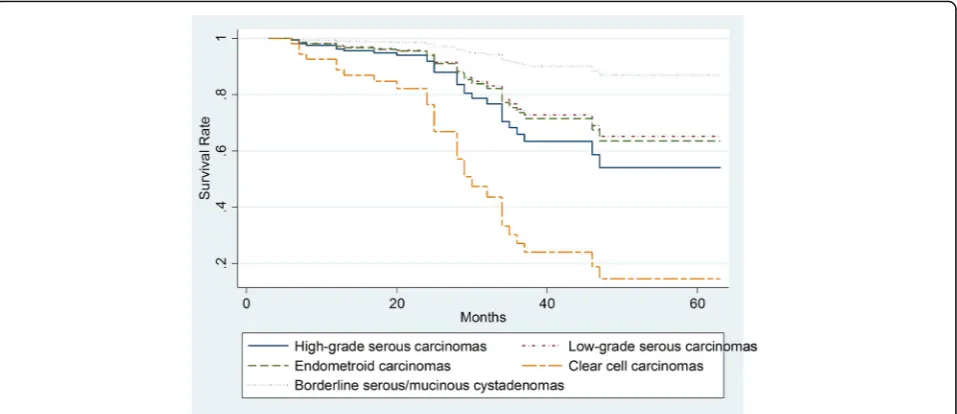
Twenty-nine out of the 172 patients had died by the end of study (16.9%). Median durations of this studied group were about 27.2 months. The median follow-up period for the survivors was 27.6 months at the end time point (interquartile range, 18–35.5 months). Univariate ana-lysis of overall survival showed that an older age, more advanced FIGO stage, solid component, and pathological
Fig. 1A 57-year-old woman with HGSC (IIIb). On axial fs-T2WI (a) and sagittal fs-T2WI (b), the mass showed as a mixed mass with intact capsule. On DWI (c), the solid tumor showed intermediate signal and the corresponding ADC value (d) was 729 (627–824) × 10−3s/m2. Hematoxylin and
subtypes were significant predictors of poor prognosis (p< 0.01). Specifically, clear cell cancer type had a poorer survival than borderline serous/mucinous cystadenomas
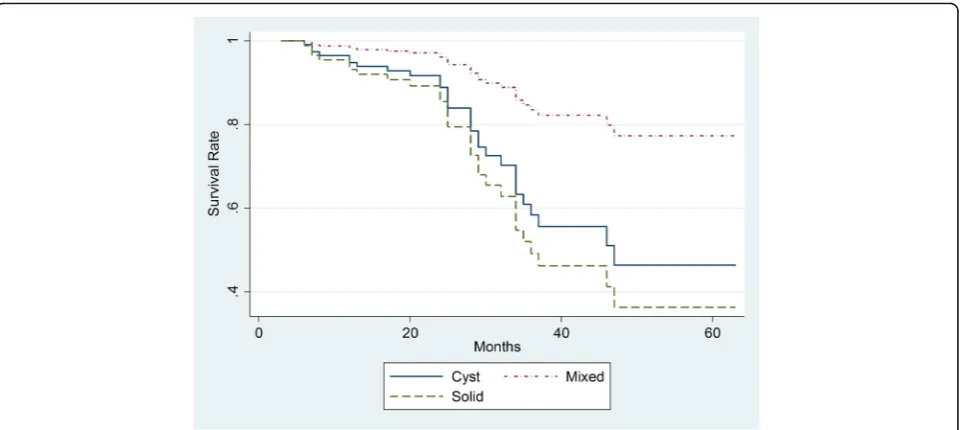
(HR = 13.6, p < 0.01, Fig. 3). The survival time did not differ between Type I and Type II cancer types (Table3). The FIGO stage is an independent prognostic factor and an advanced stage was related to death (p< 0.05). The solid mass and older age were more likely associated with a poor survival (HR = 3.69,p< 0.05, Fig.4; HR = 2.46, p< 0.05). Neither OEC subtypes, ADC value, tumor size, high signal on T1WI, Ki-67 expression, nor serum CA-125 level were independent prognostic factors (p> 0.05).
Discussion
Ovarian cancer is the most malignant cancer in women’s reproductive diseases, accounting for more than 90% of deaths from ovarian cancers [18]. Type I and Type II OEC resemble two distinct ovarian cancer subtypes based on molecular characteristics [3]. The significance of distinguishing the two OEC subtypes is that Type I has different biological behaviors, treatment responses, and gene mutations from Type II [5], and Type II ovar-ian cancer (most being high-grade serous ovarovar-ian can-cer) account for more than 70% of all ovarian cancer deaths [5, 18–20]. Considering the recent treatment strategy advancements [21–23], a minimally invasive approach and fertility-sparing approaches are neces-sary for patients with BOT tumors and patients of re-productive age with gynecological cancers [24, 25]. From this point of view, accurate preoperative evalu-ation of ovarian tumors play an important role in set-ting treatment plans [26].
Our findings indicated that both clinical and MRI fea-tures can distinguish between Type I and Type II OEC cancer to some extent. The mean ADC value in Type II was much lower than that in Type I. The old age, an ad-vanced FIGO stage, and a solid component predicted poorer prognosis for this OEC patients group. To the best of our knowledge, no previous studies on the role of MRI features in differentiating Type I and Type II OEC cancers by using a large cohort has been reported.
Our finding that Type I cancer occurred more often in younger age groups than Type II cancer is in accordance with reported literature [19]. This may be explained by the fact that over a half of our patients with Type I can-cer had borderline tumors (74/142), which usually occur in young patients. Both Ki-67 expression and CA-125 level were higher in Type II than in the Type I cancer group, because the patients with Type II cancer were hospitalized with a more advanced FIGO stage than those in the Type I group. Similar findings have also been reported in recently published literature [20].
On MRI, tumors with either vegetation or irregularly thickened septa or a wall of more than 3 mm is often suggestive of malignancies [27, 28]. Our study showed that both a thickened septa and high signal on T1WI in the lesion were more often observed in patients with Table 1Summaries of detailed clinical and MRI characteristics
of the studied population
Type I Type II
(n= 145) (n= 105) pvalue Clinical features
Age (yrs.) 43.3 ± 13.9 54.5 ± 9.9 0.00 < 30 27 (96.4%) 1 (3.6%)
30–50 61 (66.3%) 31 (33.7%) > 50 57 (43.8%) 73 (56.2%) CA125 level (IU/mL) 206 ± 326 843 ± 1141 0.00
< 35 34 (75.6%) 11 (24.4%) 35–200 49 (74.2%) 17 (25.8%) 201–500 16 (44.4%) 20 (55.6%) > 500 16 (26.7%) 44 (73.3%) Ki67expression (%) 19 ± 20 36 ± 22 0.00
< 50 117 (63.6%) 67 (36.4%) 50–75 12 (30.8%) 27 (69.2%) > 75 2 (22.2%) 7 (77.8%)
FIGO Stage 0.00
I 59 (75.6%) 19 (24.4%)
II 11 (52.4%) 10 (47.6%)
III 26 (32.1%) 55 (67.9%)
IV 1 (8.3%) 11 (91.7%)
MRI features
Maximum diameter (mm) 112.7 ± 4.9 74.7 ± 3.32 0.00 < 30 3 (42.9%) 4 (57.1%) 30–50 12 (33.3%) 24 (66.7%) 51–100 54 (52.9%) 48 (47.1%) > 100 71 (73.2%) 26 (26.8%)
Component 0.00
Solid 21 (58.3%) 15 (41.7%) Cyst 20 (29.9%) 47 (70.1%) Mixed 99 (71.2%) 40 (28.8%) Mean ADC (SD.) × 10−3s/m2 1275.9 (491.9) 819.4 (222.7) 0.00
Solid 1086(214) 814(187)
Cyst 1015(517) 805(187)
Mixed 1309(507) 856(242)
Septa 0.01
Absent 72 (50.0%) 72 (50.0%) Present 68 (70.1%) 29 (29.9%)
High signal on T1WI 0.00
Type I OEC than those with Type II OEC. The possible reason may be that Type II cancer comprised of only one pathological subtype, while there were four subtypes identified in Type I OEC patients resulting in much het-erogeneity in the lesion. Also, previous research found that hyperintense cystic components were often detected on T1WI in clear cell and endometroid ovarian cancer than in other subtypes [29, 30]. These findings are sup-ported by our study. Our results showed that the mainly solid tumors only constituted a small part of the total sample in both Type I (21/145) and Type II (15/105) groups. This is different from the study sample of Liu et al. where a solid or predominantly solid mass was de-tected on MRI in 44 patients with Type II cancer (38.6%) [20].
Our previous studies together with other research de-clared that ovarian cancer has much lower ADC value than benign disease [7,8,31,32]. However, there is lim-ited literature reporting on the usefulness of ADC mea-surements in discriminating OEC subtypes. Our study disclosed that the mean ADC value was lower in Type II cancer than in Type I cancer with statistical significance regardless of lesion components. Similar results were re-ported by Feng et al., who used multiple MRI diffusion models among 32 patients [33]. Another of our findings that a larger tumor was more likely to be found in pa-tients with Type I cancer was also supported by Alcázar et al. and Liu D et al.’s studies [19,20]. The reason is, as we mentioned above, that BOT was the most common pathological type in the Type I group, usually displaying a relatively large tumor when detected on MRI. How-ever, in this study, when leaving BOTs out, the mean ADC value difference was still observed between Type I
Fig. 2Scatter Plots of Ki-67 expression and the mean ADC value in Type I cancer group
Table 2Multivariate logistic regression analysis of OEC subtypes based on clinical and MRI features
Type OR P 95% Confidential Interval (CI)
Age 0.22 0.00 0.10 0.47
CA 125 level (IU/mL) < 35(reference)
35–200 1.58 0.54 0.36 6.99 201–500 0.56 0.46 0.12 2.61 > 500 0.37 0.18 0.09 1.59 Ki-67 expression (%)
< 50(reference)
50–75 0.36 0.08 0.12 1.13 > 75 0.22 0.14 0.03 1.65 FIGO
I (reference)
II 0.39 0.17 0.10 1.50
III 0.14 0.00 0.05 0.44
IV 0.02 0.01 0.00 0.30
Maximum diameter (mm) 2.24 0.01 1.25 4.01 Component
Mixed (reference)
Cyst 0.62 0.42 0.20 1.97
Solid 0.84 0.77 0.27 2.65
mean ADC (Log) 16.80 0.00 4.20 67.20
Septa 0.48 0.16 0.17 1.34
High signal on T1WI 2.07 0.16 0.74 5.79
and Type II group. In one study with 43 BOTs and 43 OECs, the authors used multiparametric MRI to differ-entiate BOTs from FIGO stage I OEC by applying logis-tic regression analysis [34]. They found that mixed components and predominantly solid components, as well as a thickened irregular septa, were more frequently seen in OECs.
Our study revealed significant differences in ADC measurements between clinical and MRI subtype groups. However, no difference was noted in tumor size and treatment response subgroups. That means that tumor size could not influence the ADC value by itself. For the treatment response group, such results need to be con-firmed in large cohort samples. Our findings also dis-closed that ADC value was inversely related with Ki-67 expression in ovarian cancer tumor tissue, which is in accordance with the previous literature [35, 36]. This character reflects the ovarian tumor cell proliferation to some extent. Notably, this correlation was only observed in the patients with Type I cancer, but not in those with Type II cancer. Lindgren et al. reported that lower ADC values were significantly associated with high Ki-67 ex-pression among 40 patients with primary and metastatic ovarian cancers on a 3.0 T MRI unit [37]. However, they did not describe the details in pathological types as well as OEC subtypes.
In 2015, a comprehensive study with near 2700 OEC patients reported that a significantly increased overall survival for those with Type I tumors was observed com-pared to those with Type II cancer after 730 days of follow-up [18]. In our study, FIGO stage was an inde-pendent prognostic factor that an advanced stage was al-ways associated with poorer prognosis [18]. Our finding that old age predicting a poor prognosis for OEC is in
Fig. 3The Kaplan–Meier Plots of overall survival time for all follow-up patients based on different ovarian cancer pathological types
Table 3Cox hazard model survival analysis based on clinical and MRI features
HR P 95% CI
Age 2.46 0.04 1.04 5.84
Type II 0.72 0.64 0.18 1.39
CA-125 level (IU/mL)
< 35 (Reference)
35–200 1.61 0.57 0.30 8.52
201–500 0.21 0.25 0.01 3.15
> 500 0.35 0.37 0.04 3.53
Ki-67 expression (%)
< 50 (Reference)
50–75 0.48 0.28 0.12 1.83
> 75 1.08 0.95 0.10 11.68
FIGO Stage
I (Reference)
II 1.45 0.66 0.27 7.74
III 6.45 0.03 1.25 33.40
IV 23.54 0.01 2.18 254.51
Maximum diameter (mm) 0.98 0.95 0.53 1.81 Component
Mixed (Reference)
Cyst 2.48 0.14 0.75 8.24
Solid 3.69 0.03 1.12 12.15
mean ADC (Log) 2.24 0.25 0.56 8.95
Septa 0.52 0.25 0.17 1.59
High signal on T1WI 0.98 0.96 0.39 2.47
Note: Reference groups: ovarian cancer type I, FIGO stag I, mixed components, absence of septa, and absence of T1WI high signal. Multiple imputation
line with another study’s results [38]. However, we did not find any difference in survival time between Type I and Type II OEC group. Clear cell ovarian cancer has the poorest prognosis compared with others and HGSC is the next OEC subtype that has a poor survival out-come. In a recent article, researchers reported that sur-vival for patients with serous and endometrioid ovarian cancer was improved during the past decade; meanwhile, no improvement was seen for those with mucinous and clear cell carcinoma subtypes [38]. Our findings validate that finding to some extent. Chen et al. analyzed 410 OEC patients who had achieved a complete clinical re-mission [39]. They found that nadir CA-125 level and histotype were independent predictors of progress-free survival (PFS) and overall survival (OS) duration. The PFS and OS durations for patients with Type I OEC were longer than those with Type II OEC [39].
In this study, a solid mass was associated with poor sur-vival in both Type I and Type II cancers. However, the real mechanism is unclear. We also found that a lower ADC value was not associated with worse survival at the end follow-up time point, which differs from Lindgren’s study [37]. The possible explanation is that their study also in-cluded metastatic ovarian cancer. We believe the inclusion of metastatic ovarian cancer could significantly affect the results of survival analysis. Future studies with more sam-ple size is needed to testify our result.
This study had several limitations. First, our study was a retrospective research. Some missing data was found during the data collection period, especially patients’ follow-up information. All data was collected in our sin-gle institute so that it could partly balance out this bias. Secondly, the ADC value was manually measured on the
selected area based on individual habits. Standardization in measurement may influence the final results. In this study, all the ADC measurements were performed by one person in order to minimize such a difference. Thirdly, in these studied samples, in the Type I group, BOTs comprised of more than 50% of the cohort sam-ples (74/145) and future studies may be needed to clarify the true ADC measurement differences between Type II and Type I groups, without including borderline tumors. Besides, sixty-six patients with advanced ovarian cancer in the Type II group often had peritoneal implants and pelvic fluid extension, making primary lesion identifica-tion difficult. All of these condiidentifica-tions may eventually ef-fect the ADC measurements in both groups.
Conclusions
MR features combined with an ADC value are helpful in categorizing OEC subtypes. ADC value can reflect tumor proliferative ability in Type I cancer. Solid mass compo-nent on MR imaging could predict poor prognosis for OEC patients.
Additional file
Additional file 1:Table S1.Details of parameters for MRI imaging protocols.Table S2.Statistical difference of ADC measurements in various groups based on clinical and MRI features.Figure S1.A 66-years old woman with clear cell tumor (Ic).Figure S2.Stem-and-Leaf Plots of the calculated ADC values (10−3/mm2/s) within between Type I and Type
II cancer group.Figure S3.Scatter Plots of Ki-67 expression and the mean ADC value in Type II cancer group. (DOCX 472 kb)
Abbreviations
ADC:Apparent diffusion coefficient; BOT: Borderline tumor; CA-125: Carbohydrate antigen 125; DWI: Diffusion weighted imaging; FIGO: International Federation of
Gynecology and Obstetrics; HIS: Hospital information system; HR: Hazard ratio; OEC: Ovarian epithelial cancer; OR: Odds ratio; PACS: Picture archive communication system
Authors’contributions
HZ and KH designed the whole study; XL performed ADC measurements; patients’follow-up and inquiry were collected by PZ and WY; YB analyzed the data and conducted statistical analysis; JJ provided the pathological and immunohistological results; GZ, WY, HZ, TS revised and wrote the manuscript finally. All authors read and approved the final manuscript.
Funding
This work is financially supported by Shanghai Natural Science Funding grant (14ZR1404400).
Availability of data and materials
The authors declare that all data supporting the findings of this study are available within the article.
Ethics approval and consent to participate
Our institutional review board approved the study, and the requirement for the informed consent of all participants was waived. In this article, institutional review board was review board of obstetrics and gynecological hospital, Medical College, Fudan University.
Consent for publication
All authors read and approved the final manuscript. All authors agreed to submit this article.
Competing interests
The authors declare that they have no competing interests.
Author details
1
Department of Radiology, Obstetrics and Gynecology Hospital, Fudan University, Shanghai, People’s Republic of China.2Department of Radiology, Yuyao People’s Hospital, Ningbo, Zhejiang province, People’s Republic of China.3Department of Radiology, International Peace Maternity and Child Health Hospital, Shanghai Jiao Tong University School of Medicine, Shanghai, People’s Republic of China.4Department of Pathology, Obstetrics and Gynecology Hospital, Fudan University, Shanghai, People’s Republic of China. 5Center for Child and Family Policy, Duke University, Durham, USA. 6
Department of Gynecology, Obstetrics and Gynecology Hospital, Fudan University, Shanghai, People’s Republic of China.
Received: 9 March 2019 Accepted: 21 June 2019
References
1. Cannistra SA. Cancer of the ovary. N Engl J Med. 2004;351(24):2519–29. 2. Chen WZR, Baade PD, Zhang S, Zeng H, Bray F, Jemal A, Yu XQ, He J.
Cancer statistics in China, 2015. CA Cancer J Clin. 2016;66(2):115–32. 3. Lalwani N, Prasad SR, Vikram R, Shanbhogue AK, Huettner PC, Fasih N.
Histologic, molecular, and cytogenetic features of ovarian cancers: implications for diagnosis and treatment. RadioGraphics. 2011;31(3):625–46.
4. Kim J, Coffey DM, Creighton CJ, Yu Z, Hawkins SM, Matzuk MM. High-grade serous ovarian cancer arises from fallopian tube in a mouse model. Proc Natl Acad Sci U S A. 2012;109(10):3921–6.
5. Bowtell DD, Böhm S, Ahmed AA, Aspuria P-J, Bast RC, Beral V, et al. Rethinking ovarian cancer II: reducing mortality from high-grade serous ovarian cancer. Nat Rev Cancer. 2015;15(11):668–79.
6. Griffin N, Grant LA, Sala E. Adnexal masses: characterization and imaging strategies. Seminars in Ultrasound, CT, and MRI. 2010;31(5):330–46. 7. Punwani S. Diffusion weighted imaging of female pelvic cancers: concepts
and clinical applications. Eur J Radiol. 2011;78(1):21–9.
8. Thomassin-Naggara I, Darai E, Cuenod CA. Contribution of diffusion-weighted MR imaging for predicting benignity of complex adnexal masses. Eur Radiol. 2009;19(6):1544–52.
9. Zhang H, Zhang GF, He ZY, Li ZY, Zhu M, Zhang GX. Evaluation of primary adnexal masses by 3 T MRI: categorization with conventional MR imaging and diffusion-weighted imaging. J Ovarian Res. 2012;5(1):33.
10. Levy A, Medjhoul A, Caramella C. Interest of diffusion-weighted echo-planar MR imaging and apparent diffusion coefficient mapping in gynecological malignancies: a review. J Magn Reson Imaging. 2011;33(5):1020–7. 11. Anastasi E, Gigli S, Ballesio L, Angeloni A, Manganaro L. The complementary
role of imaging and tumor biomarkers in gynecological cancers: an update of the literature. Asian Pac J Cancer Prev. 2018;19(2):309–17.
12. Bast RCJ, Badgwell D, Lu Z, Marquez R, Rosen D, Liu J, et al. New tumor markers: CA125 and beyond. Int J Gynecol Cancer. 2005;15:274–81. 13. Korkolopoulou P, Vassilopoulos I, Konstantinidou AE, Zorzos H, Patsouris E,
Agapitos E, et al. The combined evaluation of p27Kip1 and Ki-67 expression provides independent information on overall survival of ovarian carcinoma patients. Gynecol Oncol. 2002;85(3):404–14.
14. Khouja MH, Baekelandt M, Nesland JM, Holm R. The clinical importance of Ki-67, p16, p14, and p57 expression in patients with advanced ovarian carcinoma. Int J Gynecol Pathol. 2007;26(4):418–25.
15. O’Connor JPB, Aboagye EO, Adams JE, Aerts HJWL, Barrington SF, Beer AJ, et al. Imaging biomarker roadmap for cancer studies. Nat Rev Clin Oncol. 2017;14(3):169–86.
16. Chen B-B, Tien Y-W, Chang M-C, Cheng M-F, Chang Y-T, Yang S-H, et al. Multiparametric PET/MR imaging biomarkers are associated with overall survival in patients with pancreatic cancer. Eur J Nucl Med Mol Imaging. 2018;45(7):1205–17.
17. Nakamura K, Joja I, Nagasaka T, Fukushima C, Kusumoto T, Seki N, et al. The mean apparent diffusion coefficient value (ADCmean) on primary cervical cancer is a predictive marker for disease recurrence. Gynecol Oncol. 2012;127(3):478–83. 18. Prahm KP, Karlsen MA, Høgdall E, Scheller NM, Lundvall L, Nedergaard L, et
al. The prognostic value of dividing epithelial ovarian cancer into type I and type II tumors based on pathologic characteristics. Gynecol Oncol. 2015; 136(2):205–11.
19. Alcázar JL, Utrilla-Layna J, Mínguez JÁ, Jurado M. Clinical and ultrasound features of type I and type II epithelial ovarian Cancer. Int J Gynecol Cancer. 2013;23(4):680–4.
20. Liu D, Zhang L, Indima N, Peng K, Li Q, Hua T, et al. CT and MRI findings of type I and type II epithelial ovarian cancer. Eur J Radiol. 2017;90:225–33. 21. Vitale SG, La Rosa VL, Rapisarda AMC, Laganà AS. The importance of fertility
preservation counseling in patients with gynecologic Cancer. Journal of reproduction & infertility. 2017;18(2):261–3.
22. Minig L, Padilla Iserte P, Zorrero C, Zanagnolo V. Robotic surgery in women with ovarian Cancer: surgical technique and evidence of clinical outcomes. J Minim Invasive Gynecol. 2016;23(3):309–16.
23. Bellia A, Vitale SG, Laganà AS, Cannone F, Houvenaeghel G, Rua S, et al. Feasibility and surgical outcomes of conventional and robot-assisted laparoscopy for early-stage ovarian cancer: a retrospective, multicenter analysis. Arch Gynecol Obstet. 2016;294(3):615–22.
24. Vitale SG, La Rosa VL, Rapisarda AMC, Laganà AS. Fertility preservation in women with gynaecologic cancer: the impact on quality of life and psychological well-being. Hum Fertil. 2018;21(1):35–8.
25. Chiofalo B, Palmara V, Laganà AS, Triolo O, Vitale SG, Conway F, et al. Fertility sparing strategies in patients affected by placental site trophoblastic tumor. Curr Treat Options in Oncol. 2017;18(10):58.
26. Vitale SG, Rossetti D, Tropea A, Biondi A, Laganà AS. Fertility sparing surgery for stage IA type I and G2 endometrial cancer in reproductive-aged patients: evidence-based approach and future perspectives. Updat Surg. 2017;69(1):29–34.
27. Thomassin-Naggara I, Toussaint I, Perrot N. Characterization of complex adnexal masses: value of adding perfusion- and diffusion-weighted MR imaging to conventional MR imaging. Radiology. 2011;258(3):793–803. 28. Stein EB, Wasnik AP, Sciallis AP, Kamaya A, Maturen KE. MR imaging–
pathologic correlation in ovarian Cancer. Magn Reson Imaging Clin N Am. 2017;25(3):545–62.
29. Ma F-H, Qiang J-W, Zhang G-F, Li H-M, Cai S-Q, Rao Y-M. Magnetic resonance imaging for distinguishing ovarian clear cell carcinoma from high-grade serous carcinoma. Journal of Ovarian Research. 2016;9(1):40. 30. Li HM, Qiang JW, Xia GL, Zhao SH, Ma FH, Cai SQ, et al. MRI for differentiating ovarian endometrioid adenocarcinoma from high-grade serous adenocarcinoma. Journal of Ovarian Research. 2015;8:26.
31. Zhang H, Zhang GF, Wang TP. Value of 3.0 T diffusion-weighted imaging in discriminating thecoma and fibrothecoma from other adnexal solid masses. J Ovarian Res. 2013;6:58.
tumors with solid and cystic components. Abdom Imaging. 2012;37(5): 897–903.
33. Feng W, Yuxiang W, Yan Z, Congrong L, Lizhi X, Zhenyu Z, et al. Comparison between types I and II epithelial ovarian cancer using histogram analysis of monoexponential, biexponential, and stretched-exponential diffusion models. J Magn Reson Imaging. 2017;46(6):1797–809.
34. Denewar FA, Takeuchi M, Urano M, Kamishima Y, Kawai T, Takahashi N, et al. Multiparametric MRI for differentiation of borderline ovarian tumors from stage I malignant epithelial ovarian tumors using multivariate logistic regression analysis. Eur J Radiol. 2017;91:116–23.
35. Surov A, Meyer HJ, Wienke A. Associations between apparent diffusion coefficient (ADC) and KI 67 in different tumors: a meta-analysis. Part 1: ADC (mean). Oncotarget. 2017;8(43):75434–44.
36. Surov A, Meyer HJ, Wienke A. Correlation between apparent diffusion coefficient (ADC) and cellularity is different in several tumors: a meta-analysis. Oncotarget. 2017;8(35):59492–9.
37. Lindgren A, Anttila M, Rautiainen S, Arponen O, Kivelä A, Mäkinen P, et al. Primary and metastatic ovarian cancer: characterization by 3.0T diffusion-weighted MRI. Eur Radiol. 2017;27(9):4002–12.
38. Lee J-Y, Kim S, Kim YT, Lim MC, Lee B, Jung K-W, et al. Changes in ovarian cancer survival during the 20 years before the era of targeted therapy. BMC Cancer. 2018;18:601.
39. Chen X, Zhang J, Cheng W, Chang DY, Huang J, Wang X, et al. CA-125 level as a prognostic Indicator in type I and type II epithelial ovarian Cancer. Int J Gynecol Cancer. 2013;23(5):815–22.
Publisher’s Note