T E C H N I C A L A D V A N C E
Open Access
Multivariate permutation test to compare survival
curves for matched data
Stefania Galimberti
*and Maria Grazia Valsecchi
Abstract
Background:In the absence of randomization, the comparison of an experimental treatment with respect to the standard may be done based on a matched design. When there is a limited set of cases receiving the experimental treatment, matching of a proper set of controls in a non fixed proportion is convenient.
Methods:In order to deal with the highly stratified survival data generated by multiple matching, we extend the multivariate permutation testing approach, since standard nonparametric methods for the comparison of survival curves cannot be applied in this setting.
Results:We demonstrate the validity of the proposed method with simulations, and we illustrate its application to data from an observational study for the comparison of bone marrow transplantation and chemotherapy in the treatment of paediatric leukaemia.
Conclusions:The use of the multivariate permutation testing approach is recommended in the highly stratified context of survival matched data, especially when the proportional hazards assumption does not hold.
Keywords:Highly stratified data, Matched survival data, Multiple matching, Multivariate permutation tests
Background
In clinical trials with right-censored failure time outcome, inference often focuses on the comparison of survival curves. When data from observational studies are used to explore the role of different treatments, the main problem is to limit the biases due to the lack of randomization. Matching on relevant baseline features can be used in order to increase the comparability between subjects trea-ted with an experimental therapy and those receiving standard treatment. In settings where matching is done with a variable number of controls (multiple matching), highly stratified data are produced, with strata containing a few, possibly censored, observations. For this reason, the statistical comparison of survival in the two groups cannot be directly addressed by means of the usual nonpara-metric procedures, such as the log-rank test. The stratified version of these tests, which should account for matching, is inefficient when the number of strata increases and the stratum size is small [1]. Furthermore, these methods are less sensitive when proportional hazard is not satisfied
and this might often be the case, especially in the clinical setting that motivated this paper, i.e. the comparison of bone marrow transplantation and chemotherapy in the treatment of leukemia [2,3].
The comparison of the survival curves for highly strati-fied data due to non-paired matching was addressed by Galimberti et al. [2], who proposed a weighted Kaplan-Meier estimator for the controls and a nonparametric per-mutation test on the survival difference at one pre-fixed time point. The aim of this work is to extend the compari-son of survival at multiple time points, using the multi-variate permutation approach originally introduced by Pesarin [4]. In the proposed procedure, differently from Pesarin and Salmaso [5], a desirable feature is that there is no need to resort to the missing data framework in order to deal with censoring.
Our method is compared with the stratified log-rank test, the modified log-rank test for highly stratified data of Schoenfeld and Tsiatis [1] and the Cox model with a sand-wich robust standard error for the treatment effect [6,7]. There were no natural competitors among other permuta-tion tests on survival proposed in the literature [8-10]. * Correspondence:[email protected]
Center of Biostatistics for Clinical Epidemiology, Department of Health Sciences, University of Milano-Bicocca, 20900, Monza, Italy
The paper is organized as follows. In the next section, we show how the multivariate permutation approach can be extended to the survival matched data setting. We investigate the performance of the proposed test through simulation studies that are presented in the Simulation section and we illustrate the method, using data from the motivating study on childhood leukemia [11], in the Application section. Finally, we provide a discussion and concluding remarks.
Methods
Multivariate permutation tests for survival matched data In the context of non randomized studies, especially in rare diseases, where only selected patients undergo experi-mental therapies, matching is an approach to identify a proper set of controls for an unbiased comparison. This was the case of a multicenter study conducted in Italy on the role of allogeneic Bone Marrow Transplantation (BMT) from matched sibling donors in children with acute lymphoblastic leukaemia (ALL) who, by presenting features, have a dismal prognosis [11]. Matching produced a stratum for each transplanted patient, that included as many controls as available, in order to recover the max-imum amount of information in this rare subgroup.
More formally, this setting presents finely stratified data: each of the k strata (j = 1,. . .,k) has 1+mjsubjects,
where the first is the case belonging to the experimental arm (group 1) and the remaining mj are the matched
subjects in the control arm (group 2).
The available data refer to the potential survival and censoring times. We assume that, conditionally on the observed j-th stratum, the survival times of the mj
con-trols are i.i.d., but we cannot exclude, due to matching, some dependence between the case and the correspond-ing controls. Moreover, the usual assumption that cen-soring is independent of the failure mechanism and of the treatment must hold within stratum. Across strata, both cases and controls are independent, but not neces-sarily identically distributed. Finally, under the null hy-pothesis, the distribution of the survival times of the case and the matched controls in each stratum is invari-ant under permutations.
The multidimensional permutation approach intro-duced by Pesarin is here adapted to the context of sur-vival analysis with matched data for the comparison of the marginal survival distributions of the two groups, S1(t) and S2(t). The procedure is based on a
nonpara-metric combination of multiple, possibly dependent, uni-variate permutation tests. It relies on the following main steps: reformulate the inferential question of interest into a set of sub-questions, set up the partial tests and set up the form for their combination [4].
Firstly, the null and the alternative hypothesis are decomposed into a finite set of q sub-hypotheses H0i
and H1i (i=1,. . .,q) with the property that, if H0is true,
all the H0i are jointly true, while if H1 is true, at least
one sub-hypothesis is true. The standard hypotheses on the survival distributions are thus rephrased into q sub-hypotheses H0i, H1i(i=1,. . .,q) so that:
H0: S1(t)=S2(t) becomes H0:\ q
i¼1H0iwith H0i: S1(ti)=S2(ti),
H1: S1(t)≠S2(t) becomes H1: [ q
i¼1H1i with H1i: S1(ti)≠
S2(ti).
Appropriate partial tests Ti1are then performed
separ-ately on each q sub-hypothesis H0i (i=1,. . .,q). We
con-sidered two versions of test statistics that are marginally unbiased and consistent, as required for the validity of the procedure [4]. They are based on the distance of the two survival curves or on their complementary log-log transformation [12] estimated at q different times points (t1,..,ti,..,tq):
TS1i ¼^S1ð Þ ti ^S2wð Þti ði¼1;. . .;qÞ
TLSi1=log{-log[^S1(ti)]}-log{-log[^S2w(ti)]}
where S^1ð Þ: is the usual Kaplan-Meier estimate of the
survival distribution in group 1, while S^2wð Þ: is a
weighted version, with stratum specific weights used in group 2 to account for the variable number of subjects in each stratum [2]. If we indicate with dj(u) and rj(u)
the number of events and the number of subjects at risk at time u in stratum j, and with wj=1/mjthe weight
ap-plied to the mj controls of the stratum, the formula for ^
S2wð Þ: is:
^
S2wð Þ ¼t
Y
u:u≤t 1
Xk
j¼1
wjdjð Þu
Xk
j¼1
wjrjð Þu 0
B B B B B @
1 C C C C C A
which can also have a product integral representation for continuous time variables. This estimator has an intuitive appeal because it can be viewed as a Kaplan-Meier estima-tor computed on k components, one for each stratum, in which all the mjcontrols are given the same weight. The
imbalance in prognostic factors induced by multiple matching is adjusted giving less weight to individuals from strata that are over-represented and vice versa. The idea behind this estimator is to standardize the survival curve of controls, using the population of cases as reference. The weighted Kaplan-Meier estimator ^S2wð Þ: is an
un-biased estimator for S2, characterized by a Gaussian
asymptotic distribution with a variance that can be con-sistently estimated via bootstrap [2].
and TLSi1. When the cardinality
Yk
j¼1
mjþ1
of the
per-mutations is large, due to the large number of strata and to their size, it is worthwhile approximating the permu-tation distribution of the q test statistics with a Monte Carlo strategy that considers B random samples from the population of all possible permutations. Each of the B permutation samples is obtained by assigning, within each observed stratum, one subject to the experimental treatment and the remaining mj to the standard
treat-ment. The q first order tests are then calculated on each permuted sample and, at each time point, the partial p-valuesλi’s for the q observed TSi1or TLSi1(i=1,. . .,q) are
obtained from the empirical permutation distribution. Starting from the q permutation distributions, the p-values are also calculated for the first order test statistics of each permuted sample.
In order to test the global null hypothesis H0, the
par-tial tests Ti1 are subsequently combined in a
unidimen-sional second-order test statistic T2. This combination has to be done nonparametrically, since the q univariate tests are dependent, and it is applied to the p-valuesλi,
which are permutationally equivalent to the partial tests [4]. Two alternative functions proposed by Fisher and Tippett, respectively, are considered, which can be ap-plied on p-values either from TSi1or TLSi1as follows:
T2F ¼ 2 Xq
i¼1
logð Þλi
T2T ¼max1≤i≤q ð1λiÞ
As the Tippett combinig function can be written as 1min1≤i≤q λi, it has a monotonic relationship with the well known function min1≤i≤q λi used by Westfall and Young [13] in their resampling approach to multiple testing.
While the q p-valuesλiare obtained from the marginal
permutation distribution of the first order tests, the p-value of the global test is derived from the permutation distribution of the second order test, which is related to the q-variate distribution in the first step. Note that, no further permutations are needed at this stage, because we use, for the global test, the results on the p-values obtained from each permuted sample that define the permutation distributions of the first order tests [4].
In the survival setting the definition of the time points (t1,. . .,ti,. . .,tq) involved in the comparison may be
rele-vant. We explored different strategies: i) fixed time points, ii) time points identified by percentiles of the overall event distribution and iii) all the observed event times included between the 10thand the 90thpercentiles of the overall event distribution.
Results
Simulations
The performance of these tests in the finite sample situ-ation are evaluated through simulsitu-ations. The size and the power are calculated for different alternatives under proportional hazards and for three different scenarios of non-proportionality (e.g. survival curves showing both an early and a late difference or crossing each other). The behavior of the proposed tests is also explored in the presence of different number of strata (k=30, 50, 100) and of different degree of strata heterogeneity (no or low strata effect). The dimension of each stratum is defined by one case plus the number of controls gener-ated by a Poisson (μ=4)+1 (1 is added in order to guaran-tee at least 1 control in each stratum).
In the simulations under H0, the case and the matched
controls share the same conditional piecewise exponen-tial hazard function: λj(t|αj,bj)= αj[b1I(t≤L)+ b2I(t>L)].
The randomness of λj is determined by αj~G[1/w,w],
where G(a,b) is a Gamma distribution with mean ab and variance ab2, and the parameter w indicates the level of heterogeneity across strata (w=0, 0.22; specifically, for w=0, no strata effect is assumed asαj=1 with probability 1).
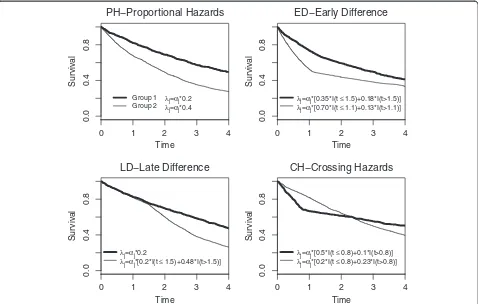
Different scenarios are obtained by giving specific values to the landmark L, to b1and b2. Under the
alter-native hypothesis, the hazard function for cases was decreased in order to define a survival which differs from that of controls, as specified in Figure 1. Censoring was uniform over 3–6 in order to have approximately 28–38 percent censoring, on average. For all the config-urations studied, the results are based on 1000 samples and each of them uses B=2000 Monte Carlo permuta-tions in order to define the empirical permutation distributions.
Definitions of the q time points involved in the comparison are as follows: i) 8 or 4 fixed equi-spaced times from 0.5-1 to 4, ii) 9 time points identified by the 10th, 20th,.., 90th percentiles of the overall event distribution, and iii) all the observed failure times be-tween the 10th and the 90th percentiles of the overall event distribution.
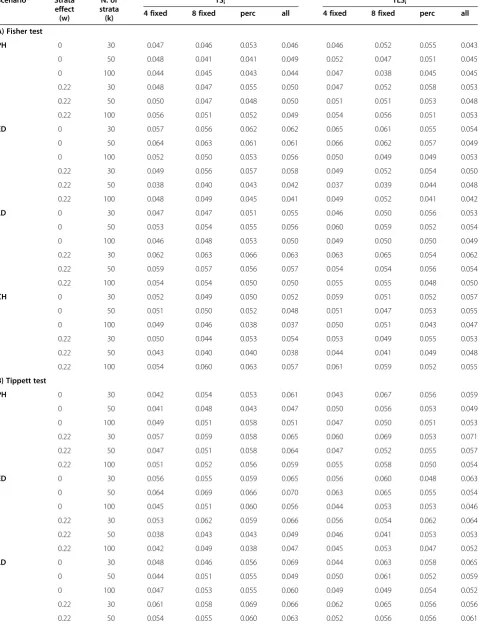
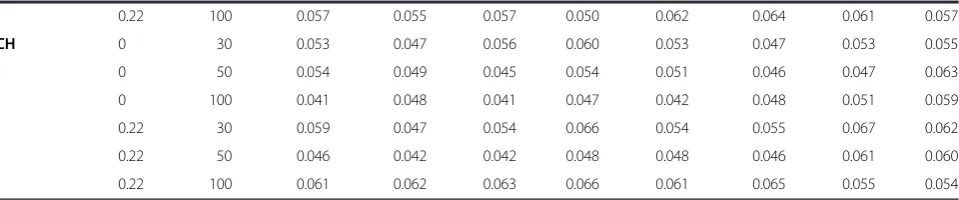
The empirical level of the tests is shown in Tables 1.A (Fisher combining function) and 1.B (Tippett function), while the power in detecting a difference in survival is reported in Table 2.A-B, accordingly.
As expected, the performance of the test Under H0is
from a higher percentile such as the 20th (data not shown).
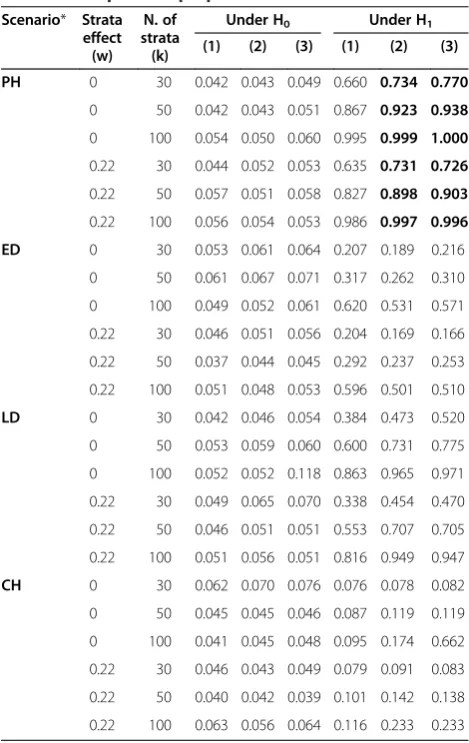
Under H1, as expected, power increases with increasing
number of strata under every scenario and the test has a good behavior also in the situation of crossing hazards. No major gain in power is achieved by increasing the number of fixed time points from 4 to 8 and similar results are obtained when points are fixed at percentiles of the event distribution or take 80% of all observed event times. The fixed time point strategy seems generally more satisfactory for the proportional hazards and the late dif-ference scenarios. A clear advantage in the use of the com-plementary log-log transform is seen only in the early difference scenario; conversely the survival difference seems to offer an advantage in the crossing hazards set-ting. Again, by comparing Table 2.A and 2.B, where the best performers for each scenario are in bold, the per-formance under the Fisher and Tippet functions is very similar, except for an advantage of Tippett in the crossing hazards scenario.
Results on the comparison of our permutation tests with other approaches are reported in Table 3. The stratified log-rank test, the modified log-rank test by Schoenfeld-Tsiatis and the robust test from the Cox model including only the covariate for treatment have
size close to the nominal level. The multivariate permu-tation tests perform better than the latter tests in terms of power in the crossing hazards and early difference scenarios, while they have a similar behavior in the pres-ence of proportional hazards.
Application
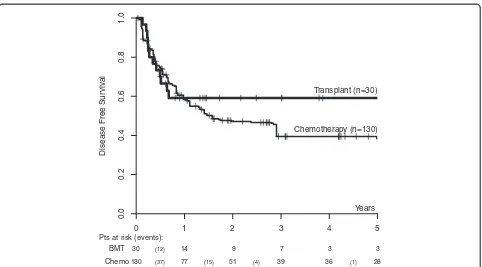
The clinical context that motivated this work is a retro-spective multicentre study on 427 children enrolled be-tween 1985 and 1994 in high-risk protocols for the treatment of ALL, where 30 received an allogeneic bone-marrow transplant after achieving first remission. In this setting, where transplant was considered as an experimental treatment to be administered only to selected patients, we used matching to define the appro-priate group of children treated with chemotherapy alone to be used for an unbiased comparison. The matching procedure was based on 6 factors (centre, front-line treatment protocol, white blood cell count and age at diagnosis, immunophenotype and waiting time to transplant). For each of the 30 BMT cases, at least one non transplanted matched control was found, with a maximum of 17 and a median of 3, for a total of 130 controls. The Disease Free Survival (DFS) curves of the two groups depicted in Figure 2 were estimated using
0 1 2 3 4
0.0
0
.4
0.8
Time
Sur
viva
l
λj=αj*0.2
λj=αj*0.4
Group 1 Group 2
PH−Proportional Hazards
0 1 2 3 4
0.0
0
.4
0.8
Time
Sur
viva
l
λj=αj*[0.35*I(t≤1.5)+0.18*I(t>1.5)]
λj=αj*[0.70*I(t≤1.1)+0.13*I(t>1.1)]
ED−Early Difference
0 1 2 3 4
0.0
0
.4
0.8
Time
Sur
viva
l
λj=αj*0.2
λj=αj*[0.2*I(t≤1.5)+0.48*I(t>1.5)]
LD−Late Difference
0 1 2 3 4
0.0
0
.4
0.8
Time
Sur
viva
l
λj=αj*[0.5*I(t≤0.8)+0.1*I(t>0.8)]
λj=αj*[0.2*I(t≤0.8)+0.23*I(t>0.8)]
CH−Crossing Hazards
Figure 1Marginal survival curves under H1in the four scenarios considered in the simulation study.For each scenario, we reported the
Table 1 A-B - Simulation results under H0of the multivariate permutation (two-sided) Fisher (A) and Tippett (B) tests
Scenario* Strata
effect (w)
N. of strata (k)
TSi 1
TLSi 1
4 fixed 8 fixed perc all 4 fixed 8 fixed perc all
A) Fisher test
PH 0 30 0.047 0.046 0.053 0.046 0.046 0.052 0.055 0.043
0 50 0.048 0.041 0.041 0.049 0.052 0.047 0.051 0.045
0 100 0.044 0.045 0.043 0.044 0.047 0.038 0.045 0.045
0.22 30 0.048 0.047 0.055 0.050 0.047 0.052 0.058 0.053
0.22 50 0.050 0.047 0.048 0.050 0.051 0.051 0.053 0.048
0.22 100 0.056 0.051 0.052 0.049 0.054 0.056 0.051 0.053
ED 0 30 0.057 0.056 0.062 0.062 0.065 0.061 0.055 0.054
0 50 0.064 0.063 0.061 0.061 0.066 0.062 0.057 0.049
0 100 0.052 0.050 0.053 0.056 0.050 0.049 0.049 0.053
0.22 30 0.049 0.056 0.057 0.058 0.049 0.052 0.054 0.050
0.22 50 0.038 0.040 0.043 0.042 0.037 0.039 0.044 0.048
0.22 100 0.048 0.049 0.045 0.041 0.049 0.052 0.041 0.042
LD 0 30 0.047 0.047 0.051 0.055 0.046 0.050 0.056 0.053
0 50 0.053 0.054 0.055 0.056 0.060 0.059 0.052 0.054
0 100 0.046 0.048 0.053 0.050 0.049 0.050 0.050 0.049
0.22 30 0.062 0.063 0.066 0.063 0.063 0.065 0.054 0.062
0.22 50 0.059 0.057 0.056 0.057 0.054 0.054 0.056 0.054
0.22 100 0.054 0.054 0.050 0.050 0.055 0.055 0.048 0.050
CH 0 30 0.052 0.049 0.050 0.052 0.059 0.051 0.052 0.057
0 50 0.051 0.050 0.052 0.048 0.051 0.047 0.053 0.055
0 100 0.049 0.046 0.038 0.037 0.050 0.051 0.043 0.047
0.22 30 0.050 0.044 0.053 0.054 0.053 0.049 0.055 0.053
0.22 50 0.043 0.040 0.040 0.038 0.044 0.041 0.049 0.048
0.22 100 0.054 0.060 0.063 0.057 0.061 0.059 0.052 0.055
B) Tippett test
PH 0 30 0.042 0.054 0.053 0.061 0.043 0.067 0.056 0.059
0 50 0.041 0.048 0.043 0.047 0.050 0.056 0.053 0.049
0 100 0.049 0.051 0.058 0.051 0.047 0.050 0.051 0.053
0.22 30 0.057 0.059 0.058 0.065 0.060 0.069 0.053 0.071
0.22 50 0.047 0.051 0.058 0.064 0.047 0.052 0.055 0.057
0.22 100 0.051 0.052 0.056 0.059 0.055 0.058 0.050 0.054
ED 0 30 0.056 0.055 0.059 0.065 0.056 0.060 0.048 0.063
0 50 0.064 0.069 0.066 0.070 0.063 0.065 0.055 0.054
0 100 0.045 0.051 0.060 0.056 0.044 0.053 0.053 0.046
0.22 30 0.053 0.062 0.059 0.066 0.056 0.054 0.062 0.064
0.22 50 0.038 0.043 0.043 0.049 0.046 0.041 0.053 0.053
0.22 100 0.042 0.049 0.038 0.047 0.045 0.053 0.047 0.052
LD 0 30 0.048 0.046 0.056 0.069 0.044 0.063 0.058 0.065
0 50 0.044 0.051 0.055 0.049 0.050 0.061 0.052 0.059
0 100 0.047 0.053 0.055 0.060 0.049 0.049 0.054 0.052
0.22 30 0.061 0.058 0.069 0.066 0.062 0.065 0.056 0.056
the standard and the weighted version of Kaplan-Meier for the transplant and the chemotherapy group, respect-ively. This plot indicates a long term advantage of trans-plant over chemotherapy after 1 year from transtrans-plant, with a DFS at 3 years of 59.1% (Greenwood s.e. 9.1) and 39.5% (bootstrap s.e. 7.7), respectively.
A local two-sided permutation test was originally used on the estimated DFS difference of 19.6% at the time point of 3 years, considered a meaningful time point according to clinical experience (p-value=0.112). At 3 years, 7 cases and 39 controls were still at risk and most of the overall number of events (97%) had already occurred, as shown by the event distribution below Figure 2. We have now ap-plied the multivariate permutation approach in order to compare the two DFS curves with a global test. The Fisher and the Tippett tests are performed based both on the dir-ect estimates of survival and on its complementary log-log transformation, according to different choices of time points involved in the comparison. Based on previous studies and knowledge on the treatment implications on toxicity and survival, the most likely alternative to the null is a non proportional setting with an early crossing and late differences in hazards. The result in term of signifi-cance (p-value=0.199) points to the Tippett test on log-survival involving 4 points (at 1, 2, 3 and 4 years from the origin). Other tests on 4 fixed time points, starting from 0.5 or 1 year (and not necessarily equispaced), are applied, and results are in keeping with the observation that curves start diverging at 1 year. The tests involving the percentiles and all the event times within the 10thand 90thpercentile, give p-values ranging from 0.486 to 0.829 (Table 4).
Due to the relatively small sample size, the power is likely not adequate to detect the advantage given by transplantation, and this holds true even if we are applying a more appropriate test with regard to standard methods (stratified log-rank test, p-values=0.966; Cox model with robust standard error, p-values=0.915).
Discussion
This paper provides a global test for the comparison of survival curves in the context of highly stratified data produced by matching on a non-fixed proportion, by extending the multivariate permutation approach pro-posed by Pesarin [4]. The nonparametric combination of partial tests is able to capture their underlying de-pendence without assumptions and to control the level of significance of the global test, avoiding the issue of multiplicity. In principle, the proposed tests can be viewed as a weighted combination of an infinite number of time points, giving weight 1 to those involved in the comparison, and weight 0 otherwise. Yet, in survival analysis, the choice of the time points where partial tests are performed is a crucial issue. Our approach carefully considers this aspect by evaluating three different con-venient strategies among the many possible. The most simple is the one that identifies a number of fixed time points. This is appealing for applications where the re-searcher has reasons for evaluating certain times that are relevant for the phenomenon. Importantly, given the de-gree of arbitrariness involved, the choice of the time points should be carefully done, possibly a-priori, in a time window where more information is expected, given the experimental setting and the follow-up. Typically, in time points near the boundaries, i.e. at the very begin-ning or on the tail of the survival curves, where few events are generally observed, the permutation distribu-tion of the partial tests may be irregular. Following this consideration, alternative non subjective definitions of time points are based on the observed distribution of events, either with a limited number defined by percen-tiles, or on the whole set of event times within the 10th up to the 90thpercentile.
As expected, the extended simulation study shows good performances of the proposed test in terms of alpha coverage. Under the alternative, apparently a slight advantage is obtained considering all event times for partial tests in the crossing hazard and early difference
Table 1 A-B - Simulation results under H0of the multivariate permutation (two-sided) Fisher (A) and Tippett (B) tests
(Continued)
0.22 100 0.057 0.055 0.057 0.050 0.062 0.064 0.061 0.057
CH 0 30 0.053 0.047 0.056 0.060 0.053 0.047 0.053 0.055
0 50 0.054 0.049 0.045 0.054 0.051 0.046 0.047 0.063
0 100 0.041 0.048 0.041 0.047 0.042 0.048 0.051 0.059
0.22 30 0.059 0.047 0.054 0.066 0.054 0.055 0.067 0.062
0.22 50 0.046 0.042 0.042 0.048 0.048 0.046 0.061 0.060
0.22 100 0.061 0.062 0.063 0.066 0.061 0.065 0.055 0.054
* PH=Proportional Hazards, ED=Early Difference, LD=Late Difference, CH=Crossing Hazards. The simulations are based on first order statistics TSi
1 or TLSi
1
Table 2 A-B - Simulation results under H1of the multivariate permutation (two-sided) Fisher (A) and Tippett (B) tests
Scenario* Strata
effect (w)
N. of Strata
(k)
TSi 1
TLSi 1
4 fixed 8 fixed perc all 4 fixed 8 fixed perc all
A)Fisher test
PH 0 30 0.734 0.723 0.627 0.592 0.744 0.737 0.673 0.651
0 50 0.911 0.906 0.854 0.822 0.909 0.906 0.871 0.847
0 100 0.998 0.996 0.993 0.968 0.997 0.996 0.993 0.978
0.22 30 0.692 0.691 0.606 0.578 0.706 0.720 0.658 0.638
0.22 50 0.882 0.873 0.816 0.795 0.888 0.887 0.839 0.831
0.22 100 0.995 0.995 0.983 0.978 0.997 0.995 0.985 0.981
ED 0 30 0.274 0.274 0.414 0.432 0.302 0.297 0.514 0.534
0 50 0.406 0.408 0.622 0.641 0.443 0.452 0.682 0.699
0 100 0.730 0.746 0.916 0.927 0.760 0.770 0.939 0.937
0.22 30 0.240 0.252 0.376 0.409 0.267 0.285 0.470 0.488
0.22 50 0.387 0.252 0.616 0.632 0.423 0.285 0.671 0.682
0.22 100 0.710 0.727 0.894 0.902 0.739 0.753 0.924 0.929
LD 0 30 0.425 0.408 0.278 0.247 0.408 0.400 0.298 0.266
0 50 0.674 0.642 0.464 0.392 0.648 0.627 0.470 0.406
0 100 0.949 0.937 0.802 0.749 0.940 0.928 0.796 0.691
0.22 30 0.399 0.369 0.243 0.209 0.387 0.373 0.273 0.245
0.22 50 0.626 0.590 0.414 0.359 0.620 0.587 0.440 0.384
0.22 100 0.910 0.890 0.740 0.712 0.908 0.888 0.751 0.725
CH 0 30 0.144 0.165 0.285 0.272 0.079 0.078 0.115 0.099
0 50 0.291 0.321 0.488 0.461 0.162 0.148 0.229 0.207
0 100 0.747 0.799 0.897 0.881 0.560 0.596 0.746 0.729
0.22 30 0.149 0.181 0.273 0.248 0.087 0.089 0.111 0.105
0.22 50 0.292 0.319 0.477 0.419 0.178 0.161 0.237 0.207
0.22 100 0.736 0.794 0.878 0.844 0.575 0.589 0.744 0.668
B)Tippett test
PH 0 30 0.685 0.666 0.586 0.605 0.676 0.654 0.674 0.677
0 50 0.874 0.866 0.828 0.807 0.878 0.869 0.856 0.875
0 100 0.996 0.995 0.991 0.979 0.996 0.994 0.992 0.996
0.22 30 0.646 0.632 0.567 0.572 0.657 0.663 0.659 0.684
0.22 50 0.834 0.826 0.768 0.766 0.850 0.831 0.816 0.814
0.22 100 0.992 0.990 0.976 0.975 0.993 0.990 0.982 0.979
ED 0 30 0.393 0.369 0.351 0.384 0.458 0.458 0.531 0.596
0 50 0.615 0.571 0.579 0.597 0.661 0.646 0.679 0.708
0 100 0.906 0.910 0.904 0.914 0.920 0.924 0.937 0.942
0.22 30 0.369 0.343 0.347 0.365 0.429 0.422 0.501 0.544
0.22 50 0.597 0.343 0.560 0.589 0.652 0.422 0.676 0.699
0.22 100 0.887 0.877 0.896 0.897 0.910 0.901 0.923 0.925
LD 0 30 0.472 0.458 0.392 0.383 0.438 0.442 0.398 0.400
0 50 0.730 0.718 0.644 0.632 0.688 0.683 0.634 0.615
0 100 0.963 0.957 0.926 0.914 0.956 0.950 0.920 0.918
0.22 30 0.425 0.397 0.342 0.318 0.411 0.393 0.363 0.361
scenarios. We could generally recommend the Tippett transform with some caution on small number of strata where, to achieve a regular behaviour, it is however suffi-cient to start from a percentile higher than the 10th. The Fisher test is very similar, slightly better under propor-tional hazards, but worst in the crossing hazards setting. Differently from what found in a non permutation test by Klein et al. [12], we do not observe a general super-iority of the complementary log-log transform of sur-vival on sursur-vival, as distance measure, except in the early distance scenario. Actually, the Tippett transform behaves well using the survival distance even with small number of strata. While a standardized survival differ-ence could have been considered, the expected gain in performance would not counterbalance the heavy add-itional computational effort needed. This because the standard error of the difference is based on a bootstrap estimate that should account for the complex form of dependence possibly induced by matching, that cannot be easily specified.
In the context of non matched data (or no strata effect), the proposed multivariate permutation test maintains a good performance for survival data com-parison. Indeed, this approach could be useful even in non matched data in the presence of departures from the proportional hazards assumption, especially cross-ing hazards, where an overall test is still matter of development.
Conditions for the applicability of this approach are very mild. The appropriate application of the multivari-ate permutation testing approach relies on the assump-tions on censoring being independent from the failure process and treatment within strata. While this could be considered a weakness, it is indeed the usual assumption which applies in survival when a correct study planning is adopted. The test relies also on the assumption of ex-changeability under the null. In our context, where per-mutations are within strata, this latter assumption is reasonable due to matching. Finally, the test can easily
Table 2 A-B - Simulation results under H1of the multivariate permutation (two-sided) Fisher (A) and Tippett (B) tests
(Continued)
0.22 100 0.930 0.924 0.871 0.864 0.927 0.920 0.874 0.858
CH 0 30 0.356 0.418 0.475 0.521 0.183 0.155 0.191 0.163
0 50 0.584 0.636 0.700 0.729 0.380 0.335 0.374 0.347
0 100 0.920 0.931 0.951 0.971 0.854 0.842 0.851 0.848
0.22 30 0.335 0.399 0.433 0.484 0.176 0.165 0.185 0.163
0.22 50 0.560 0.626 0.663 0.722 0.408 0.358 0.385 0.348
0.22 100 0.887 0.921 0.953 0.963 0.830 0.806 0.850 0.836
* PH=Proportional Hazards, ED=Early Difference, LD=Late Difference, CH=Crossing Hazards The simulations are based on first order statistics TSi
1 or TLSi
1
under different scenarios and for different choices of time points (4 or 8 fixed or 9 points at 10-90th percentiles (perc) or 80% of all the observed event times (all)). In the body of the table, values in bold identify the strongest results.
Table 3 Simulation results under H0and H1of the tests
used for comparative purposes
Scenario* Strata
effect (w)
N. of strata (k)
Under H0 Under H1
(1) (2) (3) (1) (2) (3)
PH 0 30 0.042 0.043 0.049 0.660 0.734 0.770
0 50 0.042 0.043 0.051 0.867 0.923 0.938
0 100 0.054 0.050 0.060 0.995 0.999 1.000
0.22 30 0.044 0.052 0.053 0.635 0.731 0.726
0.22 50 0.057 0.051 0.058 0.827 0.898 0.903
0.22 100 0.056 0.054 0.053 0.986 0.997 0.996
ED 0 30 0.053 0.061 0.064 0.207 0.189 0.216
0 50 0.061 0.067 0.071 0.317 0.262 0.310
0 100 0.049 0.052 0.061 0.620 0.531 0.571
0.22 30 0.046 0.051 0.056 0.204 0.169 0.166
0.22 50 0.037 0.044 0.045 0.292 0.237 0.253
0.22 100 0.051 0.048 0.053 0.596 0.501 0.510
LD 0 30 0.042 0.046 0.054 0.384 0.473 0.520
0 50 0.053 0.059 0.060 0.600 0.731 0.775
0 100 0.052 0.052 0.118 0.863 0.965 0.971
0.22 30 0.049 0.065 0.070 0.338 0.454 0.470
0.22 50 0.046 0.051 0.051 0.553 0.707 0.705
0.22 100 0.051 0.056 0.051 0.816 0.949 0.947
CH 0 30 0.062 0.070 0.076 0.076 0.078 0.082
0 50 0.045 0.045 0.046 0.087 0.119 0.119
0 100 0.041 0.045 0.048 0.095 0.174 0.662
0.22 30 0.046 0.043 0.049 0.079 0.091 0.083
0.22 50 0.040 0.042 0.039 0.101 0.142 0.138
0.22 100 0.063 0.056 0.064 0.116 0.233 0.233
* PH=Proportional Hazards, ED=Early Difference, LD=Late Difference, CH=Crossing Hazards.
be extended to more than one subject of the experimen-tal arm in each stratum, modifying the weighting scheme of the Kaplan-Meier estimator of survival.
Other permutation tests were not suitable for exten-sion to this context. Specifically, the proposals of both Pesarin-Salmaso [5] and of Heller-Venkatraman [8] do not account for stratified and possibly correlated data; the approach of Sun and Sherman [9] needs relatively large strata of independent observations, and the versa-tile test of Shih and Fay [10], while dealing with highly stratified matched data, behaves similarly to the log-rank
test or its stratified version, depending on the level of inter-strata heterogeneity.
Conclusions
In conclusion, our approach is different from other per-mutation tests proposed for survival analysis [8-10], as it relies on the multivariate permutation approach origin-ally introduced by Pesarin [4]. It is recommended in the highly stratified context of matched data where it is proven by simulations to be at least equal or superior to the stratified log-rank test, the modified log-rank test for highly stratified data and a Cox model with robust vari-ance estimate. Preference to this test should be definitely given when the proportional hazards assumption does not hold, even in non matched data. As a general indica-tion, we would suggest the application on survival differ-ences at fixed time points for the first order test and the Tippett transform for the global combining function. This test requires some computational effort, but it is, in our experience, quite feasible with ad-hoc routines (one in fortran, as well as a function in R, can be provided by the authors upon request).
Abbreviations
ALL: Acute lymphoblastic leukaemia; BMT: Bone Marrow Transplantation; PH: Proportional Hazards; ED: Early Difference; LD: Late Difference; CH: Crossing Hazards.
Competing interests
The authors declare that they have no competing interests.
Disease Free Survival
5
0.0
0.2
0.4
0.6
0.8
1.0
Years Transplant (n=30)
Chemotherapy (n=130)
30 14 9
0 1 2 3 4
7 3 3
130 77 51 39 36 28
(12)
(37) (15) (4) (1)
Pts at risk (events): BMT
Chemo
Figure 2Disease free survival curves of transplanted patients (n=30) and matched chemotherapy controls (n=130).The estimates are calculated according to standard Kaplan-Meier and to the weighted version of Kaplan-Meier, respectively.
Table 4 Results of different multivariate permutation (two-sided) tests applied to the application
Time points strategy
N. of time points (years)
Global p-value
TSF2 TLSF2 TST2 TLST2
fixed 4 (0.5,1,2,3) 0.387 0.375 0.263 0.245
fixed 4 (1,1.5,2,3) 0.348 0.338 0.225 0.212
fixed 4 (1,2,3,4) 0.232 0.221 0.213 0.199
perc 9 (0.16-1.74)* 0.665 0.675 0.515 0.486
all 52 (0.19-1.71)* 0.799 0.829 0.630 0.579
* min and max time points.
Results of the comparison of Disease Free Survival (DFS) curves of
Authors’contributions
SG performed the simulation studies and drafted the manuscript. MGV supervised the analyses and contributed to the manuscript. All authors read and approved the final manuscript.
Acknowledgements
We are grateful to Prof. David Glidden and Prof. Fortunato Pesarin for their precious suggestions. We are also indebted with the two reviewers for the valuable comments that certainly improved the manuscript.This research was partially supported by a grant from the Associazione Italiana Ricerca Cancro (AIRC IG 5017) and the European Commission (ENCCA Project: FP7-HEALTH-F2-2011 261474).
Received: 19 September 2012 Accepted: 4 February 2013 Published: 11 February 2013
References
1. Schoenfeld DA, Tsiatis AA:A modified log-rank test for highly stratified data.Biometrika1987,74:167–175.
2. Galimberti S, Sasieni P, Valsecchi MG:A weighted Kaplan-Meier estimator for matched data with application to the comparison of chemotherapy and bone-marrow transplant in leukemia.Stat Med2002,21:3847–3864. 3. Logan BR, Klein JP, Zhang MJ:Comparing treatments in the presence of crossing survival curves: an application to bone marrow transplantation.
Biometrics2008,64:733–740.
4. Pesarin F:Multivariate Permutation Tests: With Applications in Biostatistics. Chichester: Wiley; 2001.
5. Pesarin F, Salmaso L:Permutation Tests for Complex Data: Theory, Applications and Software. Chichester: Wiley; 2010.
6. Lee EW, Wei LJ, Amato DA:Cox-type regression analysis for large numbers of small groups of correlated failure time observations. In Survival analysis: state of the art. Dordrecht: Kluwer Academic; 1992:237–247. 7. Therneau TM, Grambsch PM:Modeling Survival Data: Extending the Cox
Model. New-York: Springer-Verlag; 2000.
8. Heller G, Venkatraman ES:A bootstrap procedure to compare two survival distributions in the presence of right censored data.Biometrics1996, 52:1204–1213.
9. Sun Y, Sherman M:Some permutation tests for survival data.Biometrics 1996,52:87–97.
10. Shih JH, Fay MP:A class of permutation tests for stratified survival data.
Biometrics1999,55:1156–1162.
11. Uderzo C, Valsecchi MG, Balduzzi A, Dini G, Miniero R, Locatelli F, Rondelli R, Pession A, Arcese W, Bacigalupo A, Polchi P, Andolina M, Messina C, Conter V, Aricò M, Galimberti S, Masera G:Allogeneic bone marrow
transplantation versus chemotherapy in high-risk childhood acute lymphoblastic leukemia in first remission.Br J Haematol1997,96:387–394. 12. Klein JP, Logan B, Harhoff M, Andersen PK:Analyzing survival curves at a
fixed point in time.Stat Med2007,26:4505–4519.
13. Westfall PH, Young SS:Resampling-Based Multiple Testing: Examples and Methods for P-value Adjustment. New-York: Wiley; 1993.
doi:10.1186/1471-2288-13-16
Cite this article as:Galimberti and Valsecchi:Multivariate permutation test to compare survival curves for matched data.BMC Medical Research
Methodology201313:16.
Submit your next manuscript to BioMed Central and take full advantage of:
• Convenient online submission
• Thorough peer review
• No space constraints or color figure charges
• Immediate publication on acceptance
• Inclusion in PubMed, CAS, Scopus and Google Scholar
• Research which is freely available for redistribution