R E S E A R C H A R T I C L E
Open Access
White matter changes in chronic and
episodic migraine: a diffusion tensor
imaging study
Álvaro Planchuelo-Gómez
1, David García-Azorín
2, Ángel L. Guerrero
2,3,4*, Santiago Aja-Fernández
1,
Margarita Rodríguez
5and Rodrigo de Luis-García
1Abstract
Background:White matter alterations have been observed in patients with migraine. However, no microstructural white matter alterations have been found particularly in episodic or chronic migraine patients, and there is limited research focused on the comparison between these two groups of migraine patients.
Methods:Fifty-one healthy controls, 55 episodic migraine patients and 57 chronic migraine patients were recruited and underwent brain T1-weighted and diffusion-weighted MRI acquisition. Using Tract-Based Spatial Statistics (TBSS), fractional anisotropy, mean diffusivity, radial diffusivity and axial diffusivity were compared between the different groups. On the one hand, all migraine patients were compared against healthy controls. On the other hand, patients from each migraine group were compared between them and also against healthy controls. Correlation analysis between clinical features (duration of migraine in years, time from onset of chronic migraine in months, where applicable, and headache and migraine frequency, where applicable) and Diffusion Tensor Imaging measures was performed.
Results:Fifty healthy controls, 54 episodic migraine and 56 chronic migraine patients were finally included in the analysis. Significant decreased axial diffusivity (p< .05 false discovery rate and by number of contrasts corrected) was found in chronic migraine compared to episodic migraine in 38 white matter regions from the Johns Hopkins University ICBM-DTI-81 White-Matter Atlas. Significant positive correlation was found between time from onset of chronic migraine and mean fractional anisotropy in the bilateral external capsule, and negative correlation between time from onset of chronic migraine and mean radial diffusivity in the bilateral external capsule.
Conclusions:These findings suggest global white matter structural differences between episodic migraine and chronic migraine. Patients with chronic migraine could present axonal integrity impairment in the first months of chronic migraine with respect to episodic migraine patients. White matter changes after the onset of chronic migraine might reflect a set of maladaptive plastic changes.
Keywords:Migraine, Chronic migraine, Diffusion tensor imaging, Magnetic resonance imaging (MRI), Tract-based spatial statistics
© The Author(s). 2019Open AccessThis article is distributed under the terms of the Creative Commons Attribution 4.0 International License (http://creativecommons.org/licenses/by/4.0/), which permits unrestricted use, distribution, and reproduction in any medium, provided you give appropriate credit to the original author(s) and the source, provide a link to the Creative Commons license, and indicate if changes were made.
* Correspondence:gueneurol@gmail.com
2Headache Unit, Department of Neurology, Hospital Clínico Universitario de
Valladolid, Avenida Ramón y Cajal 3, 47005 Valladolid, Spain
3Institute for Biomedical Research of Salamanca (IBSAL), Salamanca, Spain
Background
According to the IIIrdedition of the International Classi-fication of Headache Disorders (ICHD-3), patients with Chronic Migraine (CM) suffer from headache during 15 or more days per month for more than 3 months, with at least eight of these days with migrainous characteris-tics [1]. Between 2 and 3% of migraine patients evolve annually from Episodic Migraine (EM) to CM [2]. Some risk factors have been associated with progression from EM to CM, but the pathophysiological mechanisms of this conversion remain to be elucidated. Moreover, EM and CM could represent either two ranges of the same entity, or two subgroups with distinctive characteristics. Previous review studies have exposed that important dis-tinctions exist along the continuum between EM and CM [3, 4], but it is not clear whether CM is a kind of more frequent EM or a distinct entity.
Magnetic Resonance Imaging (MRI) is one of the most powerful technologies available for the study of the mi-grainous brain. Among its different modalities, diffusion MRI (dMRI) is particularly well suited for the analysis of possible white matter alterations in migraine. dMRI studies have shown changes affecting the white matter in migraineurs with respect to healthy controls; these changes were mainly observed in the corpus callosum [5–11], thalamus [7, 8, 12, 13], thalamic radiation [7–9,
14,15] and cingulate gyrus [9,10,15–17].
Some studies using dMRI have focused on migraine with and without aura. Even though significant differ-ences have been found [10, 18], using MRI information it remains unclear whether migraine with and without aura area are actually two distinct entities, the manifesta-tions of the same pathophysiological substrate on two different phenotypes [19, 20], or even whether aura can be better defined as a migraine phase, but not a category such as chronic and episodic migraine [21].
Some other studies have employed dMRI to investigate CM. To the best of our knowledge, however, only one study by Neeb et al. searched for possible differences be-tween patients with EM and CM, not finding any signifi-cant differences [22]. Other studies compared chronic migraine patients with healthy controls [16] or mixed EM and CM patients in order to compare migraine pa-tients and controls [14]. Previous studies alternatively used T1-weighted MRI images [23, 24] and functional MRI [25], respectively, to compare possible differences between patients with CM and EM. These studies de-scribed reduced grey matter volume in CM compared to EM [23] and more activity in CM compared to EM patients with headaches during the scanning in the anterior hypothalamus [25].
The present study performs a detailed comparison of the white matter in EM, CM and healthy controls over a large cohort of subjects, using dMRI data. We hypothesised
that there could be white matter structural differences be-tween CM and EM patients, although no significant differ-ences were found in a previous study [22]. In our study, we included a considerably higher number of patients and con-trols compared to that study. Our goals are to:
1. Investigate whether there are significant differences between CM and EM, and between these groups and healthy controls. To that end, TBSS [26] was employed as dMRI analysis technique.
2. Examine how white matter descriptors based on dMRI relate to clinical features in migraine patients. To that end, a correlation analysis between dMRI parameters and variables such as duration of migraine and time from onset of CM was performed.
Materials and methods
Participants
hospital and University colleagues and advertisements in these facilities by convenience sampling and snowball sampling.
For all patients, sociodemographic and clinical data were collected, including the duration of migraine dis-ease (years), headache and migraine frequency (days per month) and time from the onset of chronic migraine (months) when applicable. The intake of symptomatic medication, i.e., combination of analgesics and triptan, was considered to verify if patients fulfilled criteria of acute medication overuse (intake at 10 or more days per month). Presence of aura was drawn.
The local Ethics Committee of Hospital Clínico Uni-versitario de Valladolid approved the study (PI: 14–197). All participants read and signed a written consent form prior to their participation.
MRI acquisition
Images were acquired for migraine patients after at least 24 h from the last migraine attack. High-resolution 3D T1-weighted and diffusion-weighted MRI data were ac-quired using a Philips Achieva 3 T MRI unit (Philips Healthcare, Best, The Netherlands) with a 32-channel head coil in the MRI facility at the Universidad de Valla-dolid (VallaValla-dolid, Spain).
For the anatomical T1-weighted images, the following acquisition parameters were used: Turbo Field Echo (TFE) sequence, repetition time (TR) = 8.1 ms, echo time (TE) = 3.7 ms, flip angle = 8°, 256 × 256 matrix size, 1 × 1 × 1 mm3 of spatial resolution and 160 slices covering the whole brain.
Diffusion-weighted images (DWI) were acquired using the next parameters: TR = 9000 ms, TE = 86 ms, flip angle = 90°, 61 gradient directions, one baseline volume, b-value = 1000 s/mm2, 128 × 128 matrix size, 2 × 2 × 2 mm3 of spatial resolution and 66 axial slices covering the whole brain.
T1 and diffusion-weighted scans were acquired during the same session, starting with the T1 scan followed by the diffusion-weighted scan, between May 2014 and July 2018. Total acquisition time for each subject was around 18 min.
Image processing
MR images were processed before carrying out the stat-istical analysis using TBSS [26]. For the TBSS analysis, four Diffusion Tensor Imaging (DTI) measures were ob-tained: Fractional Anisotropy (FA), Mean Diffusivity (MD), Radial Diffusivity (RD) and Axial Diffusivity (AD). In a nutshell, FA reflects the degree of directionality of water diffusivity, MD is a global measure of water diffu-sion, RD quantifies the diffusion perpendicular to the principal direction and AD is the diffusion in the main direction of the white matter fibres [30].
Prior to the obtention of the four DTI measures, di-verse preprocessing procedures were implemented on the DWI data. Diffusion-weighted images were denoised, using“dwidenoise”tool from MRtrix [31,32], eddy cur-rents and motion corrected, using “dwipreproc” tool from MRtrix [33], and B1 field inhomogeneity corrected, using “dwibiascorrect” tool with the “-fast” option from MRtrix [34,35].
Once the DWI images were preprocessed, a whole brain mask for each image was generated using “ dwi2-mask”tool from MRtrix [36] and, next, diffusion tensors at each voxel were estimated using the“dtifit”tool from FSL [37], also obtaining FA, MD and AD maps. RD was manually calculated by obtaining the mean of the second and the third eigenvalues, which were also previously computed with“dtifit”.
For the TBSS method, all participants’ FA images were nonlinearly registered using the FNIRT tool from FSL to a template of the averaged FA images (FMRIB-58) in Montreal Neurological Institute (MNI) space; the FNIRT tool uses a b-spline repre-sentation of the registration warp field [38]. After registration, a mean FA image was generated and thinned to create a mean FA skeleton of white mat-ter tracts using a FA value of .2 as threshold to dis-tinguish white from grey matter. Then, each subject’s aligned FA images were projected onto the mean FA skeleton. In a similar way, the TBSS process was repeated for MD, AD and RD, using the protocol devoted for non-FA images. To identify the white matter tracts, the Johns Hopkins University ICBM-DTI-81 White-Matter Labels Atlas [39, 40] provided in the FSL toolbox was used. However, this atlas does not cover the whole white matter across brain, so we also employed the Johns Hopkins Uni-versity White-Matter Tractography Atlas [41], which contains a lower number of tracts but covers areas not included in the other atlas. The minimum vol-ume to consider significant results in a region was set to 30 mm3. It must be noted that, because we use an image of 1 mm3 in the MNI space to identify the regions, the volume in mm3 is equal to the num-ber of voxels. Moreover, when we extract the signifi-cant results in a region, we consider all the significant voxels from that region, from one or more clusters.
Statistical analysis
group variance); a type 1-error rate of 1% and 80% power and anticipating a proportion of 10% of lost pa-tients. The expected sample size was 167 participants.
Kolmogorov-Smirnov and Levene’s Test for equality of variances tests were used to assess normality and homo-geneity of variance in age and duration of migraine in years. To test for significant differences in the age of the three groups, a one-way ANOVA was used if the null hypothesis in Kolmogorov-Smirnov and Levene tests was not rejected; otherwise, Kruskal-Wallis test was employed. To test for significant gender differences, a chi-square test was used. To compare continuous clin-ical features between migraine patients (i.e., duration of migraine history in years for both groups of patients and time from onset of chronic migraine in months for chronic migraine patients), a two-tailed unpaired t-test was used if the null hypothesis in Kolmogorov-Smirnov and Levene tests was not rejected; otherwise, Mann-Whitney U test was employed. To compare categorical clinical features between migraine patients, Fisher’s exact test was employed.
We executed group-wise comparisons of all migraineurs vs. healthy controls, CM vs. EM, EM vs. healthy controls, and CM vs. healthy controls. The voxel-wise TBSS differ-ences in FA, MD, AD and RD values of white matter be-tween the different groups were tested using a permutation-based inference tool by nonparametric statis-tics called “randomise”, implemented in FSL, with the threshold-free cluster enhancement (TFCE) option [42,43]. Five thousand permutations were set to allow robust statis-tical inference and the significance threshold for intergroup differences wasp< .05 after correcting for family wise error (FWE) applying the TFCE option. Additional clinical covar-iates were added to the comparisons in the cases where sig-nificant differences were found. These covariates were analysed individually to evaluate the individual effect of each covariate. In the case of presence of aura, we repeated the original TBSS analysis excluding the patients with mi-graine with aura. None of the design matrices included dur-ation of migraine and time from onset of CM simultaneously as covariates due to collinearity. Time from onset of CM was also included as a covariate (only in com-parisons with CM) because it may correct the results in CM patients in a more meaningful way than the total dur-ation of migraine.
In the cases where significant differences were found, we performed a post-hoc analysis. We applied a false discovery rate (FDR) correction, using the “fdr” command from FSL, to the TFCE uncorrected
p-values. The fdr command provides the uncorrected
p-value which sets the level of statistical significance after the FDR correction. To correct for number of contrasts in each case, the final level of statistical sig-nificance is equal to the uncorrected p-value from the
previous step divided by the number of comparisons (Bonferroni correction).
Effect size was computed using Cohen’s d value in re-gions with significant results from the first analysis (FWE-corrected). For every comparison, the mean value of the “most disabled” group was subtracted from the mean value of the “least disabled” or the control group. In the comparisons between both types of migraine, CM is considered the most disabled group, and EM the least disabled group.
To study the relationship between clinical parame-ters and DTI measures, Spearman’s rank correlation coefficient was employed in a ROI-based correlation analysis. Duration of the migraine in both types of mi-graine patients, time from onset of CM in chronic migraineurs, and headache and migraine frequency for both types of migraine patients were the analysed clin-ical parameters. It must be clarified that we obtained correlation values in CM and EM patients separately, in order to assess differences or trends within each type of migraine. Our intention was to determine the possible effect of headache or migraine frequency, in the specific range of episodic or chronic migraine, and the possible relationship with time, with special atten-tion to the time from onset of CM. To obtain individ-ual label maps for each subject, the inverse warp fields of the FA images to the MNI image transformation from the TBSS procedure were computed and applied to the Johns Hopkins University ICBM-DTI-81 White Matter Atlas. The ROIs that were selected for the cor-relation analysis were those for which significant dif-ferences were found between at least two groups in any diffusion parameter in the TBSS analysis. All DTI measures (FA, MD, RD and AD) were considered for the correlation analysis. We used all DTI measures to avoid a possible loss of complementary information given by each parameter in the assessment of differ-ences within CM or EM. To correct for multiple com-parisons, the Benjamini-Hochberg [44] FDR procedure was applied, and, after this correction, the level of stat-istical significance was set atp< .05.
Results
summarised in Table 1. Significant differences were found in duration of migraine history in years be-tween the two migraine groups and, as expected, in headache and migraine frequency between the mi-graine groups.
Considering the significant differences in duration of migraine history between episodic and chronic migraine patients (Table 1), TBSS analysis was repeated including the duration of migraine history as a covariate, as men-tioned in the Statistical Analysis section. Presence of aura was added as an additional covariate to duration of migraine history in a posterior analysis. In the case of CM patients, the TBSS analysis was additionally accom-plished including the time from onset of CM as a covari-ate. This covariate was included in a separate analysis from the one with duration of migraine history due to collinearity, as mentioned previously in the Statistical Analysis section.
TBSS analysis
Results uncorrected for covariates
No significant differences were found in any of the diffu-sion indices (FA, MD, RD and AD) between all migrai-neurs and HC. Dividing all migraimigrai-neurs into EM and CM, no significant differences were found with respect to HC. With regard to the comparison between CM and EM, no significant differences were found in FA, MD or RD. How-ever, significant lower AD values were found in CM com-pared to EM in widespread locations across the white matter. These locations correspond to 38 different regions from the ICBM-DTI-81 White Matter Atlas, and six re-gions from the White Matter Tractography Atlas, and are
shown in Tables2 and 3and Fig.1. The FWE-corrected results can be seen in Additional file 1: Figure S1 and Table S1.
In the case of the analysis including only patients with migraine without aura, no new significant results were observed. As in the original sample, significant lower AD values were found in CM compared to EM (FWE-cor-rected results), but in 10 regions from the ICBM-DTI-81 White Matter Atlas, all of them included in the 38 re-gions with significant differences. The FWE-corrected results excluding migraine with aura patients can be seen in Additional file1: Table S2.
Results corrected for covariates
After the post-hoc analysis, significant lower AD values were found in CM compared to EM in six re-gions from the ICBM-DTI-81 White Matter Atlas, and one region (the right corticospinal tract) from the White-Matter Tractography Atlas, when including the time from onset of CM as a covariate. These results are shown in Tables4 and5 and Fig.1. No significant results were observed when correcting for total dur-ation of migraine or for the other DTI measures.
In the following subsections, the FWE-corrected results for the diverse covariates are shown.
Results corrected for duration of migraine history
In-cluding the duration of migraine history as a covariate, no significant differences were found for FA, MD or RD. Sig-nificant decreased AD values in CM with respect to EM were found only in the middle cerebellar peduncle (675 mm3 with p< .05 FWE-corrected, minimum p-value =
.028), but other 26 regions remained with p< .1 FWE-corrected (Additional file1: Table S3). Also, significant in-creased AD values in EM with respect to HC were found in seven regions from the left hemisphere (Additional file 1: Table S4). These results can be seen in Additional file 1: Figure S2. No significant differences were found between all migraineurs together and HC, or between CM and HC.
Adding the presence of aura as a covariate, significant increased AD values in EM with respect to HC were found in seven regions from the left hemisphere. These seven regions were the same regions that showed signifi-cant differences in the analysis including only the dur-ation of migraine history as a covariate. No significant differences were found for FA, MD or RD.
Results corrected for time from onset of CM In the
additional comparisons for CM patients, including time from onset of CM as a covariate, no significant differences were found for MD or RD. Significant decreased AD values in CM with respect to EM were found in 23 regions with p< .05 FWE-corrected (Additional file 1: Table S5). Significant decreased Table 1Clinical and demographic characteristics of healthy
controls (HC), episodic migraine (EM) and chronic migraine (CM)
HC (n= 50)
EM (n= 54)
CM (n= 56)
Statistical test
Gender, male/female 11/39 (22/78%) 9/45 (17/83%) 6/50 (11/89%) χ 2
(2,N= 160)=
2.48,p= .29†
Age (years) 36.1 ±
13.2
37.1 ± 8.2
38.1 ±
8.7 χ
2(2) = 2.85,
p= .24‡ Duration of migraine
history (years)
14.1 ± 11.1
19.6 ± 10.4
t(108)=−2.7,
p= .008§ Time from onset of
chronic migraine (months) 24.5 ± 32.9 Headache frequency (days/month)
3.6 ± 1.9 23.3 ± 6.3
U = 44.0,
p< .001¶
Migraine frequency (days/month)
3.6 ± 1.9 13.9 ± 6.9
U = 108.5,
p< .001¶
Overusing medication
0 (0%) 42 (75%) p< .001⁑
Aura 9 (17%) 1 (2%) p= .007⁑
†Chi-square test.‡Kruskal-Wallis test.§
Two-tailed, unpaired Student’s t-test. ¶
FA values in CM compared to HC were found in 15 regions, most of them from the right hemisphere (Additional file 1: Table S6). These results are shown in Additional file 1: Figure S3.
Effect size
When comparing between CM and EM Axial Diffusivity values, all Cohen’s d values (except for left fornix) were negative, which means that AD values were lower in CM. For the middle cerebellar peduncle, left external capsule and right sagittal stratum, the Cohen’s d abso-lute values were equal or greater than .5, a medium ef-fect size according to [45]. A very similar trend, but with lower Cohen’s d absolute values, was found in CM with respect to HC. In the comparison between EM and HC, Cohen’s d value was positive in almost all regions, i.e., AD values were higher in EM with respect to HC. In the pontine crossing tract, a medium effect size was ob-tained (d = .59). These results are depicted in Additional file 1: Table S7 and Figures S4 and S5. Results for the other DTI measures can be seen in Additional file 1: Figures S6, S7, S8, S9, S10 and S11.
Table 3White matter regions where significant decreased AD values were found in CM compared to EM using the Johns Hopkins University White-Matter Tractography Atlas
White Matter tract Minimump-value (uncorrected)
Volume (mm3)
MNI peak coordinate (mm), (x,y,z)
Anterior thalamic radiation L/R
.0006/.0008 36/39 (−20,17,0) / (9,-30,-15)
Corticospinal tract L/R
.0012/.0012 152/165 (−21,-21,2) / (10,-24,-25)
Forceps major .0010 126 (−17,-85,7)
Inferior longitudinal fasciculus R
.0004 49 (40,-35,-14)
The column Volume represents the volume from the atlas region with significant differences (FDR-corrected and number of contrasts corrected). The maximum significant uncorrected p-value after corrections was .0032. No regions with volume equal or lower than 30 mm3
were included in this Table
LLeft,RRight
Table 2White matter regions where significant decreased AD values were found in CM compared to EM
White Matter tract Minimump-value (uncorrected) Volume (mm3) MNI peak coordinate (mm), (x,y,z)
Middle cerebellar peduncle .0002 2263 (−20,-55,-32)
Superior cerebellar peduncle R/L .0002/.0002 145/137 (6,-31,-19) / (−6,-50,-27)
Inferior cerebellar peduncle R/L .0002/.0002 81/118 (9,-42,-38) / (−13,-45,-31)
Superior longitudinal fasciculus R/L .0004/.0004 565/821 (37,-48,14) / (−37,-50,15)
Genu of corpus callosum .0006 154 (−8,27,1)
Body of corpus callosum .0016 74 (−11,-19,30)
Splenium of corpus callosum .0006 203 (21,-48,10)
Anterior corona radiata R/L .0014/.0004 105/527 (19,24,-10) / (−18,25,-8)
Superior corona radiata R/L .0012/.0014 253/87 (21,-9,34) / (−27,-10,25)
Posterior corona radiata R/L .0010/.0010 75/140 (28,-40,21) / (−30,-52,22)
External capsule R/L .0006/.0004 400/640 (33,-3,3) / (−22,16,-12)
Posterior limb of internal capsule R/L .0010/.0008 372/400 (17,-4,8) / (−18,-1,10)
Retrolenticular part of internal capsule R/L .0012/.0012 173/161 (30,-24,2) / (−24,-24,2)
Anterior limb of internal capsule R/L .0006/.0004 163/270 (18,17,-3) / (−14,8,0)
Sagittal stratum R/L .0002/.0006 418/316 (40,-36,-13) / (−40,-15,-14)
Posterior thalamic radiation R/L .0004/.0002 333/254 (34,-56,3) / (−38,-52,3)
Cerebral peduncle R/L .0004/.0002 225/257 (11,-22,-21) / (−10,-13,-12)
Corticospinal tract R/L .0002/.0004 107/164 (10,-22,-23) / (−7,-19,-24)
Medial lemniscus R/L .0002/.0002 83/103 (5,-35,-37) / (−2,-37,-30)
Pontine crossing tract .0002 89 (7,-29,-25)
Fornix (cres) R/L .0004/.0006 71/41 (33,-8,-17) / (−34,-11,-16)
Cingulum (hippocampus) L .0002 87 (−17,-43,-2)
The column Volume represents the volume from the atlas region with significant differences (FDR-corrected and number of contrasts corrected). The maximum significant uncorrected p-value after corrections was .0032. No regions with volume equal or lower than 30 mm3
were included in this Table. Only regions with FWE-correctedp< .05 are included
A summary of these results can be seen in Table6. Correlation analysis
After multiple comparisons correction, ROI-based signifi-cant positive correlations between time from onset of chronic migraine and mean FA in the right (ρ= .420,
p= .001) and left (ρ= .439,p< .001) external capsule were found. Significant negative correlations between time from onset of chronic migraine and mean RD in the right (ρ= −.427, p= .001) and left (ρ=−.439, p< .001) external capsule were found. These results can be seen in Fig.2.
No significant correlations were found neither for mean MD or mean AD, nor duration of the migraine,
headache and migraine frequency for both migraine groups in ROI-based correlation analysis.
Discussion
In a TBSS-based dMRI analysis, in relation with the first stated objective of the study, white matter structural changes in Chronic Migraine compared to Episodic Mi-graine patients were found in 38 regions when AD was considered as DTI measure. These findings suggest glo-bal white matter changes in CM compared to EM.
significant results were a subset of the regions of the ori-ginal analysis. Using only patients without aura, higher
p-values and lower number of regions with significant differences are obtained. These results suggest that the differences are caused by a loss of statistical power more than the effect of aura itself. Including duration of mi-graine history as a covariate, differences were found be-tween EM and Healthy Controls in seven regions, but they did not survive the FDR and the number of con-trasts corrections. The addition of the presence of aura as a covariate did not change the results with respect to using only the duration of migraine history as a covariate.
Additionally, including time from onset of chronic migraine as a covariate in the comparisons with CM patients, significant decreased values were found in AD between CM and EM. Decreased values were also found in FA in CM with respect to HC, but they did not sur-vive the FDR and the number of contrasts corrections.
In relation with the second objective of the study, cor-relation analysis was executed between diverse DTI mea-sures and clinical features. Significant correlations
between time from onset of chronic migraine and mean FA (positive correlation) and mean RD (negative correl-ation) in the bilateral external capsule were found.
White matter differences between both groups of migraineurs were not previously found by Neeb et al. in the only study, to the best of our knowledge, which assessed patients with chronic and episodic migraine using DTI [22]. In the present study, however, a consid-erably bigger cohort was included when compared to that study, and our participants were considerably youn-ger. The influence of age in the white matter diffusion is well-known and has been extensively assessed. The most common pattern is to find decreased FA and increased RD values in older people, while the AD pattern is un-clear [30, 46]. Considering the aging-effect, altered DTI measures in healthy people might reduce the diffusion differences between patients and controls in older subjects.
Differences between the two migraine groups were found using AD as a DTI measure. It is known, however, that rela-tionships between DTI-derived parameter changes and spe-cific microstructure alterations are difficult to establish, and therefore results must be interpreted carefully. Winklewski et al. interpreted reduced AD values, as we found in CM compared to EM, as the beginning of demyelination [47]. This reduction, nevertheless, could be ineffective to detect prolonged demyelination [47]. Nonetheless, based on studies in mice, a review study by Alexander et al. linked AD more to axonal damage than demyelination [48]. In a posterior study also in mice, Sun et al. established a relationship be-tween reduced AD values and axonal damage, and bebe-tween increased RD values and myelin damage, confirmed with immunohistochemistry examinations [49]. In a human study, Pierpaoli et al. found decreased AD in primary lesions and in regions with secondary white matter degeneration [50]. This axonal loss hypothesis has also been exposed for Alzheimer’s disease [51] and migraine patients [7].
Previous whole-brain TBSS studies found white matter differences between migraine patients and healthy con-trols [6–11, 52]. Most of these studies report decreased FA in migraine patients with respect to healthy controls, but one study showed increased FA in migraineurs with respect to healthy controls; in this study, Messina et al. analysed paediatric patients [9], which could explain the difference. Decreased FA can be caused by factors like de-myelination, lower packing density or different membrane permeability [53] and is modulated by characteristics such as axon diameter and packing or fibre organization [54].
Results for MD and RD in the literature regarding mi-graine using TBSS are unclear. On the one hand, increased MD and RD values in migraineurs with respect to healthy controls were obtained in [11,52], but on the other hand, decreased values were reported in [7–9]. Results obtained with methods different than TBSS, such as ROI-based Table 5White matter regions from the Johns Hopkins
University White-Matter Tractography Atlas for which significant decreased AD values were found in CM compared to EM considering the effect of time from onset of CM
White Matter tract
Minimump-value (uncorrected)
Volume (mm3)
MNI peak coordinate (mm), (x,y,z)
Corticospinal tract R
.0012 31 (4,-35,-16)
The column Volume represents the volume from the atlas region with significant differences (FDR-corrected and number of contrasts). The maximum significant uncorrected p-value after corrections was .0020. No regions with volume equal or lower than 30 mm3
were included in this Table
RRight
Table 4White matter regions from the ICBM-DTI-81 White Matter Atlas for which significant decreased AD values were found in CM compared to EM considering the effect of time from onset of CM
White Matter tract Minimump-value (uncorrected)
Volume (mm3)
MNI peak
coordinate (mm), (x,y,z)
Middle cerebellar peduncle
.0004 1286 (−16,-52,-30)
Superior cerebellar peduncle R/L
.0004/.0002 97/109 (9,-50,-30) / (−6,-42,-26)
Inferior cerebellar peduncle L
.0006 55 (−6,-53,-24)
External capsule L .0012 34 (−33,-10,1)
Pontine crossing tract
.0006 39 (0,-23,-24)
The column Volume represents the volume from the atlas region with significant differences (FDR-corrected and number of contrasts corrected). The maximum significant uncorrected p-value after corrections was .0020. No regions with volume equal or lower than 30 mm3were included in this Table. Only regions with FWE-correctedp< .05 are included
Table 6Summary of white matter regions where significant differences were found in all comparisons
White Matter tract EM > HC* CM < HC* CM < EM
Middle cerebellar peduncle NS NS AD
AD + durM*
AD + onsCM
Superior cerebellar peduncle R/L NS FA + onsCM (R) AD
AD + durM* (p< 0.1)
AD + onsCM
Inferior cerebellar peduncle R/L NS NS AD
AD + durM* (p< 0.1)
AD + onsCM (L)
Superior longitudinal fasciculus R/L NS NS AD
AD + durM* (p< 0.1)
AD + onsCM* (R)
Genu of corpus callosum NS NS AD
Body of corpus callosum NS FA + onsCM AD
AD + durM* (p< 0.1)
Splenium of corpus callosum NS FA + onsCM AD
AD + durM* (p< 0.1)
AD + onsCM*
Anterior corona radiata R/L NS FA + onsCM (R) AD
Superior corona radiata R/L AD + durM (L) FA + onsCM (R) AD
AD + durM* (p< 0.1)
AD + onsCM*
Posterior corona radiata R/L NS FA + onsCM (R) AD
AD + durM* (L,p< 0.1)
AD + onsCM* (R)
External capsule R/L AD + durM (L) FA + onsCM (R) AD
AD + durM* (p< 0.1)
AD + onsCM (L; R*)
Posterior limb of internal capsule R/L AD + durM (L) FA + onsCM (R) AD
AD + durM* (p< 0.1)
AD + onsCM*
Retrolenticular part of internal capsule R/L AD + durM (L) FA + onsCM (R) AD
AD + durM* (p< 0.1)
AD + onsCM*
Anterior limb of internal capsule R/L NS FA + onsCM (R) AD
Sagittal stratum R/L AD + durM (L) FA + onsCM (R) AD
AD + durM* (R,p< 0.1)
AD + onsCM* (R)
Posterior thalamic radiation R/L AD + durM (L) NS AD
AD + durM* (p< 0.1)
AD + onsCM* (R)
Cerebral peduncle R/L AD + durM (L) NS AD
AD + durM* (p< 0.1)
Table 6Summary of white matter regions where significant differences were found in all comparisons(Continued)
White Matter tract EM > HC* CM < HC* CM < EM
Corticospinal tract R/L NS NS AD
AD + durM* (p< 0.1)
AD + onsCM* (R+)
Medial lemniscus R/L NS NS AD
Pontine crossing tract NS NS AD
AD + durM* (p< 0.1)
AD + onsCM
Fornix (cres) R/L NS FA + onsCM (R) AD
AD + durM* (R)
AD + onsCM* (R)
Cingulum (hippocampus) L NS NS AD
Anterior thalamic radiation R/L NS NS AD+
Forceps major NS NS AD+
Inferior longitudinal fasciculus R NS NS AD+
The column Volume represents the volume from the atlas region with significant results. No regions with volume equal or lower than 30 mm3
were included in this Table
durMDuration of migraine as covariate,LLeft,NSNon-significant,onsCMTime from onset of CM as covariate,RRight; * = only FWE-corrected;+
= significant only in the White-Matter Tractography Atlas
analysis or tractography, showed increased MD and/or RD values in migraine patients with respect to healthy controls [13,14,18,55]. Increased RD could also be a biomarker of demyelination [47,48]. There are also studies that found no differences between migraine patients and healthy controls. These studies employed methods whole-brain such as TBSS [22,56], ROI-based analysis (ictal migraine) [57] and voxel-based whole brain comparison [58].
Interestingly, the trend when comparing AD values be-tween EM and healthy controls is inverted when com-paring CM and healthy controls or CM with respect to EM (Additional file 1: Figures S4 and S5). As previously mentioned, AD might be an indicator of axonal loss. This might indicate that the evolution from EM to CM is characterised by a loss of axonal integrity. This result also shows that, in migraine, there could be different processes of axonal behaviour involving different patho-physiological mechanisms.
In contrast to our results, some TBSS studies obtained decreased AD in migraine patients with respect to healthy controls [7–9]. Petrušić et al. also found de-creased AD in migraine with aura patients with respect to healthy controls using a tractography approach [15]. We detected the same trend, but only in CM patients. We obtained the opposite result in EM patients, when including duration of migraine as a covariate, but this result was not significant in the post-hoc analysis. In [7, 8], cohort differences (considering only the EM patients in our case), i.e., lower disease duration and higher attack frequency, with possibly high frequency EM patients in the sample of [7, 8], could explain the differences between the studies. In [9], as previously stated, paediatric patients were included in the sample by Messina et al., which could explain the difference.
The analysis of the temporal change in migraine pa-tients adds an interesting insight to the former results.
In the case of EM patients, considering the duration of migraine as a covariate, there was a lower number of re-gions with significant differences with respect to CM pa-tients. The significant difference in the duration of migraine between both groups of migraine patients could be a confounding factor in the previous results. Furthermore, significant increased AD values in EM compared to HC were observed, possibly due to more precise estimations (less variability) in the case of the values in EM patients.
These results seem to indicate a temporal evolu-tion in CM patients that reflects an adaptaevolu-tion to continuous headache attacks. In the initial months with CM (“short-term” patients), axonal integrity seems to be damaged, as suggested by decreased FA values in those patients compared to HC when in-cluding time from onset of CM as a covariate. De-creased FA values in CM patients with therapy
compared to HC, after 6 months follow-up, were re-ported previously by Gomez-Beldarrain et al. [16]. Considering these results and the decreased AD values in CM with respect to EM, it seems that in progression from EM to CM there might be a process that causes severe white matter alterations.
Later, in CM patients, a set of plastic changes as an adaptation to the frequent headaches may happen. The white matter reorganisation is suggested by posi-tive correlation between FA and time from onset of CM, and by the simultaneous negative correlation be-tween RD and time from onset of CM.
In line with our CM correlation results, Szabó et al., 2017 [10], obtained a trend showing increased FA in mi-graine with aura patients with respect to healthy con-trols. In this study, based on increased FA values, the authors hypothesised that repeated painful conditions or increased cortical excitability might cause maladaptive plastic changes in migraine with aura. Moreover, in-creased FA values were found in people with repeated stimuli in learning processes [59,60], so something simi-lar could be happening in CM patients, who suffer re-peated painful stimuli.
Regarding correlation analysis, we obtained significant correlations between time from onset of chronic mi-graine and DTI measures (FA and RD) in the bilateral external capsule, but no significant correlations were ob-tained with the duration of migraine in CM or EM patients.
The external capsule is a part of the central core, a network on top of the brainstem that includes struc-tures like the insular surface, the extreme and internal capsules, the lentiform nucleus or the thalamus [61]. The extreme and external capsules lie in anteroposter-ior disposition, and they are connected to the ante-roinferior part of the insula [61]. The lentiform nucleus is located between the external and internal capsules [61]. The internal, external and extreme cap-sules connect the insular surface, basal ganglia and thalamus to the cerebral lobes [61]. Russo et al. re-ported that, in the insula and lentiform nucleus, mi-graine patients, compared to HC, are characterised by an increased blood oxygenation level dependent re-sponse [62]. Furthermore, Borsook et al. exposed that the insula is implicated in processes related to the clinical presentation of migraine and is a“hub of activ-ity” in migraine [63]. The role of the external capsule in anteroposterior connections and in connections be-tween subcortical regions implied in migraine and cor-tical regions could be highly relevant in migraine pathogenesis, especially in Chronic Migraine.
significant positive correlation between duration of mi-graine and MD [14]. This discrepancy could be explained with methodological and cohort differences. No significant correlation between DTI measures and the external cap-sule has been previously found in migraine patients, but no correlation between time from onset of chronic mi-graine and DTI measures has been previously assessed.
In this study, high frequency EM patients (10–14 headache days per month) were excluded. This decision was made in order to avoid misclassified patients, which could mislead the analysis [28]. Compared to Neeb et al. [22], CM patients from our sample had greater headache frequency, while EM patients from our sample had lower headache frequency. This increased difference between the migraine groups, together with the larger cohort size, could be a factor explaining why we obtained significant results in the CM-EM comparison, while no significant results were obtained in [22]. However, no significant correlations were found between headache frequency and DTI measures, which could mean that headache fre-quency does not have a very relevant effect on diffusion within the EM or CM groups. In any case, a deeper spe-cific analysis, focusing on high frequency EM patients, would be needed to clarify whether this group of pa-tients is closer to the low frequency EM group or to the CM group.
There are several strengths and limitations in this study. About the strengths, this study is, to the best of
our knowledge, the white matter study with the highest number of participants simultaneously including Healthy Controls, Episodic Migraine and Chronic Migraine pa-tients. Moreover, the selection criteria of the patients allowed us to detect significant differences not found previously, especially between EM and CM patients.
About the limitations of this study, due to time constraints in the MRI acquisition process in a clin-ical setting, we acquired no T2 or T2-FLAIR MRI sequences that would be helpful to assess White Matter Hyperintensities (WMHs). Migraine has been associated with an increased risk for WMHs detected on MRI [64]; also pain in EM patients [65] and an unfavourable prognosis [66] were found to be associ-ated with the occurrence of WMHs. Considering our correlation results in CM patients and the state of the art, the WMHs analysis would have been inter-esting in this study. Medication overuse was identi-fied in an important percentage of the CM patients in our sample (75%). This might be a confounding factor, due to possible structural differences in the white matter with respect to CM patients without overuse. The exclusion of patients with anxiety or depression implies that there was no chance to as-sess possible effects of these conditions on brain structure in migraine patients. Anxiety and depres-sion are often comorbid in patients with migraine [67–69]. When MRI were acquired in the patients,
they had no attacks in the previous 24 h, but they could be in a prodromal stage, as we did control time from past, but not to the next migraine attack. Altered brain physiology and abnormal functional con-nectivity have been found in prodromal stages [70,71], so this is a possible source of bias in the results. Diagnosis of infrequent TTH in controls was done solely by history and not by using a headache diary; however, they were ex-cluded if other headache disorders were present or the fre-quency of headache in the preceding year was > 1 headache day per month or > 12 headache days per year. Finally, in the analysis of the presence of aura, the number of patients with migraine with aura was too small to add-itionally compare the changes in migraine with aura against migraine without aura.
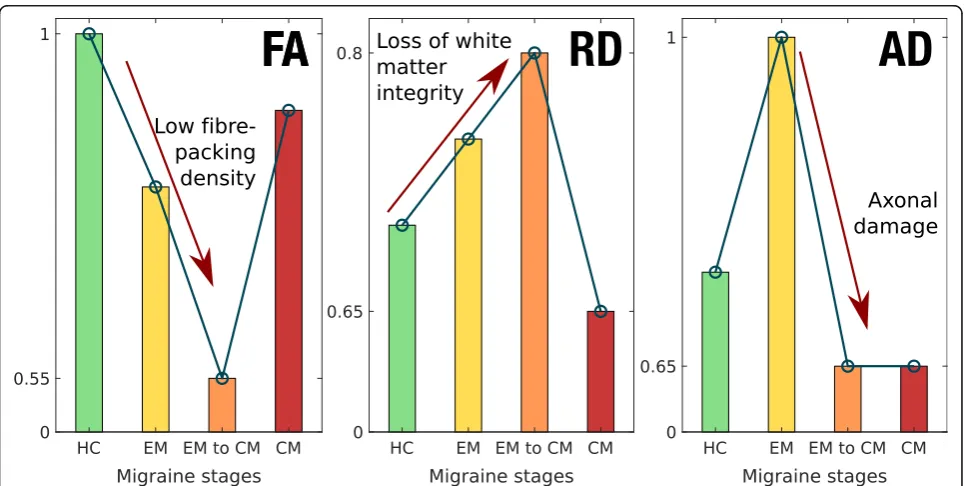
In summary, considering previous studies and our results, a hypothesis about the migraine process could be drafted that distinguishes three states or stages: EM, transition from EM to CM, and CM. In the EM state, there would be some white matter damage, pro-duced mainly by a loss of axonal integrity. Then, in the transition from EM to CM, there would be a loss of axonal integrity, but probably not led by a severe additional damage in myelin. Finally, in the CM state, there would be a series of plastic changes, as an adaptation to a continuous ictal state. Considering this evolution hypothesis, EM might involve a coexist-ence of loss of white matter integrity and maladaptive plasticity, with more severe integrity damage in the transition to CM, and CM may show predominant maladaptive plasticity, being, in this regard, a different entity with respect to a more frequent EM. An illus-tration of the hypothesised temporal evolution of the three main DTI measures used here can be seen in Fig. 3.
Anyway, regarding this hypothesis, longitudinal ana-lysis should be performed in order to confirm this pos-sible evolution, and the interpretation of the DTI measures must be carried out cautiously, as mentioned before in this section. Additionally, about the transition from EM to CM, the high frequency EM patients could be especially interesting to investigate. Indeed, it remains to be elucidated whether high frequency EM is actually a transition phase between EM and CM, an intense EM or, considering an extreme case, a low frequency CM.
Although this can be only considered a preliminary hy-pothesis, it would contribute to explain the high variability in the results in the literature found when comparing migraineurs with healthy controls in terms of white matter diffusion parameters. Indeed, if different trends can be found at different stages of the disease, then the results of global comparisons would depend heavily on the internal composition of the cohort of migraine patients in each study, possibly yielding what seem to be opposite results.
Conclusions
The current findings suggest global white matter struc-tural differences between Episodic Migraine and Chronic Migraine, with damaged axonal integrity in Chronic Migraine, and between both groups of migraine patients and Healthy Controls. A different temporal pathophysio-logical evolution with maladaptive plastic changes seems to happen in Chronic Migraine with respect to Episodic Migraine. Further research is needed for these findings to be confirmed. Also, additional clinical features should be considered, longitudinal evaluation should be per-formed and a possible relationship with functional changes should be assessed.
Supplementary information
Supplementary informationaccompanies this paper athttps://doi.org/10. 1186/s10194-019-1071-3.
Additional file 1: Figure S1.White matter alterations in chronic migraine compared to episodic migraine patients.Table S1.White matter regions where decreased AD values were found in CM compared to EM (FWE-corrected).Table S2.White matter regions where decreased AD values were found in CM compared to EM considering only patients with migraine without aura (FWE-corrected).Table S3.White matter regions from the ICBM-DTI-81 White Matter Atlas for which decreased AD values were found in CM compared to EM considering the effect of dur-ation of migraine history (FWE-corrected).Table S4.White matter regions from the ICBM-DTI-81 White Matter Atlas for which increased AD values were found in EM compared to HC considering the effect of duration of migraine history (FWE-corrected).Figure S2.White matter alterations in migraine including duration of migraine history as a covariate.Table S5. White matter regions from the ICBM-DTI-81 White Matter Atlas for which significant AD values were found in CM compared to EM consid-ering the effect of time from onset of CM (FWE-corrected).Table S6. White matter regions from the ICBM-DTI-81 White Matter Atlas for which decreased FA values were found in CM compared to HC consid-ering the effect of time from onset of CM (FWE-corrected).Figure S3. White matter alterations in CM including time from onset of chronic migraine as a covariate.Table S7. Cohen’s d skeleton AD values in re-gions with significant differences between EM and CM.Figure S4. Cohen’s AD bar plots of regions with FWE-corrected differences be-tween EM and CM (part 1).Figure S5.Cohen’s AD bar plots of regions with FWE-corrected differences between EM and CM (part 2).Figure S6. Cohen’s d FA bar plots (part 1).Figure S7. Cohen’s d FA bar plots (part 2). Figure S8.Cohen’s d RD bar plots (part 1).Figure S9.Cohen’s d RD bar plots (part 2).Figure S10.Cohen’s d MD bar plots (part 1).Figure S11. Cohen’s d MD bar plots (part 2).
Abbreviations
AD:Axial diffusivity; ANCOVA: Analysis of covariance; BET: Brain extraction tool; CM: Chronic migraine; dMRI: Diffusion magnetic resonance imaging; DTI: Diffusion tensor imaging; DWI: Diffusion-weighted image; EM: Episodic migraine; FA: Fractional anisotropy; FDR: False discovery rate; fMRI: Functional magnetic resonance imaging; FWE: Family wise error; HC: Healthy controls; ICHD-3: International classification of headache disorders third edition; MD: Mean diffusivity; MNI: Montreal neurological institute; MRI: Magnetic Resonance Imaging; RD: Radial diffusivity; ROI: Region of interest; TBSS: Tract-based spatial statistics; TE: Echo time; TFCE: Threshold-free cluster
enhancement; TFE: Turbo field echo; TR: Repetition time; TTH: Tension-type headache
Acknowledgements
Authors’contributions
ÁP-G: Data analysis and interpretation, drafting (including first draft) and writing of the manuscript. DG-A: Data acquisition and interpretation, drafting and writing of the manuscript. ÁLG: Study concept and design, data acquisi-tion and interpretaacquisi-tion, drafting and writing of the manuscript, study supervi-sion. SA-F: data analysis, drafting and writing of the manuscript. MR: data acquisition and analysis. RdL-G: data acquisition, analysis and interpretation, drafting and writing of the manuscript. All authors read and approved the final manuscript.
Funding
This study has been partially supported by grant from Gerencia Regional de Salud CyL (GRS 943/A/14, GRS 1727/A/18). This work was also supported by Ministerio de Ciencia e Innovación of Spain with research grants RTI2018– 094569-B-I00 and PRX18/00253 (Estancias de profesores e investigadores senior en centros extranjeros).
Availability of data and materials
All patients who participated in the study signed a written informed consent. This consent did not include a statement to make the individual confidential data accessible to the public. Therefore, anonymized data are available from the corresponding author on reasonable request.
Ethics approval and consent to participate
The local Ethics Committee of Hospital Clínico Universitario de Valladolid approved the study (PI: 14–197). All participants read and signed a written consent form prior to their participation.
Consent for publication Not applicable.
Competing interests
The authors declare that they have no competing interests.
Author details
1
Imaging Processing Laboratory, Universidad de Valladolid, Valladolid, Spain.
2Headache Unit, Department of Neurology, Hospital Clínico Universitario de
Valladolid, Avenida Ramón y Cajal 3, 47005 Valladolid, Spain.3Institute for
Biomedical Research of Salamanca (IBSAL), Salamanca, Spain.4Department of
Medicine, Universidad de Valladolid, Valladolid, Spain.5Department of Radiology, Hospital Clínico Universitario de Valladolid, Valladolid, Spain.
Received: 25 October 2019 Accepted: 24 December 2019
References
1. Headache Classification Committee of the International Headache Society (2018) The international classification of headache disorders, 3rd edition. Cephalalgia 38(1):1–211
2. Lipton RB, Fanning KM, Buse DC, Martin VT, Reed ML, Manack Adams A et al (2018) Identifying natural subgroups of migraine based on comorbidity and concomitant condition profiles: results of the chronic migraine epidemiology and outcomes (CaMEO) study. Headache 58(7):933–947 3. Katsarava Z, Buse DC, Manack AN, Lipton RB (2012) Defining the differences
between episodic migraine and chronic migraine. Curr Pain Headache Rep 16(1):86–92
4. Aurora SK, Brin MF (2017) Chronic migraine: an update on physiology, imaging, and the mechanism of action of two available pharmacologic therapies. Headache 57(1):109–125
5. Li XL, Fang YN, Gao QC, Lin EJ, Hu SH, Ren L et al (2011) A diffusion tensor magnetic resonance image study of Corpus callosum from adult patients with migraine complicated with depressive/anxious disorder. Headache 51(2):237–245
6. Yuan K, Qin W, Liu P, Zhao L, Yu D, Zhao L et al (2012) Reduced fractional anisotropy of Corpus callosum modulates inter-hemispheric resting state functional connectivity in migraine patients without Aura. PLoS One 7(9):e45476 7. Yu D, Yuan K, Qin W, Zhao L, Dong M, Liu P et al (2013) Axonal loss of
white matter in migraine without aura: a tract-based spatial statistics study. Cephalalgia. 33(1):34–42
8. Yu D, Yuan K, Zhao L, Dong M, Liu P, Yang X et al (2013) White matter integrity affected by depressive symptoms in migraine without aura: a tract-based spatial statistics study. NMR Biomed 26(9):1103–1112
9. Messina R, Rocca MA, Colombo B, Pagani E, Falini A, Comi G et al (2015) White matter microstructure abnormalities in pediatric migraine patients. Cephalalgia. 35(14):1278–1286
10. Szabó N, Faragó P, Király A, Veréb A, Csete G, Tóth E et al (2017) Evidence for plastic processes in migraine with Aura: a diffusion weighted MRI study. Front Neuroanat 11:138
11. Shibata Y, Ishiyama S, Matsushita A (2018) White matter diffusion abnormalities in migraine and medication overuse headache: A 1.5-T tract-based spatial statistics study. Clin Neurol Neurosurg 174:167–173 12. DaSilva AFM, Granziera C, Tuch DS, Snyder J, Vincent M, Hadjikhani N (2007)
Interictal alterations of the trigeminal somatosensory pathway and PAG in migraine. Neuroreport 18(4):301–305
13. Coppola G, Tinelli E, Lepre C, Iacovelli E, Di Lorenzo C, Di Lorenzo G et al (2014) Dynamic changes in thalamic microstructure of migraine without aura patients: a diffusion tensor magnetic resonance imaging study. Eur J Neurol 21(2):287–e13
14. Chong CD, Schwedt TJ (2015) Migraine affects white-matter tract integrity: a diffusion-tensor imaging study. Cephalalgia. 35(13):1162–1171
15. PetrušićI, DakovićM, Kačar K, MićićO, Zidverc-TrajkovićJ (2018) Migraine with aura and white matter tract changes. Acta Neurol Belg 118:485–491 16. Gomez-Beldarrain M, Oroz I, Garcia Zapirain B, Fernandez Ruanova B, Garcia
Fernandez Y, Cabrera A et al (2015) Right fronto-insular white matter tracts link cognitive reserve and pain in migraine patients [erratum in J headache pain. 2016;17:22]. J Headache Pain 17:4
17. Liu J, Ma S, Mu J, Chen T, Xu Q, Dun W et al (2017) Integration of white matter network is associated with Interindividual differences in
psychologically mediated placebo response in migraine patients. Hum Brain Mapp 38(10):5250–5259
18. Rocca MA, Pagani E, Colombo B, Tortorella P, Falini A, Comi G et al (2008) Selective diffusion changes of the visual pathways in patients with migraine: a 3-T Tractography study. Cephalalgia. 28(10):1061–1068
19. Granziera C, DaSilva AFM, Snyder J, Tuch DS, Hadjikhani N (2006) Anatomical alterations of the visual motion processing network in migraine with and without Aura. PLoS Med 3(10):e402
20. Pietrobon D, Moskowitz MA (2013) Pathophysiology of migraine. Annu Rev Physiol 75:365–391
21. Dodick DW (2018) A phase-by-phase review of migraine pathophysiology. Headache 58(Suppl 1):4–16
22. Neeb L, Bastian K, Villringer K, Gits HC, Israel H, Reuter U et al (2015) No microstructural white matter alterations in chronic and episodic Migraineurs: a case-control diffusion tensor magnetic resonance imaging study. Headache 55(2):241–251
23. Valfrè W, Rainero I, Bergui M, Pinessi L (2008) Voxel-based morphometry reveals gray matter abnormalities in migraine. Headache. 48(1):109–117 24. Neeb L, Bastian K, Villringer K, Israel H, Reuter U, Fiebach JB (2017) Structural
gray matter alterations in chronic migraine: implications for a progressive disease? Headache. 57(3):400–416
25. Schulte LH, Allers A, May A (2017) Hypothalamus as a mediator of chronic migraine. Neurology 88(21):2011–2016
26. Smith SM, Jenkinson M, Johansen-Berg H, Rueckert D, Nichols TE, Mackay CE et al (2006) Tract-based spatial statistics: voxelwise analysis of multi-subject diffusion data. Neuroimage. 31(4):1487–1505
27. Headache Classification Committee of the International Headache Society (2013) The international classification of headache disorders, 3rd edition (beta version). Cephalalgia 33(9):629–808
28. Serrano D, Lipton RB, Scher AI, Reed ML, Stewart WF, Manack Adams A et al (2017) Fluctuations in episodic and chronic migraine status over the course of 1 year: implications for diagnosis, treatment and clinical trial design. J Headache Pain 18(1):101
29. Zigmond AS, Snaith RP (1983) The hospital anxiety and depression scale. Acta Psychiatr Scand 67(6):361–370
30. Pelletier A, Periot O, Dilharreguy B, Hiba B, Bordessoules M, Chanraud S et al (2015) Age-related modifications of diffusion tensor imaging parameters and white matter Hyperintensities as inter-dependent processes. Front Aging Neurosci 7:255
32. Tournier J-D, Smith R, Raffelt D, Tabbara R, Dhollander T, Pietsch M et al (2019) MRtrix3: A fast, flexible and open software framework for medical image processing and visualisation. bioRxiv Available from: https://www.biorxiv.org/content/biorxiv/early/2019/02/15/551739.full.pdf. Accessed 25 July 2019
33. Andersson JL, Sotiropoulos SN (2015) An integrated approach to correction for off-resonance effects and subject movement in diffusion MR imaging. Neuroimage. 125:1063–1078
34. Smith SM, Jenkinson M, Woolrich MW, Beckmann CF, Behrens TE, Johansen-Berg H et al (2004) Advances in functional and structural MR image analysis and implementation as FSL. Neuroimage 23:S208–S219
35. Zhang Y, Brady M, Smith S (2001) Segmentation of brain MR images through a hidden Markov random field model and the expectation-maximization algorithm. IEEE Trans Med Imaging 20:45–57
36. Dhollander T, Raffelt D, Connelly A (2016) Unsupervised 3-tissue response function estimation from single-shell or multi-shell diffusion MR data without a co-registered T1 image. ISMRM Work Break Barriers Diffus MRI 5 37. Jenkinson M, Beckmann CF, Behrens TE, Woolrich MW, Smith SM (2012) FSL.
Neuroimage 62:782–790
38. Rueckert D, Sonoda LI, Hayes C, Hill DL, Leach MO, Hawkes DJ (1999) Nonrigid registration using free-form deformations: application to breast MR images. IEEE Trans Med Imaging 18(8):712–721
39. Mori S, Wakana S, Nagae-Poetscher LM, van Zijl PC (2005) MRI atlas of human white matter. Elsevier, Amsterdam
40. Oishi K, Zilles K, Amunts K, Faria A, Jiang H, Li X et al (2008) Human brain white matter atlas: identification and assignment of commom anatomical structures in superficial white matter. Neuroimage 43(3):447–457 41. Hua K, Zhang J, Wakana S, Jiang H, Li X, Reich DS et al (2008) Tract
probability maps in stereotaxic spaces: analyses of white matter anatomy and tract-specific quantification. Neuroimage 39(1):336–347
42. Nichols TE, Holmes AP (2002) Nonparametric permutation tests for functional neuroimaging: a primer with examples. Hum Brain Mapp 15(1):1–25 43. Smith SM, Nichols TE (2009) Threshold-free cluster enhancement:
addressing problems of smoothing, threshold dependence and localisation in cluster inference. Neuroimage. 44(1):83–98
44. Benjamini Y, Hochberg Y (1995) Controlling the false discovery rate: a practical and powerful approach to multiple testing. J R Stat Soc Ser B 57(1):289–300 45. Cohen J (1988) Statistical power analysis for the behavioral sciences, 2nd
edn. Lawrence Erlbaum Associates, Publishers, Hillsdale
46. Bennett IJ, Madden DJ, Vaidya CJ, Howard DV, Howard JHJ (2010) Age-related differences in multiple measures of white matter integrity: a diffusion tensor imaging study of healthy aging. Hum Brain Mapp 31(3): 378–390
47. Winklewski PJ, Sabisz A, Naumczyk P, Jodzio K, Szurowska E, Szarmach A (2018) Understanding the physiopathology behind axial and radial diffusivity changes—what do we know? Front Neurol 9:92
48. Alexander AL, Lee JE, Lazar M, Field AS (2007) Diffusion tensor imaging of the brain. Neurotherapeutics 4(3):316–329
49. Sun S-W, Liang H-F, Cross AH, Song S-K (2008) Evolving Wallerian degeneration after transient retinal ischemia in mice characterized by diffusion tensor imaging. Neuroimage. 40(1):1–10
50. Pierpaoli C, Barnett A, Pajevic C, Chen R, Penix LR, Virta A et al (2001) Water diffusion changes in Wallerian degeneration and their dependence on white matter architecture. Neuroimage 13(6 Pt 1):1174–1185
51. Shu N, Wang Z, Qi Z, Li K, He Y (2011) Multiple diffusion indices reveals white matter degeneration in Alzheimer’s disease and mild cognitive impairment: a tract-based spatial statistics study. J Alzheimers Dis 26(Suppl 3):275–285 52. Szabó N, Kincses ZT, Párdutz A, Tajti J, Szok D, Tuka A et al (2012) White
matter microstructural alterations in migraine: a diffusion-weighted MRI study. Pain 153(3):651–656
53. Kochunov P, Thompson PM, Lancaster JL, Bartzokis G, Smith S, Coyle T et al (2007) Relationship between white matter fractional anisotropy and other indices of cerebral health in normal aging: tract-based spatial statistics study of aging. Neuroimage. 35(2):478–487
54. Beaulieu C (2002) The basis of anisotropic water diffusion in the nervous system - a technical review. NMR Biomed 15(7–8):435–455
55. Ito K, Kudo M, Sasaki M, Saito A, Yamashita F, Harada T et al (2016) Detection of changes in the periaqueductal gray matter of patients with episodic migraine using quantitative diffusion kurtosis imaging: preliminary findings. Neuroradiology. 58(2):115–120
56. Tedeschi G, Russo A, Conte F, Corbo D, Caiazzo G, Giordano A et al (2016) Increased interictal visual network connectivity in patients with migraine with aura. Cephalalgia. 36(2):139–147
57. Coppola G, Di Renzo A, Tinelli E, Di Lorenzo C, Di Lorenzo G, Parisi V et al (2016) Thalamo-cortical network activity during spontaneous migraine attacks. Neurology 87(20):2154–2160
58. Zhang J, Wu YL, Su J, Yao Q, Wang M, Li GF et al (2017) Assessment of gray and white matter structural alterations in migraineurs without aura. J Headache Pain 18(1):74
59. Blumenfeld-Katzir T, Pasternak O, Dagan M, Assaf Y (2011) Diffusion MRI of structural brain plasticity induced by a learning and memory task. PLoS One 6(6):e20678
60. Sampaio-Baptista C, Khrapitchev AA, Foxley S, Schlagheck T, Scholz J, Jbabdi S et al (2013) Motor skill learning induces changes in white matter microstructure and myelination. J Neurosci 33(50):19499–19503
61. Ribas EC, Yağmurlu K, de Oliveira E, Ribas GC, Rhoton A (2018) Microsurgical anatomy of the central core of the brain. J Neurosurg 129(3):752–769 62. Russo A, Coppola G, Pierelli F, Parisi V, Silvestro M, Tessitore A et al (2018)
Pain perception and migraine. Front Neurol 9:576
63. Borsook D, Veggeberg R, Erpelding N, Borra N, Linnman C, Burstein R et al (2016) The insula: a“hub of activity”in migraine. Neuroscientist 22(6):632–652 64. Porter A, Gladstone JP, Dodick DW (2005) Migraine and white matter
hyperintensities. Curr Pain Headache Rep 9(4):289–293
65. Yalcin A, Ceylan M, Bayraktutan OF, Akkurt A (2018) Episodic migraine and white matter Hyperintensities: Association of Pain Lateralization. Pain Med 19(10):2051–2057
66. Xie H, Zhang Q, Huo K, Liu R, Jian Z-J, Bian Y-T et al (2018) Association of white matter hyperintensities with migraine features and prognosis. BMC Neurol 18:93 67. Lantéri-Minet M, Radat F, Chautard MH, Lucas C (2005) Anxiety and depression
associated with migraine: influence on migraine subjects’disability and quality of life, and acute migraine management. Pain 118(3):319–326
68. Baskin SM, Lipchik GL, Smitherman TA (2006) Mood and anxiety disorders in chronic headache. Headache 46(Suppl 3):S76–S87
69. Minen MT (2016) Begasse De Dhaem O, kroon Van Diest a, powers S, Schwedt TJ, Lipton R, et al. migraine and its psychiatric comorbidities. J Neurol Neurosurg Psychiatry 87(7):741–749
70. May A (2017) Understanding migraine as a cycling brain syndrome: reviewing the evidence from functional imaging. Neurol Sci 38(Suppl 1):125–130 71. Karsan N, Goadsby PJ (2018) Biological insights from the premonitory
symptoms of migraine. Nat Rev Neurol 14(12):699–710
Publisher’s Note