R E S E A R C H
Open Access
Identification, quantification and
age-related changes of human trabecular
meshwork stem cells
Yogapriya Sundaresan
1, Muthukkaruppan Veerappan
1, Krishnadas Subbiah Ramasamy
2and
Gowri Priya Chidambaranathan
1*Abstract
Background:Loss of cells in the human trabecular meshwork (TM) has been reported with ageing and in glaucoma. This study aims to identify, quantify and determine the age-related changes of human TM stem cells (TMSCs).
Methods:Isolation of TM cells/ paraffin sectioning was carried out using human corneoscleral rings and whole globes. The TM cells/ sections were immunostained for the stem cell markers ATP-binding cassette protein G2 (ABCG2), nerve growth factor receptor p75 and AnkyrinG (AnkG). Images were acquired using Leica SP8 confocal microscope. The isolated cells were analyzed for two parameters- ABCG2 expression and nucleus to cytoplasmic ratio (N/C ratio). The total number of TM cells and those positive for ABCG2 and p75 in each section were quantified. Spearman rank order correlation was used to determine the association between age and the cell counts.
Results:The TMSCs were identified based on two parameters- high ABCG2 expression and high N/C ratio > 0.7. These stem cells were also positive for p75 and AnkG. The TMSC content based on the two parameters was 21.0 ± 1.4% in < 30 years age group, 12.6 ± 6.6% in 30–60 years and 4.0 ± 3.5% in > 60 years. The stem cells with high ABCG2 and p75 expression were restricted to the Schwalbe’s line region of the TM. A significant correlation was observed between the reduction in TMSC content and TM cell count during ageing.
Conclusion:The human TMSCs were identified and quantified based on two parameter analysis. This study established a significant association between age-related reduction in TMSC content and TM cell loss.
Keywords:Human trabecular meshwork, Trabecular meshwork stem cells, Two-parameter analysis, Age-related changes, Primary open angle glaucoma
Background
The human trabecular meshwork (TM) is a tiny porous tissue located at the iridocorneal angle of the eye, which serves as the conventional outflow pathway for the drainage of aqueous humor (AH). TM is neural crest in origin [1] and is organized to act as a mechanical pump that regulates the AH outflow to maintain intraocular pressure (IOP). Earlier studies have reported a loss of
6000 TM cells per year with ageing [2,3]. In addition to
TM cell loss, trabecular thickening, fusion of the tra-beculae, extracellular matrix modification and loss of
giant vacuoles from Schlemm’s canal endothelium [3, 4]
contribute to increased IOP. The increase in IOP due to pronounced loss of TM cells has been reported in pri-mary open angle glaucoma (POAG) [5]. Elevated IOP af-fects the optic nerve through the mechanical changes at the lamina cribrosa leading to irreversible blindness [6].
The TM comprises of two anatomical regions: (i) the filtering meshwork which facilitates the AH outflow and (ii) the anterior non-filtering region that is inserted be-neath the peripheral corneal endothelium. Earlier reports have described the presence of unusually prominent
© The Author(s). 2019Open AccessThis article is distributed under the terms of the Creative Commons Attribution 4.0 International License (http://creativecommons.org/licenses/by/4.0/), which permits unrestricted use, distribution, and reproduction in any medium, provided you give appropriate credit to the original author(s) and the source, provide a link to the Creative Commons license, and indicate if changes were made. The Creative Commons Public Domain Dedication waiver (http://creativecommons.org/publicdomain/zero/1.0/) applies to the data made available in this article, unless otherwise stated.
* Correspondence:[email protected]
1Department of Immunology and Stem Cell Biology, Aravind Medical
Research Foundation, Madurai, Tamil Nadu, India
clusters of the epithelioid cells with high nucleus to cytoplasmic (N/C) ratio at the junction of the anterior
non-filtering region of TM in Macaca mulata [7]
re-ferred as the Schwalbe’s line cells. The presence of
stem-like cells in this region was evident from active cell pro-liferation after argon laser trabeculoplasty in corneoscl-eral explant organ culture [8]. Recent studies on primate and bovine eyes have reported the presence of stem/ progenitor cells which are characterized by long term BrdU retention and OCT4 immunoreactivity in the
Schwalbe’s line region/ transition zone [9,10]. These
pu-tative stem cells have been shown to give rise to both corneal endothelium and trabeculae when required [10, 11]. However, specific markers for stem cells in human TM have not been identified yet. Characterization of cultured trabecular meshwork stem cells (TMSCs) expressed putative stem cells markers such as ATP-Binding Cassette G2 protein (ABCG2), NOTCH-1, MUC1 and AnkyrinG (AnkG). These cells were multipo-tent, had the ability to differentiate into TM cells with phagocytic property and home to TM when injected into
the anterior chamber [12,13]. Transplantation of
iPSC-derived TM cells activated endogenous TM cell
prolifer-ation to repopulate the TM, thus reducing the IOP [14–
16]. However, the role of TMSCs in maintaining tissue homeostasis and its fate in ageing remains unexplored. We hypothesize that TMSCs play an important role in maintaining tissue homeostasis and are reduced upon ageing compromising the tissue function.
Therefore, the current study is focused on identifying and quantifying the putative stem cells in the human TM in isolated native TM cells using ABCG2, a univer-sal stem cell marker [17], nerve growth factor receptor p75, a neural crest derived stem cell marker [18] and AnkG, a stem cell marker [12] specifically expressed in
the transition zone/ Schwalbe’s line region [10]. A
com-bination of two parameters- high ABCG2 expression and high N/C ratio was used to identify and quantify TMSCs which was previously established to be a specific method for identifying human limbal epithelial stem cells [19]. Further, the location of TMSCs was deter-mined in human tissue sections using the same stem cell markers and the cells expressing these markers were quantified. This study also elucidated the changes in the TMSC content with ageing and its correlation with total TM cell loss.
Methods
Sample collection
The whole globes not suitable for corneal transplant-ation from donors of age group < 30 years (younger age
group), 30–60 years (middle age group) and > 60 years
(older age group) (n= 3 each) were obtained from Rotary
Aravind International Eye Bank, Madurai. The inclusion
criteria for the selection of tissues were (i) eyes enucle-ated within 4 h of death and received within 24 h for re-search, (ii) donors with no history of ocular infection or systemic disease. Eyes from donors whose cause of death was due to poison or snake bite were excluded from the study. The corneoscleral rims of the three different age
groups (n= 5 pairs each) obtained after corneal
trans-plantation were used for the isolation of native TM cells. The study adhered to the tenets of the declaration of Helsinki and was approved by the Institutional Review Board of Aravind Eye Care System (IRB number: RES2016057BAS).
Native TM cell isolation and cytosmear preparation The TM was dissected from the corneoscleral rims under a dissection microscope (Nikon SMZ645-Japan). The TM was digested using collagenase A (4 mg/ml) (Roche- Basel, Switzerland) for 2 h at 37 °C. Following the digestion, the cells were centrifuged at 1200 rpm for 10 min at 4 °C (Heareus Primo Biofuge, Germany) [20]. Trypan blue assay was carried out to determine cell
via-bility and cell count was determined with a
hemocytometer (Sigma Aldrich, St. Louis, Missouri).
Cytosmears of 2.5 × 10⁴cells per slide were prepared by
centrifuging at 400 rpm for 3 min using a cytospin
sys-tem (Thermo Shandon – Pittsburg, PA). The TM cell
cytosmears were fixed in ice cold acetone followed by immunostaining.
Paraffin sectioning
The anterior segments of the eyes were dissected with intact iris/ ciliary body and divided into four quadrants. Following fixation in 10% buffered formalin for 24 h, quadrants were embedded in paraffin and sectioned (5μm). The sections were deparaffinized and antigen re-trieval was carried out using 10 mM citrate buffer (pH 6.4) for 20 min at 90 °C followed by immunostaining [21].
Immunostaining
antibody (Millipore, Billerica, MA) was added at a dilu-tion of 1:100 in 5% BSA in 1X PBS. After overnight in-cubation, biotinylated secondary antibody (Mouse anti-rabbit IgG, Santa Cruz Biotechnology Inc- San Fran-cisco, CA) was added at a dilution of 1:200 in 5% BSA and incubated for 1 h at 22 °C. Visualization of p75/ AnkG staining was carried out using streptavidin Alexa Fluor 633 (Thermofisher Scientific- Waltham, Massa-chusetts) at a dilution of 1:500 in 1X PBS. Between the steps, the slides were washed with 1X PBS. The stained sections and cytosmear were then mounted with Vecta-shield mounting medium (Burlingame, CA) containing DAPI/propidium iodide (PI). Cytospin smears/ paraffin sections without adding primary antibody during the im-munostaining were used as negative control.
Confocal microscopy and N/C ratio calculation
Acquisition of confocal images was carried out using a laser scanning microscope (Leica SP8 confocal micro-scope, Germany) as previously described [22]. Briefly, fluorescent Z stack images were acquired with the follow-ing settfollow-ings: the emission band width for FITC ranged from 496 to 535 nm using laser blue 488; for PI from 550 to 600 nm using laser green 552 nm and for Alexa Fluor 633 from 610 to 725 nm using laser red 633 nm. Using the above parameters, the images were acquired from the
Schwalbe’s line region till the posterior region of the
meshwork where the TM attaches with ciliary body. The Z stack images of 100 consecutive TM cells were acquired from double immunostained cytosmear for FITC, Alexa Fluor 633, PI and bright field using 40X objective zoom 2.
Two parameter analysis
From the Z stack images of TM cells, the cellular and nuclear areas were measured using Leica Software (LAS AF 3.3.0.10134). The N/C ratio of the TM cells was cal-culated in Microsoft Excel by dividing the nuclear and cytoplasmic area [22]. The fluorescence intensity was quantified based on mean pixel intensity after recon-structing the Z stack image to a 2D maximum projection along a fixed axis. The level of ABCG2 expression was quantified based on the mean pixel intensity of the membrane staining using three linear Region of Interest (ROI) of equal length [19]. The cells with mean pixel in-tensity 188 ± 24 (Mean ± SD) were graded high positive (++), 125 ± 42 positive (+) and 53 ± 28 as negative for ABCG2. Similarly, the expression of p75 and AnkG was graded either positive or negative. The TMSCs were identified based on two parameter analysis which was established as a specific method to identify and quantify human limbal epithelial stem cells [19]. A scatter plot was constructed with ABCG2 intensity as X-axis and N/ C ratio as Y-axis. The plot was divided into four quad-rants at X = 0.7 and Y > 1. The upper right cells with N/
C ratio > 0.7 and ABCG2 positivity =2 were designated as putative stem cells of the TM.
Quantification of total TM cell count and immunopositive cells in TM sections
Two quadrants from each eye were included in the study. A minimum of three sections per quadrant were analyzed. The total number of cells in the TM [including the filtering region and the non-filtering region
exclud-ing the Schlemm’s canal endothelium (Fig. 1)] were
quantified based on DAPI staining. Cells highly positive for ABCG2 and p75 in each section were also counted. The percentage of cells immunopositive for ABCG2 and p75 among the total number of nuclei in the TM were calculated. The mean total cell count and ABCG2/ p75 positive cells was averaged for each age group.
Statistical analysis
Spearman Rank Order Correlation was performed to de-termine the statistical significance between the age and
the cell counts using Stata 14.0 and apvalue of less than
0.05 was considered statistically significant.
Results
Identification of human TMSCs in isolated TM cells by two parameter analysis
The TM cells were analyzed for two-parameters –level
of ABCG2 expression and N/C ratio. Based on these
pa-rameters, a scatter plot was prepared (Fig.2) and divided
into four quadrants. The upper right (UR) quadrant cells were characterized by high ABCG2 expression and high N/C ratio, a feature of stem cells. The upper left (UL) quadrant cells expressed high levels of ABCG2 but had low N/C ratio. The lower left (LL) quadrant cells were characterized by minimal or no ABCG2 expression and low N/C ratio. Though the lower right (LR) quadrant cells had high N/C ratio, the expression of ABCG2 was
either minimal or absent (Fig.3).
Double immunostaining of the TM cytosmears for ABCG2 and p75 indicated that all the UR cells with high ABCG2 expression and high N/C ratio were also positive
for the neural crest derived stem cell marker p75 (Fig.3a).
In parallel, double immunostaining for p75 and AnkG
identified their co-expression in the UR cells (Fig. 3b).
Thus, in addition to the two-parameters, p75 and AnkG expression confirms the stem cell property of the UR cells. The above data also revealed that high expression of ABCG2, p75 and AnkG positivity was not restricted to the UR quadrant cells signifying the importance of combining another parameter such as N/C ratio to identify TMSCs.
Location of human TMSCs
Fig. 1Hematoxylin and eosin stained human TM section to demarcate the filtering and non-filtering region
meshwork (filtering and non-filtering region). High ABCG2 expression, a characteristic feature of stem
cells, was observed in all the cells of the Schwalbe’s
line region in the non-filtering meshwork whereas the cells in the filtering region had lower or minimal
ex-pression (Fig. 4).
Similar to the ABCG2 staining pattern, the immuno-staining of neural crest derived stem cell marker p75, identified all the cells in the Schwalbe’s line region to be positive. In contrast, the cells in the filtering meshwork
were negative for p75 (Fig.4). Double immunostaining of
the TM for ABCG2 and p75 (n= 3 donor tissues)
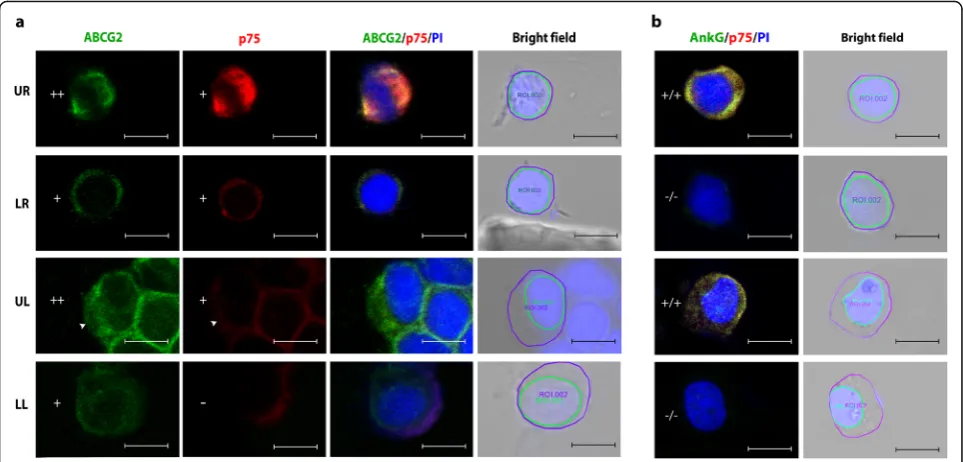
Fig. 3Representative confocal images of isolated TM cell cytosmears immunostained for (a) ABCG2 (FITC-green) and p75 (Alexa 633-red) and (b) AnkG (FITC-green) and p75 (Alexa 633-red), counterstained with propidium iodide (PI-blue). The cells with mean pixel intensity 188 ± 24 (Mean ± SD) were graded high positive (++), 125 ± 42 positive (+) and 53 ± 28 as negative for ABCG2. The expression of p75 and AnkG was graded either positive (+) or negative (−). Nuclear and cytoplasmic area were measured by marking the region of interest (ROI) around each nucleus and cell on the PI/bright field overlay image. The cells in the upper right (UR, first row) quadrant of the scatter plot were highly positive for ABCG2 with high N/C ratio and these were designated as stem cells. These UR cells also expressed p75 and AnkG. Lower right (LR, second row) quadrant cells had high N/C ratio but low ABCG2 expression. The white arrow head indicates a cell in the upper left (UL, third row) quadrant having high ABCG2 expression but low N/C ratio and lower left (LL, fourth row) quadrant cells had low ABCG2 expression and low N/C ratio. +/+−cell positive for both AnkG and p75;−/−cell negative for AnkG and p75. Scale bar 10μm
indicated co-expression of high ABCG2 and p75 in the Schwalbe’s line region (Fig.4).
Age- related changes in TM TMSC content in isolated TM cells
Based on two-parameter analysis, the percentage (mean ± SD) of cells in each quadrant of the scatter plot per age
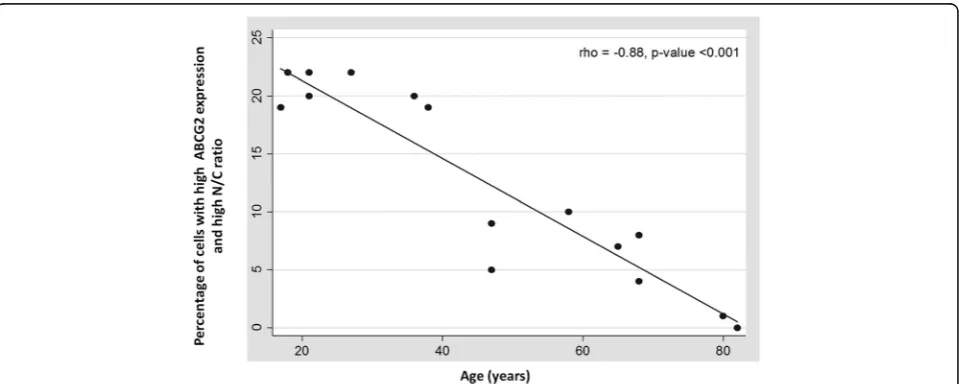
group is represented in Table1. The percentage of stem cells
with high ABCG2 expression and high N/C ratio (UR cells) in younger donors (< 30 years) was observed to be 21.0 ± 1.4%. This percentage decreased significantly to 12.6 ± 6.6% in middle (30–60 years) and 4.0 ± 3.5% (> 60 years) in older
age group (rho =−0.88 andp< 0.001). The Spearman rank
correlation plot indicated a negative correlation between age and stem cell count in isolated native TM cells (Fig.5).
TM sections
Quantification of total TM cellularity Analysis of total TM cell count (mean ± SD) based on DAPI staining re-vealed the presence of 134 ± 30 cells per section in
younger age group, 93 ± 16 cells in middle age group and 80 ± 17 cells in donors from older age group. Spearman rank correlation analysis indicated a signifi-cant decrease in cell count in the middle age group when compared to the younger age group and this
reduction was higher in older age group (rho =−0.92;
p= 0.0004) (Fig. 6a and Table 2).
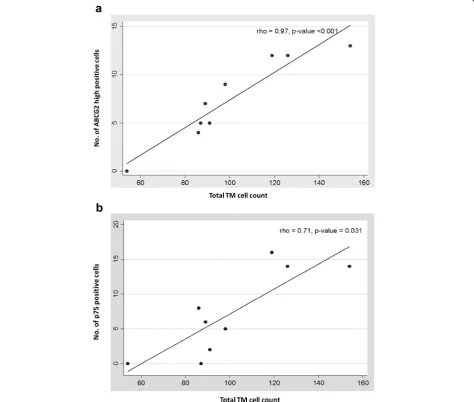
Quantification of TMSC content Analysis of confocal microscopic images of immunostained TM sections using ImageJ revealed that in younger donors, 9.4 ± 3.0% (mean ± SD) and 11.2 ± 4.4% of TM cells/ section had high positivity to ABCG2 and p75, respectively. This per-centage of ABCG2 high positive and p75 positive cells significantly reduced to 7.2 ± 4.0% and 7.1 ± 6.0% in the middle age group and to 5.4 ± 4.0% and 0.3 ± 1.0% in the
older age group [ABCG2 (rho =−0.79; p= 0.011) (Fig.
6b); p75 (rho =−0.81; p= 0.008) (Fig. 6c); (Table 2)]. Though there was a significant reduction in the per-centage of both ABCG2 high positive and p75 posi-tive cells, the loss in the percentage of p75 posiposi-tive cells was observed to be higher in the older age group when compared to the loss of ABCG2 high positive cells. The Spearman rank correlation ana-lysis between total TM cell count and ABCG2 high
positive (rho = 0.97; p= < 0.001) (Fig. 7a) and p75
positive cells (rho = 0.71; p= 0.031) (Fig. 7b)
indi-cated a significant association between loss in stem cell content with total TM cell reduction.
Discussion
The current focus of research in glaucoma is to develop a cell-based therapy to regenerate the TM, thereby
Table 1Distribution of cells in the four quadrants of the scatter plot in three different age groups. The UR cells with high ABCG2 expression and high N/C ratio were designated as stem cells. The stem cell content significantly decreased with ageing (rho =−0.88 andp< 0.001)
Age group Percentage of cells (Mean ± SD)
LL UL LR UR
< 30 years 29.75 ± 10.2 43.0 ± 12.4 5.75 ± 4.6 21.0 ± 1.4
30–60 years 37.0 ± 20.5 44.2 ± 19.8 6.8 ± 5.8 12.6 ± 6.6
> 60 years 65.0 ± 18.2 23.8 ± 13.6 7.4 ± 4.7 4.0 ± 3.5
UR= upper right;UL= upper left;LL= lower left;LR= lower right
enhancing AH outflow facility. Reports on locating and characterizing TMSCs, as well as regenerating TM using TMSCs/iPSCs are available on animal models, primate
and bovine eyes [7–10, 12–16]. However, there are only
a few reports on human TM and none on the role of these adult tissue resident stem cells in maintaining TM homeostasis. Hence, this study focused on identifying
and quantifying putative human TMSCs as well as deter-mining the age-related changes in the TMSC content using native TM tissues and isolated cells.
Aside from one report that quantified TMSCs based on the expression of putative stem cell markers includ-ing ABCG2 and AnkG on bovine eyes [10], there is no specific method available to date that allows for the
Table 2Age related changes in the TM. Total TM cell count, percentage of ABCG2 high and p75 positive cells decreased with ageing
Age group (n= 3 each)
Cell count/ section (Mean ± SD)
Total TM cell count ABCG2 high positive (++) cells (%) p75 positive (+) cells (%)
< 30 years 134 ± 30 9.4 ± 3.0 11.2 ± 4.4
30–60 years 93 ± 16 7.2 ± 4.0 7.1 ± 6.0
> 60 years 80 ± 17 5.4 ± 4.0 0.3 ± 1.0
quantification of human TMSCs. Since there are no spe-cific markers for adult stem cells, we previously
estab-lished a two parameter analysis – by combining high
expression of either p63 or ABCG2 with high N/C ratio as a specific method for the identification and quantifi-cation of both human limbal and buccal mucosal
epithe-lial stem cells [19, 22, 23]. On the basis of this
two-parameter analysis (high ABCG2 expression and high N/ C ratio), the percentage of stem cells (UR cells) in the native human TM cells were identified in this study
(Figs.2&3). Based on the previous experience with
hu-man limbal epithelial stem cells, we hypothesize that the cells in the UL quadrant of the scatter plot to represent the transient amplifying cells as these cells expressed higher ABCG2 levels but had low N/C ratio. The LL cells in the scatter plot might represent the differentiated cell population with minimal or no ABCG2 expression and low N/C ratio. Though LR cells had high N/C ratio, these cells might represent the senescent cells due to the minimal expression or absence of ABCG2 expression
(Figs. 2 &3). Thus, either by the lower ABCG2
expres-sion or low N/C ratio property, these cells were not con-sidered stem cells. Further confirmation is essential using a differentiated cell marker which will be expressed exclusively by non-stem cell population. Endothelial cell contamination during TM cell isolation was ruled out by CD31 immunostaining (data not shown). The expression of neural crest derived stem cell marker p75 and putative TMSC marker AnkG provided additional proof to the fact that the UR quadrant cells represented TMSCs. Quantification of TMSCs demon-strated a significant reduction with ageing. Functional studies such as label retaining cell property (LRC) are es-sential to further confirm this method of identification of stem cells.
To determine the location of these TMSCs, the native human TM tissues were immunostained for the stem cell markers ABCG2 and p75. The expression of ABCG2 was observed throughout the TM as previously reported [10]. But a higher expression of ABCG2 was identified in
the Schwalbe’s line region in this study. The expression
of p75 was also restricted to this region. Raviola had
earlier demonstrated that the cells in the Schwalbe’s line
region to have high N/C ratio. Further, double
immuno-staining the TM sections (n= 3 donor eyes) for ABCG2
and p75 (Fig. 4) confirmed the location of the human
TMSCs in the Schwalbe’s line region.
A significant reduction in TM cellularity was earlier
established with ageing [2,3]. To determine the status of
TMSCs with ageing, the percentage of ABCG2 high and p75 positive cells in native human TM tissues were quantified in three different age groups. A significant de-cline in TMSCs expressing high ABCG2 and p75 in the process of ageing was evident in the current study. This
reduction in stem cell content significantly correlated with the loss of TM cellularity with ageing. In support of our data, p75 expressing mouse adipose-derived stem cells revealed a significant reduction in the number with ageing [24]. In addition, side population cells from rat dental pulp tissues expressing high levels of ABCG2 de-clined with ageing [25]. However, certain adult stem cells such as hematopoietic stem cells and hair follicle stem cells do not decline quantitatively with age, but a
clear loss of function was reported [26,27].
The anatomical changes in the TM with the process of ageing includes accumulation of ECM in the meshwork, trabecular thickening, fusion of trabeculae and loss of
giant vacuoles in the Schlemm’s canal endothelium [3,
4]. These factors might also affect the stem cells in the TM that express ABCG2 and p75 leading to the decline in number with ageing. However, further studies are es-sential to confirm the effect of these factors on the loss of stem cells. In addition, further studies are required to understand whether the loss of stem cells with ageing actually causes reduced TM cellularity.
Conclusion
In conclusion, the current study has established the two-parameter analysis, high N/C ratio and high expression of ABCG2, as a method for identifying and quantifying putative human TMSCs. These TMSCs expressing higher levels of ABCG2 and p75 were restricted to the
Schwalbe’s line region of the anterior non-filtering
meshwork. In addition, quantification of the TMSCs re-vealed a strong correlation between age-related TM cell reduction and stem cell loss. It is further essential to understand the nature of these stem cells in glaucomat-ous condition wherein the TM cell loss is more pro-nounced. However, the role of these TMSCs in maintaining the tissue homeostasis remains unclear. This understanding on the basic biology of TMSCs would help in developing a better stem cell-based ther-apy for POAG patients.
Abbreviations
ABCG2:ATP-Binding Cassette G2 protein; AnkG: AnkyrinG; LL: Lower Left; LR: Lower Right; N/C ratio: Nucleus to Cytoplasmic ratio; TM: Trabecular Meshwork; TMSCs: Trabecular Meshwork Stem Cells; UL: Upper Left; UR: Upper Right
Acknowledgements
The authors thank DST-SERB (Project reference number: EMR/2016/002351) for the financial support and Lady Tata Memorial trust, Mumbai, India for the Junior Research Scholarship [YS], Mr. Saravanan, Manager, Rotary Aravind International Eye Bank, Madurai, India for his help and support in collecting human donor tissues, Ms. M. Gowri, Aravind Communications, Aravind Eye Care System, Madurai, India for her help in preparing the figures, Ms. Iswarya and Mr. Mohammed Sithiq Uduman, Department of Biostatistics, Aravind Eye Care System, Madurai, India for their help in the statistical analysis.
Authors’contributions
interpretation, proof reading; GPC; Study design, data analysis, data interpretation, proof reading. All authors read and approved the final manuscript.
Funding
The study was supported by the Science and Engineering Research Board (Project reference number: EMR/2016/002351).
Availability of data and materials
All data generated or analyzed during this study are included in this published article.
Ethics approval
The study adhered to the tenets of the declaration of Helsinki and was approved by the Institutional Review Board of Aravind Eye Care System (IRB number: RES2016057BAS).
Consent for publication Not applicable.
Competing interests
The authors declare that they have no competing interests.
Author details
1
Department of Immunology and Stem Cell Biology, Aravind Medical Research Foundation, Madurai, Tamil Nadu, India.2Glaucoma Clinic, Aravind
Eye Hospital and Post Graduate Institute of Ophthalmology, Madurai, Tamil Nadu, India.
Received: 8 May 2019 Accepted: 21 September 2019
References
1. Gould DB, Smith RS, John SW. Anterior segment development relevant to glaucoma. Int J Dev Bio. 2004;48(8–9):1015–29.
2. Alvarado J, Murphy C, Polansky J, Juster R. Age-related changes in trabecular meshwork cellularity. Invest Ophthalmol Vis Sci. 1981;21(5):714– 27.
3. Grierson I, Howes RC. Age-related depletion of the cell population in the human trabecular meshwork. Eye (Lond). 1987;1(Pt 2):204–10. 4. Rohen JW, Lütjen-Drecoll E. Age changes of the trabecular meshwork in
human and monkey eyes. A light and electron microscopic study. Altern Entwickl Aging Dev. 1971;1:1–36.
5. Alvarado J, Murphy C, Juster R. Trabecular meshwork cellularity in primary open-angle glaucoma and nonglaucomatous normals. Ophthalmology. 1984;91(6):564–79.
6. Yan DB, Coloma FM, Metheetrairut A, Trope GE, Heathcote JG, Ethier CR. Deformation of the lamina cribrosa by elevated intraocular pressure. Br J Ophthalmol. 1994;78(8):643–8.
7. Raviola G. Schwalbe line's cells: a new cell type in the trabecular meshwork of Macaca mulatta. Invest Ophthalmol Vis Sci. 1982;22(1):45–56.
8. Acott TS, Samples JR, Bradley JM, Bacon DR, Bylsma SS, Van Buskirk EM. Trabecular repopulation by anterior trabecular meshwork cells after laser trabeculoplasty. Am J Ophthalmol. 1989;107(1):1–6.
9. Braunger BM, Ademoglu B, Koschade SE, Fuchshofer R, Gabelt BT, Kiland JA, et al. Identification of adult stem cells in Schwalbe's line region of the primate eye. Invest Ophthalmol Vis Sci. 2014;55(11):7499–507.
10. Yu WY, Grierson I, Sheridan C, Lo AC, Wong DS. Bovine posterior limbus: an evaluation of an alternative source for corneal endothelial and trabecular meshwork stem/progenitor cells. Stem Cells Dev. 2015;24(5):624–39. 11. Whikehart DR, Parikh CH, Vaughn AV, Mishler K, Edelhauser HF. Evidence
suggesting the existence of stem cells for the human corneal endothelium. Mol Vis. 2005;11:816–24.
12. Du Y, Roh DS, Mann MM, Funderburgh ML, Funderburgh JL, Schuman JS. Multipotent stem cells from trabecular meshwork become phagocytic TM cells. Invest Ophthalmol Vis Sci. 2012;53(3):1566–75.
13. Du Y, Yun H, Yang E, Schuman JS. Stem cells from trabecular meshwork home to TM tissue in vivo. Invest Ophthalmol Vis Sci. 2013;54(2):1450–9. 14. Abu-Hassan DW, Li X, Ryan EI, Acott TS, Kelley MJ. Induced pluripotent stem
cells restore function in a human cell loss model of open-angle glaucoma. Stem Cells. 2015;33(3):751–61.
15. Zhu W, Gramlich OW, Laboissonniere L, Jain A, Sheffield VC, Trimarchi JM, et al. Transplantation of iPSC-derived TM cells rescues glaucoma phenotypes in vivo. Proc Natl Acad Sci U S A. 2016;113(25):E3492–500. 16. Zhu W, Jain A, Gramlich OW, Tucker BA, Sheffield VC, Kuehn MH.
Restoration of aqueous humor outflow following transplantation of iPSC-derived trabecular meshwork cells in a transgenic mouse model of glaucoma. Invest Ophthalmol Vis Sci. 2017;58(4):2054–62. 17. Chen Z, de Paiva CS, Luo L, Kretzer FL, Pflugfelder SC, Li DQ.
Characterization of putative stem cell phenotype in human limbal epithelia. Stem Cells. 2004;22(3):355–66.
18. Morrison SJ, White PM, Zock C, Anderson DJ. Prospective identification, isolation by flow cytometry, and in vivo self-renewal of multipotent mammalian neural crest stem cells. Cell. 1999;96(5):737–49.
19. Priya CG, Prasad T, Prajna NV, Muthukkaruppan V. Identification of human corneal epithelial stem cells on the basis of high ABCG2 expression combined with a large N/C ratio. Microsc Res Tech. 2013;76(3):242–8. 20. Stamer WD, Seftor RE, Williams SK, Samaha HA, Snyder RW. Isolation and
culture of human trabecular meshwork cells by extracellular matrix digestion. Current Eye Res. 1995;14(7):611–7.
21. Vinod KR, Jones D, Udupa V. A simple and effective heat induced antigen retrieval method. MethodsX. 2016;3:315–9.
22. Arpitha P, Prajna NV, Srinivasan M, Muthukkaruppan V. High expression of p63 combined with a large N/C ratio defines a subset of human limbal epithelial cells: implications on epithelial stem cells. Invest Ophthalmol Vis Sci. 2005;46(10):3631–6.
23. Arpitha P, Prajna NV, Srinivasan M, Muthukkaruppan V. A subset of human limbal epithelial cells with greater nucleus-to-cytoplasm ratio expressing high levels of p63 possesses slow-cycling property. Cornea. 2008;27(10): 1164–70.
24. Yamada T, Akamatsu H, Hasegawa S, Yamamoto N, Yoshimura T, Hasebe Y, et al. Age-related changes of p75 neurotrophin receptor-positive adipose-derived stem cells. J Dermatol Sci. 2010;58(1):36–42.
25. Kenmotsu M, Matsuzaka K, Kokubu E, Azuma T, Inoue T. Analysis of side population cells derived from dental pulp tissue. Int Endod J. 2010;43(12): 1132–42.
26. Liang Y, Van Zant G, Szilvassy SJ. Effects of aging on the homing and engraftment of murine hematopoietic stem and progenitor cells. Blood. 2005;106(4):1479–87.