R E S E A R C H A R T I C L E
Open Access
Elevated blood viscosity is associated with
cerebral small vessel disease in patients
with acute ischemic stroke
Seung Hoon Song
1, Jeong Hee Kim
1, Joon Hwa Lee
1, Yeo-Min Yun
2, Dong-Hee Choi
3and Hahn Young Kim
1*Abstract
Background:Increased level of blood viscosity, which is one of the major factors that determine blood rheology, has been reported as a risk factor or predictor for cerebrovascular events. We investigated how blood viscosity is associated with acute stroke and chronic radiological manifestations of cerebral small vessel disease, and how blood viscosity changes after stroke.
Methods:We prospectively enrolled consecutive patients with acute ischemic stroke. Whole blood viscosities at a low or high shear rate were measured using a scanning capillary tube viscometer, and were referred to as diastolic blood viscosity (DBV) and systolic blood viscosity (SBV), respectively. Correlations between blood viscosity and acute stroke etiology or chronic radiological manifestations of cerebral small vessel disease were investigated. The temporal profiles of blood viscosity at the onset of stroke and follow-up at 1 and 5 weeks were investigated. Results:Of the 127 patients admitted with acute ischemic stroke, 63 patients were included in the final analyses. DBV at the onset of stroke was significantly higher in small artery occlusion (SAO) stroke than in other stroke subtypes (p= 0.037). DBV showed a significant positive correlation with the number of chronic lacunes (r= 0.274,p = 0.030). The temporal profiles of DBV in SAO stroke showed a transient decrease due to the hydration therapy after 1 week and recurrent elevation at 5 week follow-up (p= 0.009).
Conclusions:Our study suggests that elevated DBV may play a role in the development of acute and chronic
manifestations of cerebral small vessel disease. The recurring elevation of DBV in SAO stroke indicates that sufficient hydration and additional therapeutic interventions targeting blood viscosity may be needed in patients with SAO stroke.
Keywords:Blood viscosity, Small vessel disease, Small artery occlusion, Lacunes, Ischemic stroke
Background
Increased fibrinogen level, whole blood viscosity, and plasma viscosity, which are major factors that determine blood rheology, have been reported as risk factors or predictors for various cardio- or cerebrovascular events [1–11]. Whole blood viscosity can be determined through the complex interactions of blood constituents, including red blood cells, white blood cells, platelets,
fibrinogen, and other plasma proteins [12, 13]. Whole blood viscosity measured at a high shear rate of 300 s−1 or more is referred to as systolic blood viscosity (SBV) [14, 15]. Blood viscosity at a high shear rate represents the frictional characteristics of fast blood flow, defined as having a velocity of over 30 cm/s in a vessel with a large diameter [13]. In the high blood flow state, the in-ertia force representing the kinetic energy is much larger than the viscous force that arises from the blood viscos-ity [15]. Therefore, blood flow is predominantly deter-mined by the inertia force rather than the viscous force [15]. Meanwhile, the whole blood viscosity measured at a low shear rate of 5 s−1or less is referred to as diastolic blood viscosity (DBV) [14, 15]. In the low blood flow * Correspondence:[email protected]
1Department of Neurology, Research Institute of Medical Science, Konkuk
University School of Medicine, Konkuk University Medical Center, Seoul, Republic of Korea
Full list of author information is available at the end of the article
state, in which the blood flows through a vessel with a smaller diameter or through the distal part of an oc-cluded vascular segment, blood viscosity becomes a critical factor for determining the tissue perfusion status [13]. Therefore, DBV may be attributed more to the pathophysiology of small vessel disease than SBV. In the case of coronary microvascular dysfunction without definite occlusion of the main coronary artery, i.e. microvascular angina, increased blood viscosity may play a key role in the deterioration of tissue perfusion at a microvascular level [16]. A comparable microvascular dysfunction in the brain may be chronic cerebral ische-mia due to cerebral small vessel disease [17, 18]. Radio-logical manifestations, such as white matter hyperintensities, lacunes, and microbleeds, are known consequences of impaired microvascular perfusion in the brain and chronic radiological markers for cerebral small vessel disease [19, 20].
The role of blood viscosity has been reported in the stroke population [1–7]. Previous studies, which in-cluded stroke subtype in the scope of their studies, have suggested that the blood viscosity measured in small ar-tery occlusion (SAO) stroke was higher than in other stroke subtypes, such as large artery atherosclerosis (LAA) and/or cardioembolism (CE) [2–4]. Based on these previous studies, we hypothesized that blood vis-cosity may be closely associated with acute or chronic manifestations of cerebral small vessel disease. We first questioned how blood viscosity is related to different eti-ologies leading to acute stroke. Second, we asked how blood viscosity is associated with the chronic radio-logical manifestations of cerebral small vessel disease. Third, we asked if there is an abnormality in blood vis-cosity in relation to acute stroke, how it changes after acute stroke. For the first two questions, we investigated which stroke subtype at the onset of index stroke and which chronic radiological manifestations, including white matter hyperintensities, lacunes, and microbleeds, are correlated with blood viscosity in patients with acute ischemic stroke. For the last question, the temporal pro-files of blood viscosity at both stroke onset and follow-up were investigated.
Methods
Patients and blood sampling
We prospectively enrolled consecutive acute ischemic stroke patients who had been admitted within 3 days of the onset of stroke, from July 2013 to February 2014. Acute ischemic stroke was confirmed by diffusion-weighted magnetic resonance imaging (MRI) in all patients. To minimize the diluting effect on blood viscosity by hydration therapy, the blood samples used to measure the baseline blood viscosity levels were obtained during the initial blood sampling procedure in
the emergency room prior to any medical intervention including hydration therapy. Follow-up measurements of blood viscosity were performed twice, at 1 week and 5 weeks after the baseline measurement. To minimize the transient diluting effect by oral hydration, the samples for the follow-up measurement were obtained under fasting state. Patients were instructed not to eat or drink any-thing, including water, after taking their evening pills until blood sampling was performed early the next morning. Blood samples from patients diagnosed with stroke mimic during the same study period were used with permission, for comparison with those from patients with acute ische-mic stroke. This study was approved by the institutional review board of the Konkuk University Hospital. Written informed consent was obtained from each patient.
Clinical evaluation
The vascular risk factors and laboratory findings affect-ing blood viscosity includaffect-ing hemoglobin, hematocrit, white blood cells, platelets, blood protein, fibrinogen, D-dimer, BUN/Cr (blood urea nitrogen-to-creatinine) ratio, and lipid profiles were investigated. The patients were considered to have hypertension if they were on medica-tion for hypertension or had a blood pressure of ≥140/ 90 mmHg on repeated measurement. Similarly, the pa-tients were considered to have diabetes mellitus if they were on medication for diabetes or had a fasting blood sugar ≥126 mg/dl; and to have hyperlipidemia if they were on lipid-lowering medications or had an overnight fasting cholesterol level ≥220 mg/dl or low-density lipo-protein cholesterol level ≥140 mg/dl. Smoking was de-fined by the current smoking status. The stroke subtype was classified according to the modified Trial of Org 10172 in Acute Stroke Treatment classification [21].
Blood viscosity measurement
Radiological evaluation
T1-weighted, T2-weighted, fluid attenuation inversion recovery (FLAIR), and T2* gradient-echo images were obtained using a 3 T MR system (Signa HDx; GE Med-ical Systems, Milwaukee, WI, USA). The T1- and T2-weighted images were obtained during the same imaging session at the same orientation and slice position: matrix, 128; field of view, 280 × 280 mm; section thick-ness, 5 mm; intersection space, 2 mm. The radiological manifestations associated with small vessel disease in the brain, such as white matter hyperintensities, lacunes, and microbleeds were subsequently defined. The severity of white matter hyperintensities on FLAIR images were assessed by a scale of periventricular hyperintensity (PVH) and deep white matter hyperintensity (DWMH) according to the Fazekas scale [22]. Lacunes were distin-guished from white matter ischemic changes as small distinct lesions (<15 mm in diameter) with a low signal on T1-weighted images, a high signal on T2-weighted images, and perilesional gliotic changes on FLAIR im-ages [23]. Lacunes usually had a hyperintense rim around the cavity on FLAIR images, unlike Virchow Robin spaces or white matter ischemic changes. Acute lacunar infarctions that presented as an index stroke when enrolling patients, were not included in the analysis. Only previous chronic lacunes were included, re-gardless of whether they were symptomatic or asymptom-atic. A microbleed was defined as a small, homogenous, round signal loss lesion (<10 mm in diameter) on T2* gradient-echo images [23].
Statistical analysis
The differences in vascular risk factors or laboratory findings were assessed using a chi square test for dichot-omized variables, and either an independent t test,
Mann-WhitneyUtest, or analysis of variance (ANOVA) with a Tukey’s post-hoc test for continuous variables, where appropriate. The association between SAO stroke and the laboratory variables was assessed using a calcu-lation of crude or adjusted odds ratios with 95% confi-dence intervals through uni- or multivariate logistic models. The associations among the laboratory findings, including DBV, SBV, hematocrit, and fibrinogen levels were analyzed using a Pearson correlation. The associa-tions between laboratory and radiological findings were also analyzed using a Pearson correlation. Differences were considered statistically significant at pvalues of < 0.05. All statistical analyses were performed using SPSS version 17.0.
Results
Patient enrollment
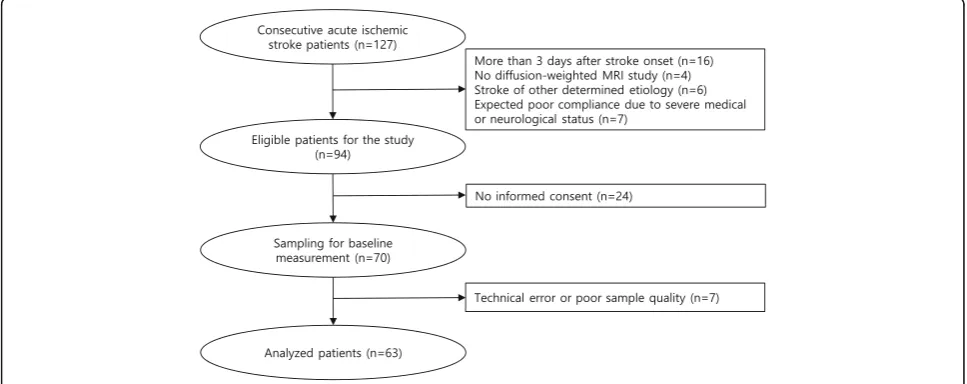
Of the 127 consecutive patients with acute ischemic stroke admitted during the study period from July 2013 to February 2014, samples for blood viscosity measure-ment were obtained from 70 patients (Fig. 1). In order to homogenize the study population, 16 patients with a stroke onset of more than 3 days, 4 patients whose stroke was not confirmed by diffusion-weighted MRI, 6 patients with stroke of other determined etiology, and 7 patients with severe medical or neurological status were excluded. Of the 94 patients eligible for the study, 24 pa-tients refused to provide written informed consent. Seven samples were discarded due to either technical errors or poor quality. Thus, data from 63 patients were analyzed in our study. Sixteen patients were included in the stroke mimic group, which was comprised of 7 patients with non-specific dizziness, 5 patients with transient weakness without a vascular cause, 3 patients with vestibular neuro-nitis, and 1 patient with hypochondriasis. Patients with
suspected transient ischemic attack (TIA) were not included in the stroke mimic group because TIA can be also influenced by blood viscosity.
Demographic and clinical characteristics of patients The clinical demographics, radiological findings, and laboratory findings of patients are presented in Table 1. The most frequent stroke subtype was SAO (n= 25, 39.7%) followed by LAA (n= 23, 36.5%), CE (n= 12, 19.0%), and cryptogenic stroke (Cryp; n= 3, 4.8%). The prevalence of vascular risk factors, except for atrial fibrillation, were not different among the stroke subtypes (Table 1).
Blood viscosity, hematocrit, and blood fibrinogen level The DBV and SBV were significantly correlated with each other (r= 0.456, p< 0.001). The DBV was signifi-cantly correlated with hematocrit (r= 0.421, p= 0.001; Fig. 2a) and the SBV with blood fibrinogen level (r= 0.340,p= 0.01; Fig. 2d).
Blood viscosity and stroke subtypes
The baseline DBV was 274.7 ± 70.9 mP in SAO, followed by 258.9 ± 46.5 mP in Cryp, 252.0 ± 57.5 mP in CE, and 214.5 ± 75.9 mP in LAA stroke subtypes. The baseline DBV in SAO was significantly higher than that in other stroke subtypes (p= 0.037). In addition, the post-hoc test revealed that the baseline DBV in SAO was significantly
Table 1Clinical demographics, radiological findings, and laboratory findings for the 63 patients included in the study Total (n= 63)
SAO (n= 25, 39.7%)
LAA
(n= 23, 36.5%)
CE
(n= 12, 19.0%)
Cryp (n= 3, 4.8%)
Pvalue
Blood viscosity (mean ± sd)
Diastolic blood viscosity, mP 274.7 ± 70.9 214.5 ± 75.9 252.0 ± 57.5 258.9 ± 46.5 0.037*
Systolic blood viscosity, mP 45.2 ± 16.0 38.1 ± 12.4 40.0 ± 4.9 39.0 ± 4.7 0.273
Clinical findings
Age, years (mean ± sd) 62.7 ± 12.9 67.0 ± 15.5 71.2 ± 11.6 63.3 ± 7.5 0.335
Male,n(%) 19 (76) 13 (57) 7 (58) 2 (67) 0.513
Hypertension,n(%) 16 (64) 16 (70) 5 (42) 3 (100) 0.207
Diabetes,n(%) 6 (24) 7 (30) 3 (25) 0 (0) 0.716
Hyperlipidemia,n(%) 6 (24) 3 (13) 1 (8) 0 (0) 0.484
Atrial fibrillation,n(%) 0 (0) 0 (0) 9 (75) 0 (0) <0.001
Smoking,n(%) 14 (56) 8 (35) 2 (17) 0 (0) 0.053
Radiological findings, median (IQR)
PVH, Fazekas scale 1 (1–2) 1 (1–2) 1 (1–3) 2 (0–2) 0.872
DWMH, Fazekas scale 1 (0–1.5) 1 (0–2) 1 (0–2.75) 1 (0–1) 0.834
Number of chronic lacunes 1 (0–3) 0 (0–2) 1 (0–2.75) 1 (0–2) 0.255
Number of microbleeds 0 (0–2.5) 0 (0–1) 1 (0–2) 0 (0–2) 0.869
Laboratory findings (mean ± sd)
Hemoglobin, g/dL 14.9 ± 1.8 13.9 ± 1.9 13.6 ± 1.7 13.7 ± 1.9 0.129
Hematocrit, % 43.4 ± 5.2 40.9 ± 5.0 39.8 ± 4.4 40.0 ± 5.0 0.135
White blood cells, 103/μL 7.2 ± 2.0 7.6 ± 2.9 9.5 ± 3.6 6.8 ± 2.6 0.110
Platelets, 103/μL 238 ± 56 227 ± 48 233 ± 80 199 ± 40 0.700
Total protein, gm/dL 7.1 ± 0.5 7.0 ± 0.4 7.2 ± 0.5 7.2 ± 0.1 0.429
Fibrinogen, mg/dL 323 ± 78 335 ± 71 357 ± 70 215 ± 44 0.099
D-dimer,μg/dL 0.44 ± 0.32 0.75 ± 0.92 1.51 ± 1.93 0.28 ± 0.10 0.038**
BUN/Cr ratio 19.0 ± 4.6 23.1 ± 8.2 21.1 ± 5.3 17.3 ± 5.1 0.115
Total cholesterol, mg/dL 176 ± 36 177 ± 28 155 ± 56 140 ± 32 0.192
Low-density lipoprotein, mg/dL 109 ± 32 108 ± 22 94 ± 50 80 ± 30 0.319
Triglycerides, mg/dL 127 ± 61 116 ± 80 70 ± 60 60 ± 35 0.078
Abbreviations:SAOsmall artery occlusion,LAAlarge artery atherosclerosis,CEcardioembolism,Crypcryptogenic stroke,sdstandard deviation,IQRinterquartile range,PVHperiventricular hyperintensity,DWMHdeep white matter hyperintensity,BUN/Crblood urea nitrogen-to-creatinine
higher compared to that of LAA (p= 0.021; Table 1 and Fig. 3a). Among laboratory variables which were signifi-cantly associated with SAO stroke in the univariate analysis, such as DBV, hemoglobin, and hematocrit, only DBV was still significant in the multivariate analysis adjusted for mul-tiple vascular risk factors, including age, sex, hypertension, diabetes, hyperlipidemia, atrial fibrillation, and smoking (p= 0.033; Table 2). The DBV in the stroke mimic group was 240.8 ± 38.1 mP. Laboratory findings affecting blood viscos-ity were not different among the stroke subtypes, except for elevated D-dimer level in CE (Table 1). The baseline SBV, hematocrit, blood fibrinogen level, and BUN/Cr ratio were not different among the stroke subtypes (Fig. 3b, c, d and e).
Blood viscosity and chronic radiological manifestations of cerebral small vessel disease
The correlations between the major determinants of blood viscosity such as the DBV, SBV, hematocrit, and
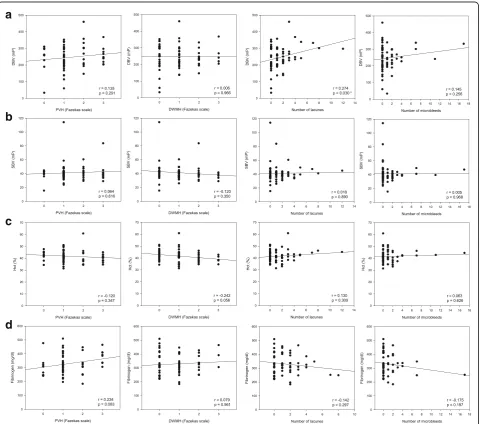
blood fibrinogen level and the chronic radiological mani-festations of cerebral small vessel disease such as white matter hyperintensities, lacunes, and microbleeds, were investigated in all the patients regardless of the stroke subtype. A statistically significant correlation was ob-served between the DBV and the number of chronic lacunes (r= 0.274, p= 0.030; Fig. 4a). The DBV showed trends for positive correlation with the severity of PVH (r= 0.135, p= 0.291; Fig. 4a) or the number of micro-bleeds (r= 0.145, p= 0.256; Fig. 4a), although neither reached statistical significance. The SBV, hematocrit, and blood fibrinogen level were not significantly correlated with any of the radiological manifestations (Fig. 4b, c, and d).
Temporal blood viscosity profiles
The follow-up blood viscosity was measured in 41 out of the 63 patients (65.1%). The patients who were followed up and those who were not followed up were not
a
b
c
d
Fig. 2The correlation of diastolic blood viscosity with hematocritaand blood fibrinogen levelb. The correlation of systolic blood viscosity with hematocritcand blood fibrinogen leveld. *,p< 0.05;DBV, diastolic blood viscosity;SBV, systolic blood viscosity;Hct, hematocrit
a
b
c
d
e
Fig. 3Blood viscosity and stroke subtypes. The diastolic blood viscosity was highest in patients with SAO strokea. The systolic blood viscosity, hematocrit, blood fibrinogen level, and BUN/Cr ratio were not different among the stroke subtypesb,c,d, ande. *p< 0.05 on ANOVA; **p< 0.05 on the post-hoc test; ns, not significant;SAO, small artery occlusion;LAA, large artery atherosclerosis;CE, cardioembolism;Cryp, cryptogenic stroke;
Table 2Crude and adjusted odds ratios for the association with small artery occlusion stroke
Univariate analysis Multivariate analysis
Crude OR (95% CI) Pvalue Adjusted OR (95% CI)** Pvalue
Diastolic blood viscosity (per 1mP) 1.01 (1.00–1.02) 0.023* 1.01 (1.00–1.02) 0.033*
Systolic blood viscosity (per 1mP) 1.05 (0.99–1.12) 0.099 1.05 (0.99–1.10) 0.111
Hemoglobin (per 1 g/dL) 1.42 (1.04–1.94) 0.026* 1.27 (0.87–1.85) 0.223
Hematocrit (per 1%) 1.14 (1.01–1.28) 0.032* 1.09 (0.94–1.25) 0.252
Fibrinogen (per 1 mg/dL) 1.00 (0.99–1.01) 0.560 1.00 (0.99–1.01) 0.604
BUN/Cr ratio (per 1) 0.90 (0.80–1.01) 0.069 0.90 (0.79–1.02) 0.104
Abbreviations:ORodds ratio,CIconfidence interval,BUN/Crblood urea nitrogen-to-creatinine
*,p< 0.05; **, adjusted for multiple vascular risk factors including age, sex, hypertension, diabetes, hyperlipidemia, atrial fibrillation, and smoking
a
b
c
d
significantly different in their demographic character-istics (Table 3). To investigate the role of blood vis-cosity in SAO stroke, the patients were dichotomized into the SAO and non-SAO groups. The baseline DBV was significantly higher in the SAO group than in the non-SAO group (274.7 ± 70.9 mP and 229.8 ± 70.0 mP, respectively; p= 0.016; Fig. 5a). The differ-ence between the DBVs of the two groups was seen to decrease at the 1-week follow-up (SAO, 232.7 ± 54.9 mP; non-SAO, 216.2 ± 48.0 mP; p= 0.394) and increase again at the 5-week follow-up (SAO, 273.2 ± 48.9 mP; non-SAO, 218.6 ± 65.4 mP; p= 0.009; Fig. 5a). In the SAO group, the DBV was elevated again and returned to the baseline level at the stroke onset. On the other hand, the DBV in the non-SAO group was seen to remain within the same range at the 1-week follow-up. The SBV at the 5-week follow-up was also significantly higher in the SAO group than in the non-SAO group (42.0 ± 4.3 mP and 36.1 ± 6.9 mP, respect-ively;p= 0.005; Fig. 5b).
Discussion
Role of blood viscosity in SAO stroke
The whole blood viscosity at a low shear rate, equivalent to the DBV in our study, is dependent on the aggrega-tion of red blood cells in the lumen of small vessels [12, 13]. Both hematocrit and fibrinogen play key roles in the aggregation of red blood cells [12, 13]. In our study, the DBV was correlated with hematocrit, while the SBV was correlated with the blood fibrinogen level. These find-ings appear consistent with the hypothesis that at a low shear rate, the red blood cells form a rouleaux and the blood viscosity is predominantly determined by a func-tion of the concentrafunc-tion and aggregafunc-tion properties of the red blood cells [24]. At a high shear rate, equivalent to the SBV in our study, the red blood cells move as free particles and the blood viscosity is determined not only by the concentration of red blood cells, but also by the plasma viscosity and deformability of red blood cells [24]. Taken together, whole blood viscosity at a low or high shear rate may be affected by the aggregation and deformability of red blood cells or plasma viscosity, re-spectively. In our study, we did not measure these indi-vidual parameters that contribute to whole blood viscosity. Thus, their effects on whole blood viscosity at different shear rates require further investigation.
Considering that the DBV is more important than the SBV for tissue perfusion at the level of small vessels, the DBV may be more responsible than SBV for causing cerebral small vessel disease. When the blood passes through small vessels, an elevated DBV can aggravate the flow disturbance and trigger endothelial remodeling and luminal occlusion, which can lead to acute lacu-nar infarction. In the general population, elevated blood viscosity at a low shear rate or plasma viscosity was correlated with silent cerebral infarction [11, 25]. In the population with stroke or at a high risk for stroke, the blood viscosity at a low shear rate and the plasma viscosity were both elevated [1]. Another study of patients with stroke showed that the blood viscosity was elevated over the entire range of shear rates, especially at low shear rates [6]. A more spe-cific study that included patients with cerebral small vessel disease reported that the blood viscosity, plasma viscosity, and blood fibrinogen level were all elevated in patients with acute lacunar infarction [7]. More studies in relation to stroke subtypes in patients with acute ischemic stroke showed that the blood or plasma viscosity was higher in patients with SAO than in patients with LAA or CE stroke [2–4]. Con-sistent with previous reports suggesting hyperviscosity in SAO stroke, the DBV was higher in patients with SAO than in those with other stroke subtypes in our study. Taken together, elevated DBV at the onset of stroke can impair microvascular tissue perfusion and Table 3Comparison of demographics for patients followed-up
and not-followed-up
Followed-up patients (n= 41)
Not-followed-up patients (n= 22)
Pvalue
Clinical findings
Age, years (mean ± sd) 65.1 ± 13.6 67.5 ± 13.7 0.496
Male,n(%) 25 (61.0) 16 (72.7) 0.415
Hypertension,n(%) 29 (70.7) 11 (50.0) 0.169
Diabetes,n(%) 12 (29.3) 4 (18.2) 0.382
Hyperlipidemia,n(%) 6 (14.6) 4 (18.2) 0.729
Atrial fibrillation,n(%) 6 (14.6) 3 (13.6) 1.000
Smoking,n(%) 15 (36.6) 9 (40.9) 0.790
Laboratory findings (mean ± sd)
Diastolic blood viscosity, mP
258.9 ± 72.5 226.6 ± 71.3 0.623
Systolic blood viscosity, mP
41.4 ± 9.5 41.3 ± 18.1 0.284
Hemoglobin, g/dL 14.2 ± 2.0 14.4 ± 1.7 0.598
Hematocrit, % 41.5 ± 5.5 41.9 ± 4.3 0.333
White blood cells, 103/μL 7.9 ± 3.1 7.5 ± 2.2 0.133
Platelets, 103/μL 228 ± 48 237 ± 73 0.104
Total protein, gm/dL 7.1 ± 0.4 6.9 ± 0.4 0.943
Fibrinogen, mg/dL 332 ± 71 325 ± 87 0.591
D-dimer,μg/dL 0.78 ± 1.25 0.63 ± 0.38 0.105
BUN/Cr ratio 21.0 ± 7.2 20.4 ± 5.0 0.500
Total cholesterol, mg/dL 167 ± 39 178 ± 36 0.943
Low-density lipoprotein, mg/dL
102 ± 34 109 ± 30 0.760
Triglycerides, mg/dL 117 ± 81 92 ± 40 0.091
may be associated with the pathomechanisms involved in SAO stroke.
Association between blood viscosity and chronic radiological manifestations of cerebral small vessel disease
The elevated blood viscosity at stroke onset may indicate not only that acute hyperviscosity triggers stroke, but also that underlying chronic hyperviscosity is present prior to stroke. White matter hyperintensities, lacunes, and microbleeds are various chronic radiological mani-festations of cerebral small vessel disease [17–20]. Therefore, we hypothesized that if the blood viscosity at stroke onset is also associated with white matter hyper-intensities, lacunes, or microbleeds in patients with acute ischemic stroke, the elevated blood viscosity at stroke onset might have been present prior to stroke onset.
The pathomechanisms of lacunes and white matter hyperintensities are intimately related, and acute small subcortical infarctions can progress to chronic lacunes or white matter hyperintensities [19]. Ischemia and chronic leakage of fluid and macromolecules are known to be the main pathophysiologies attributed to the development of white matter lesions [26]. More compli-cated pathologies of white matter lesions, including cerebral ischemia, ependymal loss, demyelination, and microcytic infarction have also been reported [17, 26, 27]. The pathophysiology of microbleeds is a leakage of red blood cells through the loosened blood-brain barrier caused by bleeding-prone small vessel disease related to hypertension or cerebral amyloid angiopathy [19]. Consistent with previous studies suggesting that blood or plasma viscosity is associated with white matter
hyperintensities [11, 14, 25, 28, 29], the severity of PVH in our study showed trends for positive correlation with the DBV or blood fibrinogen level, although neither reached statistical significance. Similar to previous stud-ies that have indicated an association between the ele-vated plasma viscosity and lacunar infarction [3, 11], we observed a significant positive correlation between the DBV and the number of chronic lacunes. Based on this result, the elevated blood viscosity at stroke onset may indicate hyperviscosity not only in the acute period but also in the period prior to stroke onset. A prospective observational study is needed to confirm this hypothesis.
Recurrent blood hyperviscosity in SAO stroke
To investigate the hyperviscosity in SAO stroke, stroke subtypes were dichotomized into SAO and non-SAO groups. The DBV at stroke onset was significantly higher in the SAO group than in the non-SAO group. However, this discrepancy decreased after 1 week, as the DBV de-creased more dramatically in the SAO group than in the non-SAO group. Dehydration leading to the elevation of blood viscosity is considered to be one of the major fac-tors responsible for triggering acute ischemic stroke [3, 4, 30]. Although the DBV was higher in SAO stroke than in other stroke subtypes in our study, the BUN/Cr ratio, which generally reflects the hydration status [31], was not elevated in SAO stroke compared to that in other stroke subtypes. The elevation of DBV in SAO stroke may be caused not only by dehydration, but also by other factors determining blood viscosity. The decrease in the DBV at the 1-week follow-up may be mainly due to the hydration therapy given after admission. In the SAO group, the DBV measured at the 5-week follow-up, when the hydration therapy was terminated, showed a
a
b
recurrent elevation even under the medication for second-ary stroke prevention. The issue of chronic hyperviscosity after stroke has been controversial [2, 4, 5, 7, 10]. Rheo-logical abnormalities were observed in patients even when they were under medication for secondary stroke preven-tion in a cross-secpreven-tional study that included patients in the chronic phase of stroke more than 3 months after the onset [5, 10]. On the contrary, acute rheological abnor-malities at stroke onset normalized over 2 months in another study, regardless of the stroke subtype [2]. This discrepancy may have resulted from the different methods used to measure hyperviscosity or the different study pop-ulations. A recent serial follow-up study of blood viscosity measured at 100 s−1 for 2 weeks during the admission period showed that the blood viscosity was highest at the date of admission and decreased over the following 2 weeks [4]. While a serial follow-up for 2 weeks was performed during the admission period [4], the follow-up at 5 weeks in our study was performed at the outpatient clinic when the hydration therapy had already been terminated. Therefore, the results of our study may reflect the chronic status of blood viscosity after stroke, and are likely unrelated to the hydration ther-apy administered during admission. The recurrent elevation of the DBV in SAO stroke suggests that chronic hyperviscosity may be a persistent underlying pathomechanim of SAO stroke.
Limitations of our study
Our study has several limitations. First, the number of patients included in our study is too small and the statis-tical power to support our conclusion is relatively weak. Second, a cross-sectional study design was used to inves-tigate the role of blood viscosity in acute stroke onset or chronic radiological manifestations of cerebral small vessel disease. However, our results provide the rationale for future prospective observational studies that might confirm the cause-effect relationship. Third, follow-up of the blood viscosity was not performed in all the patients for various reasons. The number of patients lost to follow-up was relatively high (n= 22, 34.9%). Although there were no statistically significant differences in the baseline clinical and laboratory profiles of the patients who were followed-up and those who were not, baseline DBV showed some non-significant differences (followed-up, 258.9 ± 72.5 mP; not-followed-(followed-up, 226.6 ± 71.3 mP; p= 0.623). This might have led to some selection bias. Fourth, the blood viscosity can be easily influenced by hydration therapy using fluids or drinking water. In order to minimize the transient diluting effect by hydration, samples for the baseline and follow-up measurements were obtained before the hydration therapy and in a fasting state, respectively.
Conclusions
Despite the above limitations, based on the results show-ing positive correlations between DBV and SAO stroke at acute stroke onset and chronic lacunar manifestation of the small vessel disease, our study suggests that ele-vated DBV may play a role in the development of acute and chronic manifestations of cerebral small vessel disease. The recurring elevation of the DBV in SAO stroke, even when the patients were receiving medica-tions for secondary stroke prevention, indicates that sufficient hydration and additional therapeutic inter-ventions targeting blood viscosity may be needed in patients with SAO stroke.
Abbreviations
ANOVA:Analysis of variance; BUN/Cr: Blood urea nitrogen-to-creatinine; CE: Cardioembolism; Crypt: Cryptogenic stroke; DBV: Diastolic blood viscosity; DWMH: Deep white matter hyperintensity; EDTA: Ethylenediaminetetraacetic acid; FLAIR: Fluid attenuation inversion recovery; LAA: Large artery atherosclerosis; MRI: Magnetic resonance imaging; PVH: Periventricular hyperintensity; SAO: Small artery occlusion; SBV: Systolic blood viscosity; TIA: Transient ischemic attack
Acknowledgements
Not applicable.
Funding
This work was supported by a Konkuk University Medical Center Research Grant 2014.
Availability of data and materials
The datasets generated and analyzed in this study are not publicly available. Anonymous data is available from the corresponding author upon request.
Authors’contributions
SHS and HYK drafted the manuscript and participated in the general management of the study. SHS, JHK, and JHL interpreted the imaging studies. YM and DHC helped to draft the manuscript. All authors reviewed and approved the final manuscript.
Competing interests
All authors declare that they have no competing interests.
Consent for publication
Not applicable.
Ethics approval and consent to participate
The study was approved by the Ethics Committee of the Konkuk University Hospital, Seoul, Republic of Korea. Informed written consent was obtained from each patient.
Author details
1Department of Neurology, Research Institute of Medical Science, Konkuk
University School of Medicine, Konkuk University Medical Center, Seoul, Republic of Korea.2Department of Laboratory Medicine, Konkuk University
School of Medicine, Konkuk University Medical Center, Seoul, Republic of Korea.3Department of Medical Science, Konkuk University School of
Medicine, Seoul, Republic of Korea.
Received: 23 December 2016 Accepted: 24 January 2017
References
2. Fisher M, Meiselman HJ. Hemorheological factors in cerebral ischemia. Stroke. 1991;22:1164–9.
3. Grotemeyer KC, Kaiser R, Grotemeyer KH, Husstedt IW. Association of elevated plasma viscosity with small vessel occlusion in ischemic cerebral disease. Thromb Res. 2014;133:96–100.
4. Furukawa K, Abumiya T, Sakai K, Hirano M, Osanai T, Shichinohe H, Nakayama N, Kazumata K, Hida K, Houkin K. Increased blood viscosity in ischemic stroke patients with small artery occlusion measured by an electromagnetic spinning sphere viscometer. J Stroke Cerebrovasc Dis. 2016;25:2762–9.
5. Szapary L, Horvath B, Marton Z, Alexy T, Demeter N, Szots M, Klabuzai A, Kesmarky G, Juricskay I, Gaal V, et al. Hemorheological disturbances in patients with chronic cerebrovascular diseases. Clin Hemorheol Microcirc. 2004;31:1–9. 6. Ott EO, Lechner H, Aranibar A. High blood viscosity syndrome in cerebral
infarction. Stroke. 1974;5:330–3.
7. Tsuda Y, Satoh K, Kitadai M, Takahashi T. Hemorheologic profiles of plasma fibrinogen and blood viscosity from silent to acute and chronic cerebral infarctions. J Neurol Sci. 1997;147:49–54.
8. Folsom AR, Peacock JM, Nieto FJ, Rosamond WD, Eigenbrodt ML, Davis CE, Wu KK. Plasma fibrinogen and incident hypertension in the Atherosclerosis Risk in Communities (ARIC) Study. J Hypertens. 1998;16:1579–83. 9. Briley DP, Giraud GD, Beamer NB, Spear EM, Grauer SE, Edwards JM, Clark
WM, Sexton GJ, Coull BM. Spontaneous echo contrast and hemorheologic abnormalities in cerebrovascular disease. Stroke. 1994;25:1564–9. 10. Kowal P, Marcinkowska-Gapinska A. Hemorheological changes dependent
on the time from the onset of ischemic stroke. J Neurol Sci. 2007;258:132–6. 11. Aono Y, Ohkubo T, Kikuya M, Hara A, Kondo T, Obara T, Metoki H, Inoue R,
Asayama K, Shintani Y, et al. Plasma fibrinogen, ambulatory blood pressure, and silent cerebrovascular lesions: the Ohasama study. Arterioscler Thromb Vasc Biol. 2007;27:963–8.
12. Grotta J, Ostrow P, Fraifeld E, Hartman D, Gary H. Fibrinogen, blood viscosity, and cerebral ischemia. Stroke. 1985;16:192–8.
13. Cho YI, Cho DJ, Rosenson RS. Endothelial shear stress and blood viscosity in peripheral arterial disease. Curr Atheroscler Rep. 2014;16:404.
14. Noh HJ, Seo SW, Jeong Y, Park JE, Kim GH, Noh Y, Cho H, Kim HJ, Yoon CW, Ye BS, et al. Blood viscosity in subcortical vascular mild cognitive impairment with versus without cerebral amyloid burden. J Stroke Cerebrovasc Dis. 2014;23:958–66.
15. Kim H, Cho YI, Lee DH, Park CM, Moon HW, Hur M, Kim JQ, Yun YM. Analytical performance evaluation of the scanning capillary tube viscometer for measurement of whole blood viscosity. Clin Biochem. 2013;46:139–42. 16. Crea F, Camici PG, Bairey Merz CN. Coronary microvascular dysfunction: an
update. Eur Heart J. 2014;35:1101–11.
17. Pantoni L. Cerebral small vessel disease: from pathogenesis and clinical characteristics to therapeutic challenges. Lancet Neurol. 2010;9:689–701. 18. Mok V, Kim JS. Prevention and management of cerebral small vessel
disease. J Stroke. 2015;17:111–22.
19. Norrving B. Evolving concept of small vessel disease through advanced brain imaging. J Stroke. 2015;17:94–100.
20. Kim BJ, Lee SH. Prognostic impact of cerebral small vessel disease on stroke outcome. J Stroke. 2015;17:101–10.
21. Adams Jr HP, Bendixen BH, Kappelle LJ, Biller J, Love BB, Gordon DL, Marsh 3rd EE. Classification of subtype of acute ischemic stroke. Definitions for use in a multicenter clinical trial. TOAST. Trial of Org 10172 in acute stroke treatment. Stroke. 1993;24:35–41.
22. Fazekas F, Chawluk JB, Alavi A, Hurtig HI, Zimmerman RA. MR signal abnormalities at 1.5 T in Alzheimer's dementia and normal aging. AJR Am J Roentgenol. 1987;149:351–6.
23. Lee JH, Kim YJ, Moon Y, Cho HJ, Kim HY. Acute simultaneous multiple lacunar infarcts: a severe disease entity in small artery disease. Eur Neurol. 2012;67:303–11.
24. Cecchi E, Marcucci R, Poli D, Antonucci E, Abbate R, Gensini GF, Prisco D, Mannini L. Hyperviscosity as a possible risk factor for cerebral ischemic complications in atrial fibrillation patients. Am J Cardiol. 2006;97:1745–8. 25. Li RY, Cao ZG, Li Y, Wang RT. Increased whole blood viscosity is associated
with silent cerebral infarction. Clin Hemorheol Microcirc. 2015;59:301–7. 26. Kim KW, Macfall JR, Payne ME. Classification of white matter lesions on magnetic
resonance imaging in elderly persons. Biol Psychiatry. 2008;64:273–80. 27. Chen YF, Wang H, Chu Y, Huang YC, Su MY. Regional quantification of
white matter hyperintensity in normal aging, mild cognitive impairment, and Alzheimer's disease. Dement Geriatr Cogn Disord. 2006;22:177–84.
28. Wada M, Takahashi Y, Iseki C, Kawanami T, Daimon M, Kato T. Plasma fibrinogen, global cognitive function, and cerebral small vessel disease: results of a cross-sectional study in community-dwelling Japanese elderly. Intern Med. 2011;50:999–1007.
29. Schneider R, Ringelstein EB, Zeumer H, Kiesewetter H, Jung F. The role of plasma hyperviscosity in subcortical arteriosclerotic encephalopathy (Binswanger's disease). J Neurol. 1987;234:67–73.
30. Mucke S, Grotemeyer KH, Stahlhut L, Husstedt IW, Evers S. The influence of fluid intake on stroke recurrence—a prospective study. J Neurol Sci. 2012;315:82–5. 31. Schrock JW, Glasenapp M, Drogell K. Elevated blood urea nitrogen/
creatinine ratio is associated with poor outcome in patients with ischemic stroke. Clin Neurol Neurosurg. 2012;114:881–4.
• We accept pre-submission inquiries
• Our selector tool helps you to find the most relevant journal • We provide round the clock customer support
• Convenient online submission • Thorough peer review
• Inclusion in PubMed and all major indexing services • Maximum visibility for your research
Submit your manuscript at www.biomedcentral.com/submit