Available Online at www.ijpret.com 20
INTERNATIONAL JOURNAL OF PURE AND
APPLIED RESEARCH IN ENGINEERING AND
TECHNOLOGY
A PATH FOR HORIZING YOUR INNOVATIVE WORK
DETERMINATION OF PRIMARY NUTRIENTS DEFICIENCY IN PLANT USING
IMAGE PROCESSING
MR. S. S. AYANE, MR. K. B. KOTANGALE, MR. P. V. SONTAKKE
Asst. Prof., Pimpri Chinchwad College of Engineering, Nigdi, Pune.
Accepted Date: 28/06/2015; Published Date: 01/08/2015
\
Abstract: - Every living organism in this world requires the sufficient amount of the variety of proteins and nutrients for their normal growth. Similarly the plants also require sixteen different types of nutrients for the normal growth and to produce quality yield. Deficiency of any of the nutrient in the plant affects the normal growth and in turn results in to production loss and poor quality of yield. In early days there are several laboratory methods developed to perform the analysis of plant leaf in order to detect the nutrients deficiencies in plant by using chemical processes. This overall process takes around seven days for the analysis and its results. The lab results also contain the remedy to overcome the deficiency. But the chemical processing methods are time consuming and costly. Mostly diseases are seen on the leaves or stems of the plant. According to the visual observation of the pattern appearing on the leaf of plant, the observer used to decide which pesticide/ fertilizer to be use but no idea how much. Hence some time wastage of money and overdose of pesticide/ fertilizer may disturb the life cycle of plant as well as surrounding. This work gives the fast and accurate solution to analyze the different patterns caused due to different primary nutrient deficiencies in the plant of cotton by using image processing techniques. It is possible to detect the percentage deficiency of nutrients by simply taking the image of crop and processing it to get the analytical results so that one can apply the appropriate amount of pesticide/ fertilizer at right time to the crop
Keywords:Image processing, Cotton, Nutrients, Deficiency
Corresponding Author: MR. S. S. AYANE
Access Online On:
www.ijpret.com
How to Cite This Article:
Available Online at www.ijpret.com 21
INTRODUCTION
As India is an agricultural country and 70% of the population depends on agriculture. Observers have wide range of diversity to select particular fruit and vegetable crop for optimum throughput. However the cultivation of these crops for optimum yield and quality product is highly technical. It can be further increased by the aid of technological support. Maharashtra is the important cotton growing state in India with 31.33 lacks hectors area and production of approximate 62 lack bales. The second largest producer of cotton in the world, about 3 million observers is engaged in cotton cultivation in the state mostly in backward region of
Marathwada and Vidarbha. [1]
The cotton leaf mainly suffers from the diseases like foliar leaf spot of cotton, fungus, viral diseases. About 80% to 90% of diseases reflect the symptoms on the leaves of cotton plant. Hence we are focusing on the pattern changes in the leaf of cotton. These diseases mainly
occurs due to the deficiency of nutrients[1].The image processing now a day’s become the key
technique for the diagnosis of various features of the crop, providing new approach to explore the field of agriculture. The image processing can be used in the agricultural applications for the
following purposes. [2]
1. To detect diseased leaf, stem, fruit.
2. To determine affected area by disease.
3. To find shape of affected area.
4. To determine the size and shape of fruits.
Leaf area is one of the most important features that describe the deficiency of leaf. In case of nitrogen deficiency, the cotton leaf size gets reduce than that of normal leaf hence by calculating the area of deficient leaf and comparing it with that of healthy leaf, it is possible to
conclude that the leaf is nitrogen deficient. The Nitrogen deficiency shows reduction in area
with pale yellowish color on leaf. Similarly Phosphorus (P) deficiency shows the symptom like leaves with dark green color with reduced leaf size and and Potassium (K) deficiency results in
leaf with reddish brown. [3]
2. METERIALS & METHODS
Available Online at www.ijpret.com 22 2.1. System Layout.
Different processing techniques and different approaches are use to perform analysis on the plant. This work proposes another approach for the detection of nutrient deficiency in cotton crop by processing the captured image through MATLAB software. In this method the image captured by using 14 MP digital camera is preprocessed for the noise removal. Since all the nutrients deficiencies results in to different color patterns, these variations in the patterns are classified with respect to healthy leaf in the color space. The various features of RGB image are extracted using CIE La*b* color space model to determine the deficiency. The feature extraction may involve Spectral features such as special color or tone, spectral parameters, Geometric features such as area of leaf and Textural features such as pattern, spatial frequency etc. Generalized project flow diagram is as shown in figure 2.1. Depending on the type of nutrient deficiency, the method of feature extraction has to be change in the flow diagram. The captured images have to preprocess for the noise removal before applying the feature extraction step. In this work three features are taken under consideration first dead cell, second is the leaf area and third is leaf color. For the primary nutrients deficiency detection all these three features are common. The steps are explained in the respective sections for the specific feature extraction.
No
Yes
Fig.2.1. System Layout
IMAGE ACQUISITION
PREPROCESSING START
IMAGE TRANSFORM
FEATURE EXTRACTION
ANALYSIS LABORATORY TEST
RESULTS
ERROR WITHIN LEVEL?
Available Online at www.ijpret.com 23 2.2. Image Acquisition.
For the analysis the Cotton crop of AJIT brand is selected. The leaf whose deficiency is to be determined was placed flat on the white background. The camera was held horizontally to the plane of the leaf. The distance between the camera and the leaf was neither too closed nor too far; it was adjusted such a way that the photograph was covering only background and leaf as shown in figure 2.2. Nearly 15 such photographs of cotton leafs of same plot are taken for the analysis. These images are saved in JPEG format for further processing.
Fig.2.2.Captured sample Images of Cotton Leaves.
2.3 DEAD CELL DETECTION
Captured RGB image of healthy leaf is first converted in to gray scale image to plot the histogram. Same steps are carried out for the deficient leaf. From the obtained histogram shown in figure 3.1, following points are concluded.
1. Histogram of normal leaf is concentrated symmetrically at certain value on the gray scale.
2. Histogram of normal leaf has maximum peak which indicates frequency of occurrence of
single color in leaf
3. Histogram of deficient leaf has non symmetric shape at certain values on gray scale.
Available Online at www.ijpret.com 24 From the above conclusions we can differentiate between normal and deficient leaf from the histograms.
2. 4 LEAF AREA MEASUREMENT
It’s possible to calculate the area by using different approaches as when one thinks of the area the first thought comes to mind is physical dimensions of the object, but here the approach is different. The method is based on the pixel statistics. The reference coin of known diameter is used to find the area of leaf. First the RGB image of coin is converted in to gray scale and then in to binary image. The unit pixel area of the reference coin is calculated from the binary image, then this area is multiplied with the pixels belongs to the leaf whose area is to be calculated. In this method the leaf is separated in to three planes namely Red, Green, and Blue Plane respectively. The leaf consists of green color as a major component hence only the green components are measured using thresholding. The threshold value is obtained by trial and error technique. Once the green pixels are calculated the area can be easily calculated using the unit pixel area. The above procedure is repeated for the sample leaf. The results obtained for the sample leaf is compared with that of normal leaf to conclude the deficiency.
2.5 COLOR IMAGE SEGMENTATION
Leaf color is the most important feature that is used to quantify the Nitrogen and potassium deficiency. As the deficiency of nitrogen shows the pale yellowish green symptoms, and potassium shows reddish brown. The sample leaf image is segmented to obtain the required color. From the scatter plot count the different color pixels. Repeat the same procedure for the healthy leaf. Compare the pixel count of both leaves to obtain the amount of nitrogen deficiency. It is obvious that in deficient leaf the count of yellow and reddish brown color pixel
will be more than that of healthy leaf. Estimation is done by using image RGB to L*a*b* COLOR
SPACE.
The L*a*b* color space (also known as CIELAB or CIE L*a*b*) enables you to quantify these
visual differences. The L*a*b* color space is derived from the CIE XYZ tri-stimulus values. The
L*a*b* space consists of a luminosity 'L*' or brightness layer, chromaticity layer 'a*' indicating
where color falls along the red-green axis, and chromaticity layer 'b*' indicating where the
Available Online at www.ijpret.com 25 The CIELAB color space is organized in cube form. The L* axis runs from top to bottom. The maximum for the L* is 100, which represents the perfect reflecting diffuser. The minimum for the L* is 0(Zero), which represents black. The* and b* axes have no specific numerical limits. Positive a* is Red. Negative a* is Green, Positive b* is Yellow, Negative b* is Blue. Below is the diagram representing the CIE LAB color space.
The CIELAB color scale may be used on any object whose color may be measured. It provides a standard scale for comparison of color values.
3. RESULTS
Results obtained from above three steps are shown below
Fig.3.1: Results of Dead cell Analysis
Available Online at www.ijpret.com 26
Fig.3.3: Scatter plot of Healthy Leaf Image
Fig.3.4: Scatter Plot of Sample Leaf Image.
4. CONCLUSION & DISCUSSSION
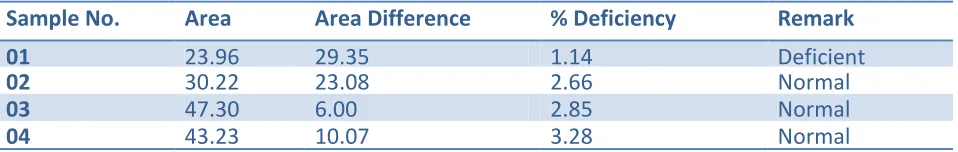
The field analysis is done by using the methods discussed and the results obtained for different feature are summarized in the table 4.1 below. Nearly ten sample of another cotton lot are
taken for the analysis. The area of Healthy leaf is found 53.31cm2. In order to determine the
percentage deficiency, it is required to take the average of values generated by the CIE LAB for ten to fifteen leaves. These results are compared with standard values to conclude.
Table 4.1: Field analysis Results
Sample No. Area Area Difference % Deficiency Remark
01 23.96 29.35 1.14 Deficient
02 30.22 23.08 2.66 Normal
03 47.30 6.00 2.85 Normal
Available Online at www.ijpret.com 27
05 32.42 20.88 0.12 Deficient
06 34.98 18.33 2.02 Deficient
07 32.28 21.02 1.03 Deficient
08 34.81 18.50 0.82 Deficient
09 19.65 33.66 4.78 Excess
10 27.03 26.27 3.81 Excess
REFERENCES
1. Sanjay B Patil, Dr. S. K. Bodhe,” Leaf Diseases severity measurement using Image Processing”
International Journal of Engineering and Technology Vol.3 (5), 2011, pp.297-301.
2. H.Al-Hiary, S.Bani Ahmad. “Fast and Accurate Detection and classification of plant
diseases”IJCA (0975-8887), Volume 17-No.1 March 2011.
3. Viraj A. Gulhane, Dr. A. A. Gurjar. “Detection of Diseases on Cotton leaves and its possible
Diagnosis”, JIP, Volume (5), Issue (5):2011.
4. Jaymala K. Patil, Raj Kumar, “Advances in Image Processing for Detection of Plant
Diseases.”Journal of advanced Bioinformatics Application and research, Vol. 2, Issue 2, June-2011, pp135-141.
5. Sanjay B Patil, Dr. S. K. Bodhe, “Image processing Method to measure Sugarcane Leaf area,
“JEST, Vol. 3, No.8 Aug.2011
6. Sanjay B Patil, Dr. S. K. Bodhe, “Betel Leaf Area Measurement Using Image Processing,”
IJCSE, Vol 3.No 7, July 2011, pp.2856-2660.
7. Enrique Rico-Garcia, Fabiola Hernandez, “Two new methods for the estimation of leaf area
using digital photography” International Journal of agriculture and Biology, ISSN Online: 1814-9596, 2009.
8. A. H. Prakash, S. E. S. A. Khader “Nutritional and physiological disorders of Cotton” Model
training course on Cultivation of long staple cotton (ELS) December 2007.
9. Hezhong Dong, Wei Tang, Zhenhuai Li. “On Potassium Deficiency in cotton –Disorder, Caused
Available Online at www.ijpret.com 28
10.Spector, A. Z. 1989. Achieving application requirements. In Distributed Systems, S.
Mullender
11.S. S. Ayane, M. A. Khan, et.al” Measurement of Leaf Area: A New Approach “IJPRET Issue