EFFECT OF DIFFERENT SOIL TYPES ON GROWTH AND PRODUCTIVITY OF
EUPHORBIA LATHYRIS
L. A HYDROCARBON YIELDING PLANT
JOLLY GARG AND ASHWANI KUMAR*
Dayanand Arya KANYA P.G. College, Moradabad, 244001, U.P. India. *Department of Botany, University of Rajasthan, Jaipur 302004, India.
ABSTRACT
Energy security is one of the most pressing challenges of the 21st century. A shift to next-generational fuels and increased use of renewable source of energy are increasingly being considered as viable options. Euphorbia lathyris is one of the most-suitable species that falls into the category of hydrocarbon yielding plants. This plant is suitable to grow in arid and semiarid climate. Addition of gravel to the sand considerably enhanced the plant height, fresh weight and dry weight. Maximum hexane, methanol and total extractables were also favoured by the addition of gravel.
key words :- Energy security, renewable source of energy, biofuel, Euphorbia lathyris L., hydrocarbons, semi arid climate, hexane extractables, methanol exctactables, edhephic factor, growth, productivity, chlorophyll, hexane extractables, methanol exctactables
INTRODUCTION
Fertile soil is the most important resource for the entire living world. Apart from providing a solid substratum on which we live, the soil provides us most of our necessities through the plant and animal communities which develop on it . Our prosperity and well-being depend largely fertile land and productive soils. Though an essential natural resource we often fail to realize the tremendous importance of soils underneath us. Mankind can live without fossil fuels but it cannot survive the depletion of this thin crust of loose material on which we depend for our food supplies. however, with an ever rising population and pressure of demand on our natural resources, degeneration of soils has already begun. As we look towards a new century, winds of change are needed to manage the limited resources for meeting the challenges of a fast – growing population. New demands are being made on
energy to ensure security and enhance the environmental quality. While the world is short of a petroleum reserve, it has a large arable land as well as good climatic conditions with adequate rainfall in large, parts of the area to account for large biomass production each year. For the possible reason of edible oil demand being higher than its production, it is not recommended in many developing countries to divert this oil and good arable land for production of bio- diesel. Thus, there are pressures on the government to explore more lands besides arable lands and technologies to increase crop production in such not-so-good lands. Technologies, at the same time, have to be cost- effective because majority of the people are marginal and cannot afford high inputs.
land of farmers where non-edible oilseeds can be grown. Euphorbia lathyris is one of the most-suitable species that falls into this category. Biomass is the oldest known source of renewable energy having a high energy content. It is an attractive energy source for a number of reasons. It is also more evenly distributed over the earth’s surface compared to the finite energy sources, and may be exploited using more environmentally friendly technologies, and national energy self- sufficiency across the earth. It acts as a source of solid, liquid as well as gaseous fuels. Increase in worldwide energy consumption from 2001 to 2025 is projected to be 45%. Liquid biofuels are derived from biomass and are processed to produce liquid fuel. Calvin 76; 77; 78a; 79a; 79b; 80; 83a; 83b; 84; 85; Calvin et. al., 81; 82 ; Garg and Kumar 2011a; 2011 b) Such plantations are a means of producing fuels by harvesting and storing solar energy in plants with a fuel value, for purposes of cooking in homes i.e., firewood), or for industrial use i. e., fuelwood (Khoshoo, 82; 84).
Soil is a heterogenous material which may be considered as consisting of three major components : a solid phase, a liquid phase and a gaseous phase (Mengel and Kirkby, 1978). Rajasthan has dominant light-textured aggraded plains having mostly a plane brown to brown, fine sandy to loamy fine sand, and nearly structureless surface, a brown to yellowish brown, loamy fine sand, very weak to weak subangular blocky varyingly calcareous subsoil followed by a zone of lime accumulation at depths of 60 to 120 cm (Dhir and Jain, 1982).
A large part of the arid region belonging to western Rajasthan, Haryana, Punjab lying between the Indus river and Aravalli range is affected by desert conditions of recent origin. This part is covered under a mantle of brown sand which, combined with the arid climate, results in poor soil development. The most predominent component of the desert sand is quartz in well rounded grains, but feldspar and horn-blende grains also occur with a fair proportion of calcareous grains. The desert proper, owing to the physiographic conditions of its situation, though lying in the track of south westerly monsoon, receives little rain. The sands
which cover the area are partly derived from the disintegration of subjacent rocks, but are largely blown form the coastal regions of the Indus velley. Some of these soils contain high percentage of soluble salts, possess high pH, have a low loss on ignition, a varying percentage of calcium carbonate and are poor in organic matter (Raychaudhuri, 1978).
The Rajasthan desert is a vast sandy plain including isolated hills or rock outcrops at places. Though on the whole the tract is sandy, the soil improves in fertility from west and north-west to east and north-east. In many parts the soils are saline or alkaline, with unfavourable physical conditions and high pH (Anonymous, 1970).
The ancient crystalline and metamorphic rocks on meteroic weathering have given rise to the red soils. The colour of the soil is due to the wide diffusion of iron rather than to a high proportion of it. They are generally poor in nitrogen, phosphorus and humus. These soils are also generally poor in lime, potash, iron oxide, and phosphorus than the regur soils (Digar and Barde, 1982).
MATERIALS AND METHODS
For the present investigations 4 kg of each soil type was taken. (i) Sandy soil obtained at a depth of 1-2 meter was filled in ca 23 cm earthen pots, (ii) red soil was obtained from local queries, (iii) gravel soil consisted of particles measuring ca 1-2 mm in diameter and (iv) a mixture of gravel and sand mixed in equal proportion was also employed for the present investigations. Plants were watered to the 60 to 80 per cent moisture of the field capacity. Soil samples from all the pots were analysed for potassium (K), sodium (Na), magnesium (Mg), calcium (Ca), amonium (NH4),
nitrate (NO3), phosphorus pentaoxide (P2O5) and
potassium dioxide (K2O). Plants were harvested
RESULTS
Effect of different soil types
The results are presented in Fig. 1. Among the gravel, red soil and sand, the sand supported maximum increase in plant height, fresh weight and per cent dry weight. This was followed by red soil. Gravel showed poor plant growth, the leaves were reddish brown with poor chlorophyll contents. A mixture of gravel and sand favoured maximum increase in plant height, fresh weight and dry weight. Correspondingly maximum increase in under ground plant parts was recorded (Fig. 2).
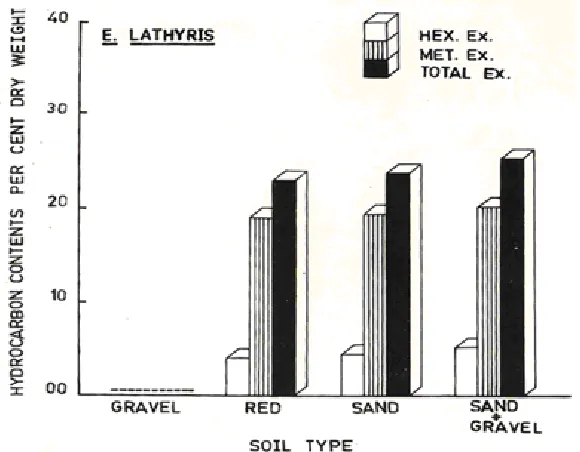
Sand mixed with gravel supported maximum HE and ME followed by sand and red soil. HE and Me could not be determined in plants grown in gravel (Fig. 3).
There was gradual increase in chlorophyll contents from gravel to red soil, sandy soil, and sand mixed with gravel. Highest level of chlorophyll b was recorded in sand mixed with gravel (Fig. 4). Although the growth and chlorophyll contents were poor in gravel soil, maximum total sugars were recorded in this soil type. The sugar contents were found in decreasing order in sand, sand mixed with gravel and red soil (Fig. 5).
Analysis of soil samples
Different cationic and anionic fractions were separated and further analysed for different elements in all the three soil fractions, i.e. (a) soil solution, (b) absorbed ions and (c) fixed in colloids (Table 1).
Fig. 1 : Effect of different soil types on growth of E. lathyris L. (5-months-old plants).
.
Fig. 2 Effect of different soil types on plant height, above ground and under ground fresh weight and dry weight of E. lathyris L.
Fig 4 : Effect of different soil types of chlorophyll a, chlorophyll b and total chlorophyll contents in leaves of E. lathyris L. expressed in mg/g fresh weight basis.
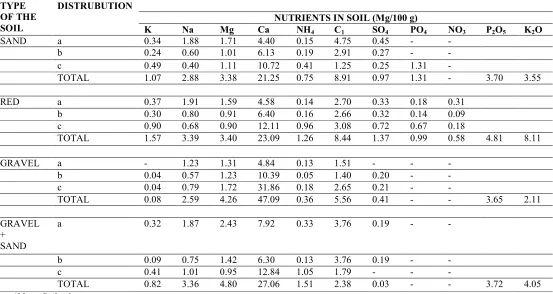
TABLE -1 : ANALYSIS OF DIFFERENT SOIL TYPES FOR THEIR NUTRIENTS (mg/100 g soil)
TYPE OF THE SOIL
DISTRUBUTION
NUTRIENTS IN SOIL (Mg/100 g)
K Na Mg Ca NH4 C1 SO4 PO4 NO3 P2O5 K2O
SAND a 0.34 1.88 1.71 4.40 0.15 4.75 0.45 - -
b 0.24 0.60 1.01 6.13 0.19 2.91 0.27 - -
c 0.49 0.40 1.11 10.72 0.41 1.25 0.25 1.31 -
TOTAL 1.07 2.88 3.38 21.25 0.75 8.91 0.97 1.31 - 3.70 3.55
RED a 0.37 1.91 1.59 4.58 0.14 2.70 0.33 0.18 0.31
b 0.30 0.80 0.91 6.40 0.16 2.66 0.32 0.14 0.09
c 0.90 0.68 0.90 12.11 0.96 3.08 0.72 0.67 0.18
TOTAL 1.57 3.39 3.40 23.09 1.26 8.44 1.37 0.99 0.58 4.81 8.11
GRAVEL a - 1.23 1.31 4.84 0.13 1.51 - - -
b 0.04 0.57 1.23 10.39 0.05 1.40 0.20 - -
c 0.04 0.79 1.72 31.86 0.18 2.65 0.21 - -
TOTAL 0.08 2.59 4.26 47.09 0.36 5.56 0.41 - - 3.65 2.11
GRAVEL +
SAND
a 0.32 1.87 2.43 7.92 0.33 3.76 0.19 - -
b 0.09 0.75 1.42 6.30 0.13 3.76 0.19 - -
c 0.41 1.01 0.95 12.84 1.05 1.79 - - -
TOTAL 0.82 3.36 4.80 27.06 1.51 2.38 0.03 - - 3.72 4.05
Abb. a. Soil solution b. Absorbed ions c. Fixed in collids
Potassium: Although all the soil types and combination were poor in potassium, in general red soils showed the highest level of potassium (1.57 mg/100g) and most of it was in the form of fixed colloids in soil particles (0.90 mg/100g). This was followed by sand (1.07 mg/100g), gravel mixed with sand (0.82 mg/100 g) and gravel (0.08 mg/100g).
Sodium:The highest level of sodium was recorded in gravel mixed with sand (3.63 mg/100g), followed by red soil (3.39 mg/100 g), sand (2.88 mg/100g) and gravel (2.59 mg/100g). Maximum amount of sodium was recorded in soil solution in all cases. Magnesium: The highest level of magnesium was recorded in gravel mixed with sand (4.80 mg/100g) and followed by gravel (4.26 mg/100g) sand (3.83 mg/100g) and red soil (3.40 mg/100 g).
Calcium: The highest level of calcium was recorded in gravel (47.09 mg/100g) followed by gravel mixed with sand (27.06 mg/100g), red (23.09
mg/100g) and sandy soil (21.25 mg/100g). There was gradual increase in level of calcium from soil solution to absorbed ions and finally the fixed in colloids.
Ammonium: In general poor levels of ammonium were recorded in all the soil types. However, gravel mixed with sand gave the highest level of ammonium (1.51 mg/100g), followed by red (1.26 mg/100g), sand (0.75 mg/100 g) and gravel (0.36 mg/100 g).
Chloride: Not much variations were recorded in chloride ions in different soil types as it ranged from gravel (5.56 mg/100g), gravel mixed with sand (7.93 mg/100g), red soil (8.44 mg/100g) to sand (8.91 mg/100g).
Phosphate:Low levels of phosphate were recorded in sand (1.31 mg/100g) and red soil (0.99 mg/100g), phosphate was not detectable in other soil types, soil solution and ascorbic ions form of sand.
Nitrate: Very low level of nitrate was detected in red soils (0.58 mg/100g). It was not recorded in other soil types.
P2O5: Only total P2O5 contents were recorded. The
highest level of P2O5 was recorded in red soils (4.81
mg/100g). The level of P2O5 was almost the same in
sand mixed with gravel (3.72 mg/100 g), sandy soil (3.70 mg / 100g), and gravel (3.65 mg/100 g). K2O: Only total K2O contents were recorded and
the maximum was in red soil (8.11 mg/100 g), followed by gravel mixed with sand (4.05 mg/100g), sand (3.55 mg/100 g), and gravel (2.11 mg/100g).
Analysis of Plant Materials
Results of the analysis for sodium, potassium, calcium, magnesium, chlorides, phosphates and phosphorus contents of dried materials from the above ground plant parts grown in different soil types except gravel grown plants are shown in Table 2.
Maximum sodium (2.51 mg/g), calcium (21.50 mg/g), phosphate (9.26 mg/g) and phosphorus (3.02 mg/g) were recorded in plants grown in sand, while potassium (17.87 mg/g), magnesium (7.91 mg/g) and chlorides (4.71 mg/g) were recorded in plants grown in red soil.
Minimum amounts of sodium (0.79 mg/g) and calcium (18.53 mg/g) were recorded in plants grown in red soil, while minimum amounts of potassium (13.67 mg/g), magnesium (4.55 mg/g), chlorides (3.22 mg/g), phosphates (7.96 mg/g) and phosphorus (2.59 mg/g) were recorded in plants grown in sand mixed with gravel.
TABLE-2 : ANALYSIS OF ABOVE GROUND PARTS OF PLANTS GROWN IN DIFFERENT SOIL TYPES
SOIL TYPES NUTTIENTS IN PLANTS mg/g dry wt.
Na K Ca Mg Cl PO4 P
1. BAND 2.51 16.80 21.50 5.33 4.32 9.26 3.02
2. RED 0.79 17.87 18.53 7.91 4.71 8.78 2.85
3. GRAVEL - - - -
4. GRAVEL
+SAND
1.72 13.67 21.40 4.55 2.22 7.95 2.59
* Analysis could not be done due to insufficient material.
Soil is a heterogeneous material which may be considered as consisting of three major components; a solid phase, a liquid phase and a gaseous phase (Mengel and Kirkby, 1978). All the three phases specifically influence the supply of plant roots with nutrients. The inorganic particles of the solid phase contain cationic nutrients such as potassium, sodium, calcium, magnesium, iron, manganese, zinc and copper, whilst the organic particles of this phase provide the main reserve of nitrogen and to a
bacteria, fungi, animals and the atmosphere. This process results in the supply of living soil organisms with oxygen and removal of carbon dioxide produced by respiration from soil atmosphere.
Thus the soil type influences the growth of the plants direct or indirectly by interacting with a large number of factors. However, the water infiltration rates were shown to be markedly influenced by the morphological characters of the profile. Water intake was lower in fine textures of the profile. Water intake was lower in fine textured soils in general and the lowest in silt loam where sodium was present in appreciable amounts on the exchange complex. Soil-water-plant relationship is therefore, of great importance (Singh and Tomer, 1982).
The red loamy soils are found in the southern districts namely Dungarpur, Banswara and parts of Udaipur and Chittorgarh districts. These are soils of hilly plains. They are characteristically reddish in colour and medium in texture. They are generally non-calcareous and are poor in potassium, sodium, phosphates, phosphorus pentaoxide, potassium dioxide, and nitrates; which was amply reflected in poor growth and hexane extractables. However, red soils were comparatively better over gravel which represented coarse grains. This was apparently due to poor water retention capacity, almost absence of humus and poor nutrient status of gravel. The vast areas of land in Rajasthan possess sandy soil. These soils are also poor in humus contents. The calcium content in field collids was more than double. However, sodium content was more in soil solution. The low mineral contents supported poor growth of the plants. These soils also had poor quantities of magnesium and copper. Thus the plants raised in sandy soil showed comparatively poor growth, chlorophyll development and hexane extractables.
Addition of gravel to the sand considerably enhanced the plant height, fresh weight and dry weight. Maximum hexane, methanol and total extractables were also favoured by the addition of gravel. Besides several factors, which might be responsible for this, one factor which needs closer examination is the higher contents of calcium in the gravel, soils. Possibly this leads to the promotion of
growth and latex yield of the plants. Mizuno (1960) also reported a positive correlation during active growth phase between calcium content and carbohydrate contents of peanut pods. Addition of gypsum has been reported to cause increase in plant growth (Abrol, 1982). However this need further clarification.
Gravel which promoted comparatively poor chlorophyll contents showed maximum amount of sugar contents. This could be because of the fact that due to poor growth, the sugar produced in photosynthesis was not directly utilized and it accumulated in the plant system.
Vegetative growth and hydrocarbon production was found to be variable in different soil types. This four soil types tested were local sand, gravel, red soil and sand mixed with gravel in equal proportions.
The sand mixed with gravel supported the maximum increase in plant height, fresh weight, dry weight and per cent dry weight followed by sand, red soil and gravel. Similarly under- ground fresh and dry weights were maximum in sand mixed with gravel followed by sand, red soil and gravel.
Maximum hexane and methanol extractables were recorded in sand mixed with gravel, followed by sand and red soils.
Chlorophyll production was maximum in sand mixed with gravel followed by sand, red soil and gravel. Sand mixed with gravel supported maximum chlorophyll b.
Maximum sugar contents were recorded in gravel soil followed by sand, sand mixed with gravel and red soils.
ANALYSIS OF DIFFERENT SOIL TYPES In the soil samples, different cationic and anionic fractions were separated and further analysed for different elements in all the three soil fractions i.e. (a) soil eolution, (b) absorbed ions and (c) fixed in colloids.
Red soil consisted of maximum potassium (1.57 mg/100g), sulphates (1.37 mg/100g), P2O5
(4.81 mg/100g) and K2O (8.11 mg/100g). The most
mg/100g), in absorbed ions (0.09 mg/100g), and fixed in colloids (0.18 mg/100g).
Minimum or very little amounts of some nutrients were recorded in gravel. This soil was entirely different in phosphates and nitrates, while minimum amount of potassium (0.08 mg/100g), sodium (2.59 mg/100g), ammonium (0.36 mg/100g), chlorides (5.56 mg/100g), phosphorus penteoxide (3.65 mg/100g) and K2O (2.11
mg/100g) were recorded.
Maximum chloride ions (8.91 mg/100g) and minimum calcium (21.25 mg/100g) ions were recorded in sandy soils. Phosphate content was absent in soil solution and absorbed ions fraction, while nitrate content could not be detected in sandy soils.
Sand mixed with gravel showed maximum amount of sodium (3.63 mg/100g), magnesium (4.80 mg/100g) and ammonium (1.51 mg/100g). Relatively higher amounts of calcium (27.06 mg/100g), P2O5 (3.72 mg/100g) and K2O (4.05
mg/100g) were recorded. Minimum amount of
sulphates (0.22 mg/100g) was also recorded while phosphates and nitrates were entirely absent in sand mixed with gravel.
ANALYSIS OF PLANT MATERIALS
Dry material of above ground plant parts, grown in different soil types were analysed for material nutrient constitutions. Analysis could not be possible in plants grown in gravel. Maximum potassium (17.87 mg/g), magnesium (7.91 mg/g) and chlorides (4.71 mg/g) were obtained in plants grown in red soils. Maximum levels of sodium (2.51 mg/g), calcium (21.50 mg/g), phosphates (9.26 mg/g) and phosphorus (3.02 mg/g) were recorded in plants grown in sand.
Minimum sodium (0.79 mg/g) and calcium (18.53 mg/g) were recorded in plants grown in red soil. The lowest amount of potassium (13.67 mg/g), magnesium (4.55 mg/g), chlorides (3.22 mg/g), phosphates (7.96 mg/g) and phosphorus (2.59 mg/g) were reported in sand mixed with gravel.
REFERENCES
1. Anonymous, 1970. 20 years of agricultural research in Rajasthan: agricultural chemistry. Department of Agriculture, Rajasthan, Jaipur, pp. 141.
2. Anonymous, 1979. Biochemiches Praktikum Des Institus fur Pflanzenernahrung Der Justus Liebig Universitat, Giessen, F.R. Sermany. 3. Calvin, M. 1976. Photosynthesis as a resource
for energy and materials. Photochem. Photobiol. 23 : 425-444.
4. Calvin, M. 1977. Hydrocarbons via photosynthesis. Energy Res. 1 : 299-327. 5. Calvin, M. 1978a. Green factories. Chem. Eng.
News. 50 : 30-36.
6. Calvin, M. 1979a. Petroleum plantations for fuel and materials. Bioscience. 29 : 533-537. 7. Calvin, M. 1979b. Peteroleum plantations. In
Solar Energy : Chemical conversion and storage (Ed.) R.R. Hautalona, A.B. King and C. Kutal. Human Press, Clifton, N.J.
8. Calvin, M. 1980. Hydrocarbons from plants : analytical methods and observations. Die Naturwissen. 67 : 525-533.
9. Calvin, M. 1983a. New sources for fuel and materials. Science. 219 : 24-26.
10. Calvin, M. 1983b. Oil from plants. Photochem. Photobiol. 37 : 349-360.
11. Calvin, M. 1984. Revewable fuels for the future. J. Appl. Biochem. 6 : 3-18.
12. Calvin, M. 1985. Fuel oils from higher plants. Ann. Proc. Phytochem. Soc. Eur. 26 : 147-160. 13. Clavin, M., E.K. Nemethy, K. Redenbaugh and
J.W. Otvos, 1981. Plants can be direct source of fuel. Petroculture. 2 : 26.
14. Clavin, M., E.K. Nemethy, K. Redenbaugh and J.W. Otvos, 1982. Plants as a direct source of fuel. Experientia. 38 : 18.
16. Digar, S. and N.K. Barde, 1982. Morphology, genesis and classification of red and laterite soils. Proc. 12th International Congress of Soil Science : Review of soil research in India. II : pp. 498-507.
17. Garg, J. and A. Kumar, 2011a. Hydrocarbons from plants as renewable source of energy. Bioherald, Int. J. of Biodiversity & Environment 1 :(1)pp31-35.
18. Garg, J. and A. Kumar, 2011b. Laticiferous plants: renewable sources of energy. Int. J. of Current Research. 3. Pp56-59.
19. Khoshoo, T.N. 1982. Energy from plants : Problems and prospects, Proc. 69th Ind. Sci. Congr. II, 1.
20. Khoshoo, T.N. 1984. Bio-energy : Scope and limitations. In Proc. Bio-Energy Soc. Ist
Convention and symposium, '84. (Ed.) R.M. Sharma, O.P. Vimal and P.D. Tyagi, Bioenergy Society of India, New Delhi pp. 4-11.
21. Mengel, K. and E.A. Kirkby. 1978. Principles of plant nutrition. International Potash Institute. Worblaufen-Bern/Switzerland. pp. 593.
22. Mizuno, S. 1960. Physiological studies on the fructification of pea-nut (Japanese). Proc. Crop. Sci. Soc. Japan, 29 : 164-171.
23. Raychaudhuri, S.P. 1978. Soils of India with special Reference to Arid-zone. In : Proc. Arid zone Research in India. Cazri. pp. 109-116. 24. Singh, N.T. and V.S. Tomer. 1982. Soil-water