Available Online At www.ijpret.com
INTERNATIONAL JOURNAL OF PURE AND
APPLIED RESEARCH IN ENGINEERING AND
TECHNOLOGY
A PATH FOR HORIZING YOUR INNOVATIVE WORK
ANALYSIS OF SELECTION OF PARAMETERS FOR OPTIMUM THD MEASUREMENT
USING DFT
NIKITA ANIL PRABHU, Dr. H. G. VIRANI, VIJAY MAGDUM
1. Dept. of ETC, Goa College of Engineering, Farmagudi, Goa. 2. Siemens Ltd., Verna Industrial Estate, Verna, Goa.
Accepted Date:
27/02/2013
Publish Date:
01/04/2013
Keywords
Discrete Fourier
Transform,
Total Harmonics
Distortion
Corresponding Author
Ms. Nikita Anil Prabhu
Abstract
This paper focuses on analysis of the parameters which affect
the Discrete Fourier Transform computation and accuracy. The
behaviour of the DFT computation was closely analysed to
estimate the error percentage. Also the condition for optimum
Total Harmonic Distortion measurement is derived. The results
obtained hold true for most methods of DFT computation like
Available Online At www.ijpret.com
I. INTRODUCTION
Accurate measurement of THD is crucial
for power quality monitoring devices. The
THD measurement is done using principles
of Fourier transforms. This paper provides
designers with guidance for selecting the
right parameters in order to perform
accurate THD measurements using DFT.
Centralized power systems are now being
replaced by distributed generation
networks with integration of renewable
energy systems into the grid, which make
handling variable and large load
requirement possible. Most of the
integration of renewable power systems
to the grid takes place with the aid of
power electronics converters. The main
purpose of power electronics converters is
to integrate the distributed generation to
the grid in compliance with power quality
standards. However, higher frequency
switching of inverters can inject additional
harmonics to systems, creating major
power quality problems. Therefore it is
necessary to monitor the total harmonic
distortion at these generation sources to
control the connectivity to grid based on
THD levels [1]. To accurately estimate the harmonic content it is necessary to
implement Discrete Fourier Transform
based DSP method in either hardware or
software. The accuracy factor largely
depends on the parameters of the
Discrete Fourier Transform .Thus, it is
important to analyze the parameters and
their behaviour under various conditions
before selecting the configuration of the
DFT.
II. CONCEPTS
A. Total Harmonic distortion (THD)
1) Harmonics: in terms of voltage or
current are the signals with frequency
which is an integral multiple of the
fundamental frequency. E.g. in India the
fundamental frequency in power system is
50Hz. Therefore, harmonics would be
100Hz, 150Hz and 200Hz etc. The
harmonic number (h) usually specifies a
harmonic component, which is a ratio of
its frequency to the fundamental
frequency
2) Total Harmonic Distortion: THD applies
to both current and voltage and is defined
as the root mean square (rms) value of
harmonics divided by the rms value of the
fundamental, and then multiplied by
100% as shown in the following equation:
Available Online At www.ijpret.com In the above equation, Mh is the
amplitude of harmonics with h, being the
harmonics number.M1 is the amplitude of fundamental frequency component.
B. Fourier Transforms
The Fourier analysis permits a periodic
distorted waveform to be decomposed
into an infinite series containing DC
component, fundamental component
(50/60 Hz for power systems) and its
integer multiples called the harmonic
components.
= 2 + [ cos "#$
∞
%
+ & sin "#$ ]
In the equation above, * = + is the DC
component. The term an, bn correspond to
magnitude of the in phase and quadrature
phase components at frequency (nwo),
where wo is the fundamental frequency in
radians given by # = ,
- where T is the
time period of the signal. Magnitude at a
frequency which is the nth harmonic is
determined by the formula * =
. + &
C. Discrete Fourier Transform (DFT)
A DFT transforms a discrete number of
samples in time domain into a frequency
spectrum. Using the DFT implies that the
finite number of samples being analyzed
are taken over one period of an infinitely
extended periodic signal [2].
The equation for the Discrete Fourier
Transform is: F n =
x k e345π867 93
:%
Where (1) N is the number of input
samples given for DFT calculation. (2) k is
the index for sample in time domain. (3) n
is the index for sample in frequency
domain. (4) x(k) is the kth samples of the input signal x.(5) F(n) is the nth output sample derived from the DFT calculation
in frequency domain.
1) Points for DFT parameter calculation:
a) N point DFT will take in N input
samples in time domain and produce
and a frequency domain output of N
frequencies
b) Each input sample is multiplied by sine
and cos waves of frequency (2πkn/N)
c) The exponential is expressed as
;9= < =>5?@A
8 and is called the twiddle
factor.
d) Euler’s formula expresses exponential
Available Online At www.ijpret.com
given by
equation:e3B5?@A8 = cos ,:
9 +
C sin ,:9
e) The output is complex in nature
producing magnitude and phase
information
f) The bin size = (fs/N), the bin size will
specify intervals at which the
frequencies will be calculated. Here fs,
is the sampling frequency.
g) Sampling rate =
(samples/cycle)*(fundamental
frequency)
h) Example: Consider power system,
fundamental frequency of signal (f)
=50Hz. If signal is sampled at rate 8
samples/cycle, The sampling rate (fs)=
(samples/cycle)*(f)=400 samples/sec.
Calculation 16 point DFT on the signal,
bin size
=(fs/N)=(400/16)=25HzTherefore, the
output will be a range of frequencies
[0 25 50 ………375] Hz
2) Properties of DFT
a) Periodicity: The twiddle factor W as
per Euler’s formula is a complex value
composed of sine and cos wave. The
sine and cos are periodic with period
2π.Thus the DFT also is periodic with
period (fs).
b) Symmetry: The twiddle factor W as per
Euler’s formula is a complex value
composed of sine and cos wave. The
sine and cos are symmetric at angle
2π/2.Thus the DFT also is symmetric at
point (fs/2).
c) Interpretation: Thus the data after
range [0 to (fs/2)] at the output is
redundant.
III. ERROR ANALYSIS
A. Test setup
Making use of the DFT formula mentioned
above a mathematical simulation of the
DFT was done Excel with the help of
macros. The parameters of concern were
the Sampling rate (S) and the number of
input samples (N). For every combination
of Sampling rate (S) and number of input
samples (N), the total harmonic distortion
(THD) was calculated. The ideal values of
amplitude at various frequencies and THD
of the test signals were compared with
the resultant values obtained by DFT, to
determine error percentage.
There were three different test input
Available Online At www.ijpret.com
• Sine wave of frequency 50Hz and unit
amplitude.
• Sine wave of 50Hz containing
harmonics of frequencies up to half
sampling frequency(fs/2)
• Sine wave of 50Hz containing
harmonics of frequencies even above
(fs/2).
Amplitude error: is the percentage of
deviation of the obtained amplitude from
the actual amplitude.
THD measurement error: is the
percentage of deviation of the obtained
value from the actual THD value present
in the signal.
B. Observation, Results and Analysis
1) Amplitude Error Analysis
The results of the simulation for
various values of N and S, have been
mapped in a tabular form. Each cell of the
table contains the amount of amplitude
error for each corresponding value of N
and S.
Case 1:
Table 1 contains the values of
fundamental amplitude error for sine
wave of 50Hz and unit amplitude
.Amplitude error for the fundamental is
independent of N, and it increases as
sampling rate increases.
When N < S, the bin size is greater than
fundamental frequency and hence this
frequency does not correspond to any
point at the output. The DFT output being
discrete the intermediate point values
cannot be determined. The number of
input samples to DFT has to be integral
multiples of samples/cycle, which means
that DFT can be calculated accurately only
when input samples contain at least one
cycle of the signal.
Table 1
Table
Head N
8 16 32 64
S
8
0.0317 0.0317 0.0317 0.0317
16
- 0.0382 0.0382 0.0383
32
- - 0.0397 0.0398
64
- - - 0.0401
Case 2
Table 2 contains the values of
fundamental amplitude error for sine
Available Online At www.ijpret.com frequency half the sampling rate. Table 3
shows the amplitude error in
measurement of harmonics. It can be
observed that the fundamental amplitude
and the harmonic amplitude error are
independent of N. As S increases the
amount of error in fundamental
amplitude increases but not significantly
while the amount of error in harmonic
frequency amplitudes reduces. Higher the
harmonic number more is the amount of
error in its amplitude measured as
compared to lower harmonic.
Table 2
Table
Head N
8 16 32 64
S
8
0.0036 0.0033 0.0033 0.0037
16
- 0.0160 0.0164 0.0172
32
- - 0.0301 0.0304
64
- - - 0.0379
Table 3
Frequency S
8 16 32
100 0.205 0.0825 0.0011
150 0.5217 0.1734 0.0456
200 - 0.3056 0.0913
250 - 0.5107 0.1514
Case 3
Table 4 contains the fundamental
amplitude error for the signal of
fundamental 50Hz but containing
harmonics even higher that half sampling
frequency. Table 5 shows the amplitude
error for harmonics measurement. The
amplitude error in this case is much higher
than the other two signals considered
before. As we increase the sampling rate
the fundamental amplitude error
significantly reduces unlike the previous
two cases where fundamental amplitude
error had increased. It is also observed
that the number of harmonics amplitudes
that can be reliably calculated also
increase as sampling rate increases.
Table 4
Table
Head N
8 16 32 64
S
8
7.9598 7.9560 7.9368 7.8386
16
- 3.9688 3.9664 3.9550
32
- - 0.0288 0.0292
64
Available Online At www.ijpret.com
Table 5
Frequency N
8 16 32
100 3.85 0.0845 0.0825
150 - 0.1767 0.1734
200 8.0581 0.3125 0.3056
250 - 0.5179 0.5107
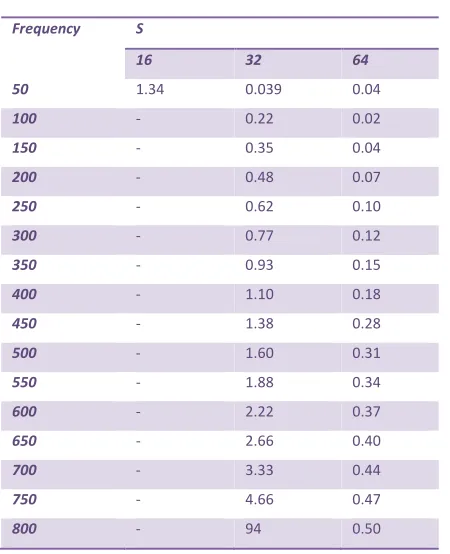
Reliability Study of DFT
Table 6 is a based on the reliability study
of DFT. A sample signal is taken consisting
of frequencies up to 800Hz and the total
harmonic distortion of signal being 5%.
The signal was sampled at different rates
like 16, 32, 64 samples/cycle and one
cycle of sample inputs were given to the
DFT calculation module.
Table 6
Frequency S
16 32 64
50 1.34 0.039 0.04
100 - 0.22 0.02
150 - 0.35 0.04
200 - 0.48 0.07
250 - 0.62 0.10
300 - 0.77 0.12
350 - 0.93 0.15
400 - 1.10 0.18
450 - 1.38 0.28
500 - 1.60 0.31
550 - 1.88 0.34
600 - 2.22 0.37
650 - 2.66 0.40
700 - 3.33 0.44
750 - 4.66 0.47
800 - 94 0.50
Nyquist criteria states the detectable
signals will be those having frequency in a
range below half the sampling frequency.
But it is observed that the reliable
amplitude detections of error percentages
less than 1 % occur at even fewer
frequencies.
As in case of S=32, sampling frequency
(fs)= 32*50=1600. As, per Nyquist,
maximum detectable frequency is 800Hz
but in practice the error rate increases for
higher frequencies and actual number of
frequencies reliably detected are within
fs/4.
Total Harmonics Distortion Measurement
Error Analysis
After analysing the amplitude
measurement error for both fundamental
and harmonics, a further analysis was
done based on the error in measuring THD
for the three sample signals for the above
cases. The total harmonic distortion is
measure for the sample test signals and
the value is compared with those
obtained from the DFT output. The error
percentages have been observed for
various conditions.
Available Online At www.ijpret.com Table 7 contains the THD measurement
error values for a sine wave of 50 Hz. It is
seen that for as S increases the THD
measurement error reduces, but THD
error is independent of N. The error is
significantly high for the condition N<S
where the input samples to the DFT are
not even one cycle of the signal.
Table 7
Table
Head N
8 16 32 64
S
8
0.0897 0.1200 0.1644 0.2271
16
36.56 0.0592 0.0812 0.1121
32
41.870 34.758 0.0405 0.0559
64
45.959 37.656 34.323 0.0279
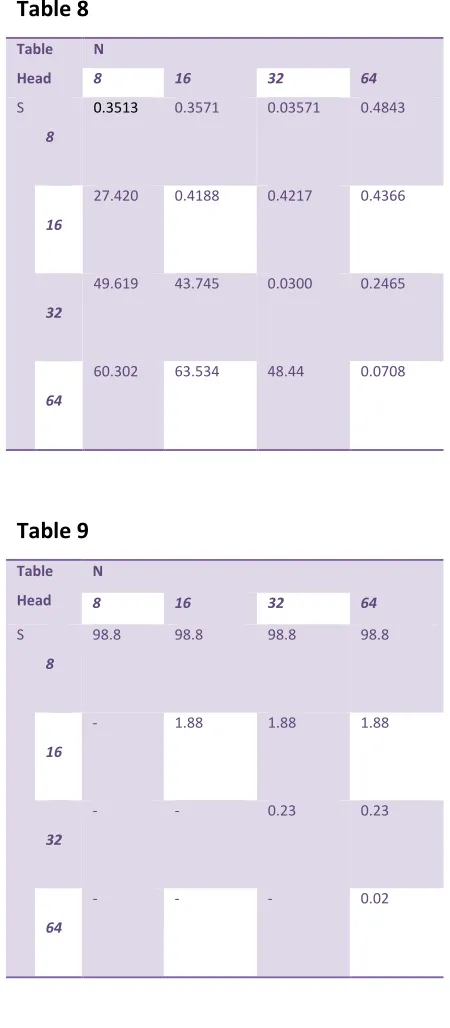
Case 2
Table 8 corresponds to the signal whose
frequencies above the Nyquist frequency
(fs/2) have been filtered. From the THD
measurement analysis on this signal it is
seen that condition N>= S is satisfied, the
value of N does not affect the THD error,
only the increase in S reduces the error in
THD measurement.
Case 3
Table 9 is for a signal having THD 5% and
having frequencies up to 800 Hz. It is
observed that as the sampling rate
increases the THD measurement error has
reduced by a great amount.
Table 8
Table
Head N
8 16 32 64
S
8
0.3513 0.3571 0.03571 0.4843
16
27.420 0.4188 0.4217 0.4366
32
49.619 43.745 0.0300 0.2465
64
60.302 63.534 48.44 0.0708
Table 9
Table
Head N
8 16 32 64
S
8
98.8 98.8 98.8 98.8
16
- 1.88 1.88 1.88
32
- - 0.23 0.23
64
Available Online At www.ijpret.com
IV. CONCLUSION
When using DFT the first dilemma is to
select the right parameters. From the over
values calculated using the DFT code
certain limitations are highlighted.
A. DFT parametric facts
From the above analysis we can conclude
certain points which can prove to be guide
lines for selecting sampling rate as well as
the number of point FFT to be calculated.
1. Number of input samples to the DFT
has to be greater than or equal to the
samples/cycle.
2. The DFT calculate values of amplitude
for frequencies which are (N-1)
multiples of bin size only, and no
intermediate points estimated.
3. The amplitude error is independent of
the number of point DFT that is
calculated and depends only on
sampling rate.
4. The error in amplitude estimation for
higher harmonics is larger.
5. For higher sampling rate, higher is the
accuracy of harmonic amplitude
detection and the THD measurement
but the fundamental amplitude
accuracy reduces slightly.
6. Reliable DFT amplitude measurement
can be done for frequencies up to the
one fourth of the sampling frequency.
7. Error analysis is fundamental
frequency independent and can be
used as guide lines for all cases.
B. Choosing the N and S combination
for optimum THD measurement
1. Select the maximum frequency to be
detected.
2. Let the sampling rate at least be 4
time the amplitude measurement
3. Convert the sampling rate in terms of
samples per cycle and choose the
sampling rate which give
samples/cycle value as power of 2.
4. Number of input points to DFT should
choose equal to the number of
samples per cycle.This the most
accurate combination for THD
appication where we are intersted in
frequencies as integer multiples of
fundamental.
5. The maximum sampling rate is limited
but the hardware and time
constraints.
6. For higher sampling rate we need
higher point DFT to be calculated. This
may increase computation time and
Available Online At www.ijpret.com
ACKNOWLEDGMENT
I would like to thank my internal guide Dr.
H.G Virani for allowing me to carry out the
research under his guidance. This paper
has largely been possible due to the
focussed guidance given by Sir Vijay
Magdum. I would like to thank him for
solving my queries and giving me a
direction of flow for the research, in spite
of his busy work schedule. I would also
thank our principal Dr. R. B. Lohani for
encouraging research work.
REFERENCES
1. G S. K. Khadem, M. Basu, and C. M. F.,
Power quality in grid connected
renewable energy systems: Role of
custom power devices," in International
Conference on Renewable Energies and
Power Quality (ICREPQ'10), (Granada
(Spain)), 2010.
2. Ali Saidi, GENERALIZED FFT
ALGORITHM, Motorola Applied Research,
Paging and Wireless Data Group
3. Emmanuel If eachor, Digital Signal