Volume 3, Issue 3, March 2014
Page 22
Keywords: Epoxy, Electrical conductivity, Nanocomposites, MWCNTs1. Introduction
Since the carbon nanotubes (CNTs) were discovered by Iijima [1] in 1991, they have attracted considerable attentions due to their unique structural, electrical, and mechanical properties [2] , [3],[4].
Carbon nanotubes (CNTs), one graphene layer (SWNT) or many graphene layers wrapped onto themselves (MWNT) are a novel crystalline carbon form. The recent theoretical and experimental investigations indicate that they have properties suitable for applications in many fields. Their interesting high electrical conductivity have been the subject of many research works [5] , [6] , [7].
In order to achieve optimal enhancement in the properties of CNT/polymer composites, two key issues should be considered: homogeneous dispersion of CNTs in the polymer resin and strong interfacial bonding between the CNTs and the polymer matrix [8]. Several researchers have prepared epoxy resin/CNT composites to obtain outstanding electrical properties. A. Allaoui et al [9]fabricated epoxy resin/CNT composites , they mixed 0.5 , 1 and 4 % wt. of MWCNTs with epoxy resin their results indicate an improvement for electrical conductivity . Jianfei Chang et al . [10] were developed multiwalled carbon nanotube (MWCNT)/epoxy (EP) composites using microwave curing (m-MWCNT/EP). They have a very high dielectric constant and low dielectric loss.
In this study, our goal is focused on how to increase the content and the homogeneous dispersion of MWCNTs without a solvent in the matrix.
2. Materials and experimental methods
2.1 Materials
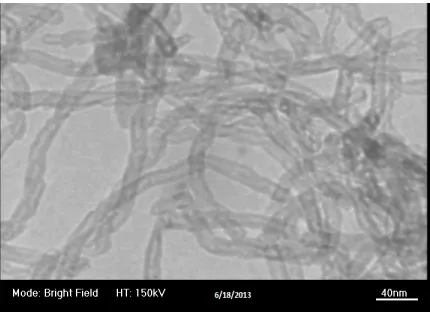
The multiwalled carbon nanotubes (MWCNTs), used in this study synthesized by thermal chemical vapor deposition (CVD) procees, were supplied by Intelligent Materials Pvt. Ltd. , these have a diameter of 20–30 nm and a length of 10– 30 micrometers as shown in figure (1) which represented a Scanning Electron Microscope(SEM) and (2) which represented Transmission Electron Microscope(TEM) . Epoxy as a matrix (Nitofill, EPLV with Nitofill EPLV hardener from Fosroc Company). The mixing ratio for resin and hardener is 3:1 and gelling time 40 minute at 35 oC, mixed viscosity 1.0 Poise at 35 oC , the structure of epoxy is shown in figure (3).
Fig. (1) SEM image for MWCNTs
Volume 3, Issue 3, March 2014
Page 23
Fig.(2) TEM for MWCNTs.The chemical structure of epoxy resin is :
Fig.3. Epoxy structure [11]
2.2. Preparation of EP/MWCNTs Composites
The shape samples prepared for dielectrical test suitable to the designation of ASTM (D150) as in figure (4).
Fig. (4). Epoxy and epoxy/MWCNTs composites specimen shape for dielectrical test where; (R) is the diameter of the sample, (d ) is specimen thickness.
The preparation steps of the neat epoxy and epoxy /MWCNTs composites for dielectrical tests were prepared by hand lay up technique by mixing process which consists of three steps.
2-2.1 Neat epoxy preparation
Firstly epoxy resin and hardener are weighted for suitable mixing ratio, and then manually mixing then epoxy resin and hardener by magnetic stirror at 600 rpm for 30 minutes to have good homogeneity between epoxy resin and hardener. Secondly, for better homogeneity homogenizer device were used for 4 minutes. The third step as shown in figure (5) vacuum system was using to remove the bubble before molding the epoxy in the mold as shown in figure (6).
Volume 3, Issue 3, March 2014
Page 24
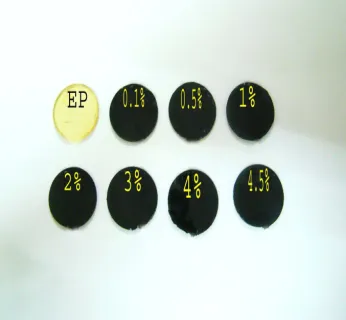
2-2.2 Epoxy nanocomposites preparationThe epoxy nanocomposites were prepared with MWCNT with weight percentage 0.1,0.5,1,2,3,4 and 4.5 .Epoxy /MWCNTs compositeswere prepared in three steps; firstly, the nanotubes are weighted and manually mixed with epoxy resin under gloves box in nitrogen atmosphere as shown in figure (7).
Fig. (7) Gloves box (handmade by researcher)
Interaction with water vapor specially increase particles agglomeration and decrease any interaction (chemical or physical) of particles with polymer chain in the matrix. Nanotubes with epoxy resin were mixed by magnetic stirror at 600 rpm for 30 minutes to have good distribution and less agglomeration. The second step involves that usage of homogenizer device for 4 minutes to get good dispersion. The hardener was mixed with epoxy resin / MWCNT for 4 minutes by the homogenizer device. Using the homegenizer may cause to increase viscosity and increase epoxy resin temperature then sample container should be put in a cold water container to avoid high temperature which decrease time of gelling making the composite hard to mold.The third step was using vacuum system (10-2 bar) to remove the bubble before molding . The samples which explained in figure (8) were left for 72 hours before pulling out from molds and left in the vacuum chamber as shown in figure (9) for 10 days before any test to get better curing conditions.
Volume 3, Issue 3, March 2014
Page 25
Fig.(9) Vacuum chamber2.3. Scanning Electron Microscope (SEM) Images of EP/MWCNTs Nanocomposites Topography of Fractured Surface
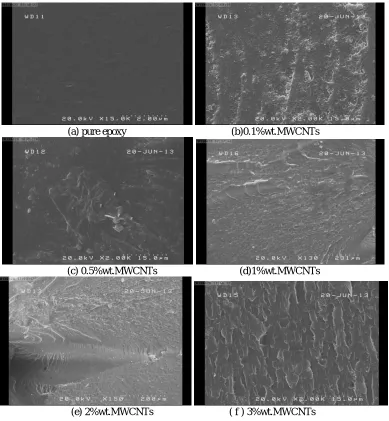
Figure 10 shows the SEM micrographs taken from the fracture surfaces of the epoxy and epoxy/MWCNTcomposites. The smooth fracture surface of the neat epoxy is a typical feature of brittle fracture behaviour. As the filler content increases the surface roughness increases, suggesting that the crack propagation in the nanocomposite is opposed by rigid and stiff fillers. In other words, since the segments of primary crack front had to move quickly between the fillers, more energy is needed for such local deviations. In fact it leads to higher fracture toughness.As indicate in the figures 10 a,10b,10c,10d,10e,10f,10g,and10 h.
(a) pure epoxy (b)0.1%wt.MWCNTs
(c) 0.5%wt.MWCNTs
(d)1%wt.MWCNTs
Volume 3, Issue 3, March 2014
Page 26
Fig.10. SEM images of EP and EP/MWCNTs composites with different weight percentages (0.1,0.5,1,2,3,4and 4.5)3.
Results and Discussion
3.1 Relative Permittivity (Real Part) of Epoxy and Epoxy / MWCNTs
Figure 11 is shown the variations of permittivity with respect to frequency for epoxy and epoxy / MWCNTs composites for the concentrations 0.1 , 0.5 , 1 , 2 , 3 , 4 and 4.5 wt. % of MWCNTs. The measurement temperature is kept constant , hence , its influence on the permittivity behavior can be neglected . It can be seen from figure 4-5 that the permittivity of epoxy and and epoxy/MWCNTs composites increase with decreasing frequency .
The measurement temperature is kept constant , hence , its influence on the permittivity behavior can be neglected . It can be seen from figure 9 that the permittivity of epoxy and and epoxy/MWCNTs composites increase with decreasing frequency . The epoxy component of permittivity is governed by the number of orientable dipoles present in the system and their ability to orient under un applied electric field .At lower frequencies of applied voltage , all the free dipolar functional groups in the epoxy chain can orient themselves resulting in ahigher permittivity value at these frequencies . As the electric field frequency increases , the bigger dipolar groups find it difficult to orient the same speed as the alternating field , so the contributions of these dipolar groups to the permittivity goes on reducing resulting in a continuously decreasing permittivity of the epoxy system at higher frequencies .Similarly , the inherent permittivities in MWCNTs also decrease with increasing frequencies of the applied field . This combined decreasing effect of the permittivity for both epoxy and MWCNTs result in a decrease in the permittivity of nanocomposites also when the frequency of the applied field increase. There are several parameters could be affect the dielectrical properties of epoxy nanocomposites such as applied field frequency and the concentration of nanotubes.
Fig.11. Real permativity Vs frequency for EP and EP/MWCNTs with different weight percentages (0.1,0.5,1,2,3,4and 4,5)
3.2 Tan Delta of EP/MWCNTs composites
Volume 3, Issue 3, March 2014
Page 27
0 0.002 0.004 0.006 0.008 0.01 0.012
0 200000 400000 600000 800000 1000000 1200000
T
a
n
d
e
lt
a
Frequency (Hz)
EP/0.1 MWCNTs
0 0.002 0.004 0.006 0.008 0.01 0.012
0 200000 400000 600000 800000 1000000 1200000
T
a
n
d
e
lt
a
Frequency (Hz)
EP/0.5 MWCNTs
0 0.002 0.004 0.006 0.008 0.01 0.012 0.014
0 200000 400000 600000 800000 1000000 1200000
T
a
n
d
e
lt
a
Frequency (Hz)
Volume 3, Issue 3, March 2014
Page 28
0.003 0.0035 0.004 0.0045 0.005 0.0055 0.006 0.0065
0 200000 400000 600000 800000 1000000 1200000
T
a
n
d
e
lt
a
Frequency (Hz)
EP/4%MWCNTs
0 0.002 0.004 0.006 0.008 0.01 0.012
0 200,000 400,000 600,000 800,000 1,000,000 1,200,000
T
a
n
d
e
lt
a
Frequency (Hz)
4.5%MWCNTs
0 0.002 0.004 0.006 0.008 0.01 0.012 0.014
0 200000 400000 600000 800000 1000000 1200000
Ta
n
d
e
lt
a
Frequency (Hz)
EP/1% MWCNTs
Volume 3, Issue 3, March 2014
Page 29
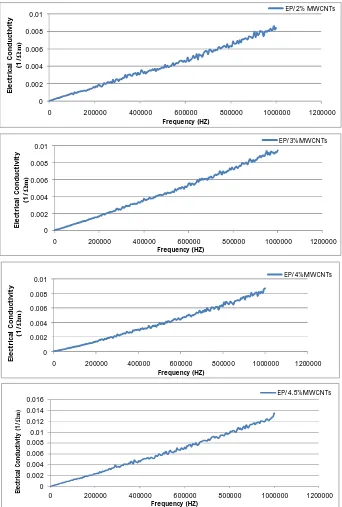
nantubes .Increasing the weight percentage of MWCNTs enhance electrical conductivity as shown in figure (13), and hence, tan delta. 0.00E+00 5.00E-06 1.00E-05 1.50E-05 2.00E-05 2.50E-05 3.00E-05 3.50E-05
0 200000 400000 600000 800000 1000000
E le c tr ic a l c o n d u c ti v it y ( 1 /Ω m ) Frequency (Hz) EP 0 0.002 0.004 0.006 0.008
0 200000 400000 600000 800000 1000000 1200000
El e ct ri c al c o nd u ct iv it y (1 / Ω m ) Frequency (HZ) EP/0.1%MWC… 0 0.001 0.002 0.003 0.004 0.005 0.006 0.007
0 200000 400000 600000 800000 1000000 1200000
E le ct ri ca l C o n d u ct iv it y ( 1 / Ω m ) Frequency (HZ) EP/0.5%MWCNTs 0 0.001 0.002 0.003 0.004 0.005 0.006 0.007 0.008
0 200000 400000 600000 800000 1000000 1200000
Volume 3, Issue 3, March 2014
Page 30
0 0.002 0.004 0.006 0.008 0.010 200000 400000 600000 800000 1000000 1200000
E le ct ri ca l Co n d u ct iv it y (1 / Ω m ) Frequency (HZ) EP/3%MWCNTs 0 0.002 0.004 0.006 0.008 0.01
0 200000 400000 600000 800000 1000000 1200000
E le ct ri ca l C o n d u ct iv it y (1 / Ω m ) Frequency (HZ) EP/4%MWCNTs 0 0.002 0.004 0.006 0.008 0.01 0.012 0.014 0.016
0 200000 400000 600000 800000 1000000 1200000
El ec tr ic al C on du ct iv it y (1 / Ω m )
Frequency (HZ)
EP/4.5%MWCNTs
Fig. (13) Electrical conductivity versus frequency for epoxy and EP/MWCNTs composites with 0.1 , 0.5 ,1, 2, 3, 4and 4.5 weight percentage of MWCNTs
Conclusion
This study has demonstrated the intrinsic potential of the CNT. Small quantity addition can modify considerably the electrical behavior of an insulator polymer matrix. The exceptional electrical properties of MWNT have been used to improve the performance of an insulator epoxy matrix nanocomposites. The addition of CNT into the epoxy matrix has a remarkable effect on the electrical properties. According to our results from the electrical conductivity epoxy considered an insulators but the addition of MWCNTs transformed the nanocomposites to semiconductors.
References
[1] S. Iijima, Nature 354 (1991) 56–58.
[2] M.M.J. Treacy, T.W. Ebbesen, J.M. Gibson, Nature 381 (1996) 678–680.
[3] B.I. Yakobson, C.J. Brabec, J. Bernholc, Phys. Rev. Lett. 76 (1996) 2511–2514.