Full Terms & Conditions of access and use can be found at
http://www.tandfonline.com/action/journalInformation?journalCode=cwse20
International Journal of Research & Method in Education
ISSN: 1743-727X (Print) 1743-7288 (Online) Journal homepage: http://www.tandfonline.com/loi/cwse20
Problem topology: using cartography to explore
problem solving in student-led group projects
Roy Hanney
To cite this article: Roy Hanney (2018): Problem topology: using cartography to explore problem solving in student-led group projects, International Journal of Research & Method in Education, DOI: 10.1080/1743727X.2017.1421165
To link to this article: https://doi.org/10.1080/1743727X.2017.1421165
Published online: 05 Jan 2018.
Submit your article to this journal
Article views: 25
View related articles
Problem topology: using cartography to explore problem solving
in student-led group projects
Roy Hanney
School of Media Arts & Technology, Southampton Solent University, Southampton, UK
ABSTRACT
This article originated from personal reflection on the nature of projects and the use of project-based learning in media practice education. Accepting that problems are the motor for projects, it asks questions about how students conceptualize problems and seeks to understand the strategies they employ to manage problem encounters. Problem solving is integral to media practice, is a key employability skill, and has a direct relationship with creativity in its myriad forms. The difficulty for educators is that student problem-solving is largely hidden from view. Students are not necessarily observed throughout all of their project work, while tutorials are only partial encounters with their work processes. With this in mind, the author set out to design a research methodology which would uncover the hidden process of problem
solving; one that would ‘make the invisible, visible’ and explore
students’ problem-solving strategies at a conceptual level. Adopting a
visual research methodology (VRM), the researcher experimented with mapmaking as a means of representing problems students had encountered through the employment of cartographic metaphors. The article takes the opportunity to present interim findings that have emerged from the adoption of this cartographic VRM and aims to evaluate the effectiveness of the research design.
ARTICLE HISTORY
Received 26 June 2017 Accepted 26 October 2017
KEYWORDS
Project-based; learning; visual; research; cartography; problem solving; functional; fixedness
Introduction
This article originated from personal reflection on the use of project-based learning in media practice education. As an educator turned researcher, I have tried to explore questions that have arisen from my own personal observations of the ways in which students engage with the practice of projects. In particular, this article aims to investigate an issue I often feel that students have difficulty with, that of problem solving when undertaking projects for coursework. I wanted to better understand the way in which students conceptualize problems and how they approach problem solving. Problem solving is integral to project work. It is a key employability skill and has a direct relationship with the practice of creativity in its myriad forms.
The difficulty for anyone wishing to understand the practice of problem solving, as it occurs in student group-based projects, is two-fold. Firstly, students’problem solving is largely hidden from view as they are not necessarily observed throughout all of their project work, while tutorials are only partial encounters with the student’s work processes. The second difficulty is related to the nature of observation itself and the way in which it can impact on the observed subject. To be observed may cause a shift in behaviour, but to be observed by a tutor is even more likely to result in a ‘front stage’ performance presented for the benefit of the observer (Goffman 1990),
© 2018 Informa UK Limited, trading as Taylor & Francis Group
CONTACT Roy Hanney [email protected] School of Media Arts & Technology, Southampton Solent University, East Park Terrace, Southampton SO14 0YN
whereas what is sought is access to the‘back stage’(Goffman1990) performance. When unobserved and unseen, the participants might relax, step out of character, move off script and engage in a more instinctive performance.
With these difficulties in mind, I set out to design a research methodology that would reveal the hidden processes at play when students undertake group-based project work–one that would make visible the forms of collaboration, approaches and strategies employed by students that are, in the most part, largely unseen by the ever-watchful eye of their tutors. In order to articulate this invisible domain of the lived experience of doing projects, I set out to investigate the possibilities offered by visual research methods(VRM). It seemed as though such an approach might function as a means for ‘making the invisible visible’(Rose2014, 27). Eventually, this led to plans for a series of map-making workshops that aimed to explore the ways in which student groups engage with problem solving at a conceptual level.
Adopting cartography as a visual research methodology
The inspiration for the use of cartography as a tool for gathering data was triggered though watching the documentaryThe Five Obstructions (2003), in which director Lars Von Trier sets a challenge for his friend and mentor Jørgen Leth, also a filmmaker. He challenges Leth with the task of remaking his own filmThe Perfect Human (1967), five times. On each occasion, Von Trier sets out to stop Leth from making the film by setting obstructions that aim to frustrate Leth and force a degree of intro-spection and self-awareness on the filmmaker. This use of obstructions (or problems) to stimulate creativity contrasts with the observed behaviour of students whose first instinct is often to avoid, rather than solve, emergent problems (obstacles). It was the frequency of this problem-avoidance strategy among undergraduates, coupled with the inspiration that came from watching The Five Obstructions (2003) that led to the metaphorisation of an obstruction/problem as a topological encounter which might in some way be mapped. Problems are imagined as physical obstructions which require creative solutions (a hill might need a tunnel, a river a bridge) or which might cause undesirable deviations from the original project plan. For example, when embarking on a project, stu-dents might encounter a problem (or obstruction) such as access to a location and, rather than see that as a problem that needed to be solved, would change the direction of their project (even at times starting a completely new project). In this way, the problem encounter can be formulated as an obstruction which causes them to deviate from their initial goals–rather than drill down into the problem and seek a solution, thereby adapting their initial plan. In some cases, this results in a final project output whose shape, form and content has been determined largely by the deviations structured by unsolved problems rather than through any creative problem-solving.
different type of thinking (Gauntlett and Fatimah2012, 600–601). There is also a familiarity with the idea of a map and it is highly likely that most participants would be conversant with the‘ communi-cative competencies’required to engage in map-making (Rose2014, 31).
Nonetheless, there is a need to understand how we conceptualize maps since the particular rep-resentational system deployed by the participants may be crucial to the interpretation of their crea-tive expression (Rose2014, 31). Map-making involves a complex layering of representational codes including; icons, indexes, symbols, pictograms, colours, lines, texts and so on (Pauwels2010, 556). Drawing upon the subject discipline of carto-semiotics, it is possible to generalize a classificatory system of signs as found in a map and thus to formulate a strategy for understanding how maps operate as carriers of information (Schlichtmann2009, 2014). The key classificatory relationship is that between the signified and the signifier which may be:
. arbitrariness (symbols)–whereby meaning is accrued through cultural convention
. similarity (iconic)–a relationship is implied through an abstract representation but nonetheless there is a relationship of physical resemblance
. factual (indexical)–the relationship between the signifier and signified is indicative of a thing by way of the fact of its existence (Goria and Papadopoulou2012, 2)
relationship between the referent and the object is purely symbolic i.e. one of metaphorical or alle-gorical description.
reflexivity tocritical visual methodologythat recognizes there are a variety of positions from which images are seen, each of which constructs its own forms of value, meaning and perspective.
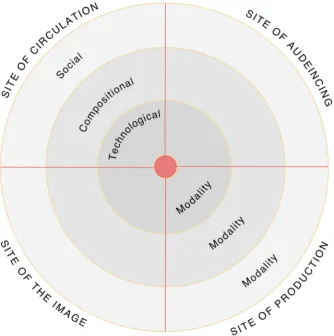
Rose (2016) categorizes the process of visual analysis into four key sites of enquiry: production, the image, its circulation, and its audiences (as can be seen inFigure 2–adapted from Rose2016, 25). She then specifies three modalities at each of these sites that enable further interrogation. These are given as the:
. technological–technologies of production, distribution and display
. compositional–material qualities and formal strategies evident within an image . social–the economic, political, cultural and historical context
Such a reading recognizes the particular ways in which thesocialplays a part (Rose2016, 30) and accounts for the action of production in a place, at a time and within a complexity of social relations. It accepts that whiletechnologiesmay determine form, meaning and effect (Rose2016, 27), aspects of compositionality such as genre may additionally structure the encoding/decoding of the image through the particular conventions deployed by the maker/viewer (Rose2016, 28).
Thus, following Rose (2016) there exists a framework for situating a cartographic approach to VRM in a broader sociological setting, one that acknowledges the researcher as a social actor and
participant in the process of generating data. In this way, it is possible to see how the role of the researcher as insider mediates not only the interpretation of the data but the way in which it is pro-duced. Rose (2016) also provides a means for drilling deeper into the particular materials produced by a cartographic approach through the adoption of the carto-semiotics of Celentano and Pittarello (2012), acting as an analytical lens which enables the interpretation of the data at the‘site of the image’(Rose2016, 25). The aim here is not to generate new knowledge but to test the application of Rose’scritical visual methodologyin the design of an innovative VRM approach. In doing so, it is hoped to not just provide a rigorous set of methodological tools but also to offer insights into the value and robustness of VRM–a method which seeks to employ cartography as a means for render-ing the‘invisible, visible’(Rose2014, 27), by revealing the hidden strategies employed by students when project groups engage with problem encounters.
Methods
The role of the researcher as insider
In the case of research undertaken by an‘insider’there may be ethical concerns that need to be addressed that go beyond the deontological prescriptions of a standard ethics review. The policies and procedures that are put in place as part of an ethical review exist to protect the subject of the research though anonymising of data, safekeeping of personal information and the seeking of informed consent. However, as an employee of the university where the site of research is located, the researcher has a particular relationship with that institution. Beyond ethical requirements of duty and care the university may have concerns around reputation which could impact on the researcher. For example, a situation might arise in which the researcher felt the need to censure their analysis in order to protect the universities reputation should particularly negative or critical responses be recorded by participants. Such a result might place the researcher in an uncomfortable position and might impact on the reporting of findings. There is also the possibility that the‘insider’ becomes an‘outsider’by adopting a position of researcher since colleagues might feel under scru-tiny, an issue which is touched on further in the discussion below.
but nonetheless I am part of the organization and I am perceived as such. With others, as their course unit tutor, I had a direct relationship which at the time of the research had already matured over the course of a semester of study. This relationship of power may have impacted on the participants in a number of ways. The first concerns the recruitment of students who may have felt that there was either an advantage to being involved or that they might be disadvantaged if they were not. Additionally, students may not have fully understood what was being asked of them or the distinc-tion between the role of tutor and researcher. Participants might also present material in order to gain favour, impress or please, all of which might then bring the validity of the data into question.
Trowler (2016) suggests that, while these are significant concerns, the researcher will find legiti-macy through the situating of the research within a lived context that assumes a robust design– one that is reflexive and acknowledges a multiplicity of positions taken by the researcher and the researched. Trowler (2016) advises that research methods should focus on two complementary points of view; the first seeking to explore the situation itself and the social context in which data is produced, the second focussing specifically on the data itself. In the method presented here, the framing of the research design through Rose (2016) addresses the social while the adoption of Celentano and Pittarello (2012) provides for a focus on the data itself. Thus, the role of the researcher as insider is captured in such a way as to avoid claims to the production of knowledge. Instead, what is offered is a contestable form of knowing which is mediated through the social (Trowler2016, 12). Accordingly, the dual role of insider and researcher is acknowledged and reflexively incorporated into the research design in order to flag up ethical concerns and allow for them to be addressed.
Research site
The research site for this study is a university on the south coast of the UK situated in a large urban centre. The institution gained university status in 2005, having its origins in a private School of Art founded in 1856. The building itself is relatively new, having been constructed around 1964 and includes modern classrooms with video projectors, IT facilities, white boards and flexible chairs and tables. The university has a large media arts provision, with a reputation for industry engagement and the integration of project working with real clients into the curriculum.
Recruitment
The recruitment process began with an application to the university’s ethics committee for per-mission to undertake research with students as subjects. This was a fairly straightforward process, involving the submission of a‘research ethics self-release checklist’which was undertaken according to the university’s research ethics policy. As the study was part of a broader doctoral study into project-based learning at another university, a rigorous ethical review process had already been undertaken. Consequently, there were already ethical procedures in place which acknowledged my research role as an‘insider’, or semi-participant observer.
Sample
key to unlocking this difficulty came with a funding award in support of the project, from the univer-sity’s learning and teaching institute, which also took on the role of project champion. This not only provided access to students, but crucially it paid for the purchase of iTunes vouchers which could be given to the participants. Sadly, even the enticement of iTunes vouchers was not enough and out of six sessions that had been arranged, only four ran. In the end, the sample size was reduced from the hoped for sixty, to a total of thirty-four students. The gender balance was fairly even (approximately 50/50) and the sample was taken from mostly first-year students, with a pilot group of third-year stu-dents. The maps produced by both the pilot and subsequent groups have been appended with a P for the former and an S for the latter so that they are clearly differentiated in the results and discus-sion below.
The pilot group (maps appended with a P) were drawn from a L6 documentary production unit on a BA (Hons) Media Production for which I was the unit tutor. The research activity was staged at the conclusion of this unit of study, after their final assessment submission, to ensure the students under-stood that participation would not impact on their grades. In addition, the staging of the activity at this time also encouraged students to make links directly with problem encounters experienced during the course unit and to reflect upon these. The groups for the main part of the study (maps appended with an S) were drawn from a L4 BA (Hons) Film & Television and the research activity was conducted outside of timetabled sessions. The students on this programme of study were not familiar with the researcher and had not met with me prior to the research activity. Given the separ-ation of the activity from any specific scheduled unit of study and the unfamiliarity of the students with the researcher, it is assumed that students may not have directly related their exploration of problem encounters to any one unit of study. As a consequence, the results may describe a more general view of problem solving. Though, in retrospect, it is clear that the activity did in some ways simulate a problem-solving experience this was not anticipated in advance and was not an intended outcome. The goal of the research design aimed specifically to explore the ways in which students manage real problem encounters that emerge from their participation in taught pro-grammes of study.
Research design
Sessions began with a general introduction to the context for the research, followed by students signing participant release forms. I would then undertake a framing exercise aimed at focussing the attention of the participants on the forthcoming activity. This involved presenting them with the question‘what is a problem’in order to initiate a discussion in groups, which then fed back to the wider class. At the conclusion of the discussion, the classic definition of a problem as a gap between where you are and where you want to be was revealed on the PowerPoint slide, in an attempt to further frame the students’thinking in terms of a journey. There then followed a brief brainstorming activity in which students were encouraged to use flip chart paper to outline a list of problems they faced in their own project work. At the conclusion of the discussion, students were asked to rank the differing problems on their list in terms of importance or severity. These were added to flip chart paper as part of the brainstorming process. Students were then asked to mind-map the ways in which they would have solved the problem at the top of their list. This was recorded on sheets of flip chart paper which were later collected by the researcher.
an approach to making their own map. Having discussed how they might employ metaphor in order to transpose the problem they had selected into a feature on a map, the students were then given new sheets of flip chart paper along with bundles of coloured pens and pencils. Working in groups, observed by the researcher, the students then undertook to produce maps. At the conclusion of the activity, each group took turns to pin their map to the wall and answer questions, which the researcher recorded as video clips on an iPad.
Results
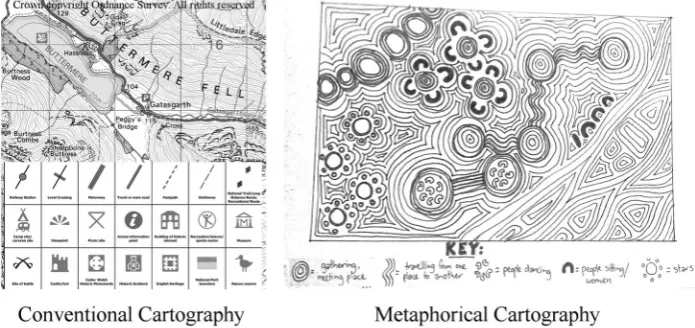
The research activities generated a total of eleven maps that were produced by participants working in group sizes from two to four. On completion of each map, the participants were invited to display the map and answer questions from myself about the meanings of the various components of the maps. This elicitation was recorded on video and subsequently the verbal account given by the par-ticipants was transcribed by a professional transcription service. The maps were initially photo-graphed and later professionally scanned. The maps were hand drawn using felt tip pens and coloured pencils on A0 size white paper. Each map includes a range of individual elements con-structed from lines, shapes, texts, colours and other marks. Some include keys to the various elements while others do not. Some are clearly recognizable in form while others are of a more abstract nature and require the key and/or the participants’verbal elicitation in order for interpretation to take place. The maps were coded according to Celentano and Pittarello’s (2012) carto-semiotic classificatory system and the initial results are tabled below.
Imaginary/direct coding
This group are coded asimaginary/direct(seeappendix: MAPS 3p, 4p, 5p, 7s & 10s) as they are pri-marily imaginary worlds that deploy indexical sign systems based around direct/real cartographic conventions. The maps in this classification largely follow a similar pattern adopting the style of a pirate treasure map, fantasy adventure or, in one case, what appears to be a reference to a level map for a computer game. Not all of the signs deployed in the maps have a clear meaning.
For example, in MAP 4p the mountains have large colourful flowers spouting from them. The reasoning behind this is not explained well by the participants in the elicitation, other than to say they set out to make their documentary film appealing. This is perhaps a weak metaphor, whereas the image in MAP 4p of the stick figure chasing what appears to be a book with a net might be thought of as a strong metaphor. There is a sense of catching something in the wild, which also con-notes the possibility that ideas are elusive and difficult to get hold of.
In another example, MAP 5p includes a whirlpool surrounded by islands which represents the stu-dents’initial attempts to develop a creative idea for their project. Each island represents a problem they faced and the respondents commented that they felt lost and unable to proceed until they finally found a topic (which is represented by the Hollywood island). This island also has a large female figure in a red dress standing upon it. The associated comment in the elicitation refers to someone dying, which might suggest that while the group made progress with their idea, this was at the cost of a group member’s life. This is then followed by a period of conflict symbolized by the skull and cross bones.
In a further example, the producers of MAP 7s have tried to communicate the idea that the most direct route to a solution is not always the best route. The map includes a route marked in red which goes through a minefield, then requires the crossing of a ravine filled with rivers and finally the navi-gation of a lake full of crocodiles. In the elicitation, the respondents explained that the minefield is representative of trying to take short cuts with technical issues which often end up‘blowing up in your face’.
pirate or fantasy adventures that bear resemblance to the kinds of maps to which students may already have been exposed. As such, the solution to the problem of how to represent their experi-ences metaphorically might also be thought of as being largely indexical.
Real/metaphorical coding
Two maps are coded asreal/metaphorical(seeappendix: MAPS 2p & 6p) since they deploy a symbolic sign system that reference a series of real geographic relationships.
MAP 6p is very detailed and includes a range of complex image elements. Through the use of land-forms, flags, costumes, icons and text, the map directly references the real world in order to address the particular problems the group faced. The group of three female students were all of differing nationality and the map connotes the multi-cultural nature of the group dynamic through juxtaposi-tion of these image elements.
It would seem that in addressing the problem of how to represent their experiences metaphori-cally, the respondents have delivered a complex solution that is unique and doesn’t fall back on a need to index other cartographic forms.
Imaginary/metaphorical coding
The final group of maps are coded asimaginary/metaphorical(seeappendix: MAPS 1p, 8s, 9s & 11s) and include a range of differing approaches, all of which operate symbolically to reference ideas, con-cepts and experiences.
For example, MAP 11s deploys a neurological metaphor depicting nerves and neurons. The cloud represents thought from which ideas emerge. The strong blue straight lines are direct routes to problem solutions, which might be obtainable if given unlimited resources. The respondents com-mented that this route might be the most direct but will not always get you the‘best’most creative solution. The blue lines end in‘purple neural nodes’or solutions. Green stars are beautiful ideas, crea-tive influences, inspirations and distractions that you wouldn’t see on the direct route to the solution, while the wriggly lines represent the‘fractal nature of problems’that spiral off each other and interact with each other. The different colours represent other factors that take you through different routes to the same destination. The respondents explained that the most logical direct route is not always the best and repeatedly referred to the blue lines as simplistic and bureaucratic solutions.
In another example, MAP 8s depicts what appears to be a common mnemonic for teaching group working:‘forming, storming, norming, performing’(Abudi2016) which is often used to describe the stages that a group goes through in its genesis. You can see the map starts with individuals, then there is conflict and this leads into a shared experience through which bonding occurs. Communi-cation leads to growth and a group of happy people. When asked if they had heard of this mnemonic during the elicitation, one of the group remembered being taught this during their A-levels, but claimed they hadn’t based the map on it. It was only when the similarity was pointed out that it was recalled.
What is of most interest with these last three examples, is that the respondents have solved the problem of how to represent their experiences metaphorically without recourse to other typical car-tographic forms. It appears that the groups have worked entirely in the symbolic realm to devise their own creative solution to the problem, without the need to index the kinds of maps to which they might typically be familiar. It is this factor that will form the basis for further discussion and evaluation of the study.
Discussion
Through the lens of a critical visual methodology
As established above, there is a need to situate any research design within a social milieu in order to provide validity and robustness. This is even more crucial when the researcher is also an insider, as this will provide an understanding of the ways in which the mediating role of the researcher may have impacted on the study. Following Rose (2016), it is perhaps thesocial modalityat thesite of pro-ductionthat is most problematic for this study, since the difficulties with accessing respondents may have set up a particular kind of social dynamic between researcher and respondent. Mitchell (2006, 68) notes the need to attend to the‘complex field of relations’at play when using visual methods and, in particular, the power relations embedded within the site of production. In the instance of the pilot workshop, the researcher undertook the activity within a timetabled session for one of their own classes. The students who participated in the workshop were given a choice to leave if they did not want to take part (two did) and all the students were given information sheets and the opportu-nity to sign participant release forms. Nonetheless, they had not chosen to participate, nor were they necessarily interested in the activity as something that would produce useful knowledge about the learning process.
For some of these students, the creative challenge that was set for them was clearly fun, engaging and reflective and led to a productive dialogue within the group (seeappendix: MAP 6p). However, one or two other groups may have viewed the activity as a labour that had to be undertaken in order to finish the session and be allowed to leave. That is not to say that the task of map-making was not taken seriously, but the adoption of what I have come to call ahobbitified approach to the map-making activity (seeappendix: MAP 3p), by which I mean the map took the form of a fantasy adven-ture game, may have been symptomatic of a disengagement with the task and an easy solution to a complex problem (thus avoiding the actual problem). One of the advantages might be that drawing on a fantasy map that already included certain codes and symbolic references simplified the process of negotiation. As a group task, negotiating and visualizing abstract ideas is likely to be a complex activity. So, it may be that the adoption of familiar genres is a tactic for managing conflict and build-ing group cohesion.
While the groups subsequent to the pilot workshop were invited to voluntarily participate and were not the researcher’s own students, the sessions were also held during scheduled class time. In addition, these students were offered a £25 iTunes voucher. This did not actually prove that attrac-tive and less than half of the group attended on two occasions and zero on another occasion. The point here is that the students may have attended because they saw a benefit to themselves (see
On the other hand, this interpretation is one intuited by myself in the moment (as soon as the student added it I had a feeling I understood its meaning) and not born of any scientific rationale. This perhaps usefully illustrates the ways in which the polysemic nature of visual imagery may result in interpretations that are informed primarily by the researcher’s own ideological position. As a researcher, I may be unconsciously seeking certain outcomes that relate to the initial research questions, or support my own theories about how students manage problem encounters. As an insider, I also carry with me a range of pre-conceived ideas about students, about how they do pro-jects and about how a research activity should be undertaken. Judgements are also imposed upon the maps and the respondents’ elicitations. Judgements of meaning emerge as the maps are viewed in relation to each other and then compared to other similar texts: real maps, pirate maps, computer game maps, metro maps. Values are ascribed according to my own preconceived expec-tations about what would constitute a good quality research output. The interpretation of images requires data to be extruded from the maps in relation to content, composition, textuality or dis-course, which requires not only attention to detail but an ability to make connections and see the interrelationships and complex of meanings present in the maps. In this sense, the researcher’s skill or experience in analysis of visual media might further skew the results of analysis in one direc-tion or another.
In order to objectively determine the qualities of visual meaning in the maps, the researcher must reflect on their own personal sensory and affective experience of the maps. In this way, it is possible to come to an understanding of the ways in which the meaning imbued within the maps is experi-enced as an embodied, subjective self-awareness. Reflection of this nature is an investigation into all that exists outside of representation (Rose2012, 34). That which exists outside of the image itself is a subjective seeing that is intuitive, full of feeling and cannot be ignored in the interpretation of the images. Thus, the sensory and affective domain of the maps is difficult to divorce from the act of reading. For example, I cannot but help to feel a sense of excitement when looking at more abstract map images even though it could be argued that complexity of image elements is perhaps reduced
(seeappendix: MAP 8s in comparison with MAP 3p). The complexity of image elements can also pose
a puzzle for those examining an image which can produce a feeling of inquisitiveness and affective pleasure (see appendix: MAP 9s) that may not be present when undertaking analysis of a more generic pirate map (seeappendix: MAP 5p). Yet, the pirate map is resplendent with complex symbo-lism and iconography that is certainly worthy of detailed exploration. It is through repeatedly return-ing to the process of codreturn-ing and analysis that the researcher denudes the experience of the affective and sensory in order to apply a cold analytical eye. With this in mind, it is to the analysis of the com-positional modalityat thesite of the imageI wish to now turn.
Through the lens of Carto-semiotics
This is, in fact, a classic messy, ill-defined and uncertain problem central to forms of problem-based learning (Hanney and Savin-Baden 2013, 11). It seems that, without realizing it, I had devised a problem-solving experiment that was observable and which produced extremely useful data (just not quite in the way I had foreseen). What I realize now is, if analysed holistically as a complete image, the maps do in fact reveal a great deal about the hidden process of problem solving. The find-ings suggest that there are, in fact, two approaches employed by students to manage problem encounters. The first, which I will refer to here asindexical, is a process of copying or indexing existing ideas to which students have already been exposed, or with which they are familiar. In other words, they copy something they like or think will otherwise resolve the problem, rather than generate a new and unique solution. This goes someway to explain the preponderance of pirate and fantasy adventure maps in theimaginary/directcoding category. The other groups of students appear to be capable of operating in a more complex cognitive domain. They do not appear to have indexed familiar cartographic forms to arrive at solutions. The maps may tend towards abstraction but appear to function effectively at a metaphorical and symbolic level. The question for educators then, is how to encourage a transformation within theindexicalthinkers towards a more metaphorical process of creative problem-solving.
Framing the issue in terms ofindexicalversusmetaphoricalproblem-solving may usefully provide an answer to this question. This means of framing the issue bears more than a passing similarity to ideas proposed by Duncker (1972) who suggests that the main obstacle to creative problem-solving is what he callsfunctional fixedness. He proposes that in problem-solving there is a cognitive bias at work, which limits a person to using an object the way it has been traditionally used, i.e. the solution is indexed to that which the problem-solver is already familiar. If any element of the solution has a fixed function which has to be changed in order to solve the problem, then the cognitive bias offunctional fixedness can work to constrain possible solutions. For example, if asked to represent a personal experience through map-making, then there is a tendency to index our previous experiences of maps in order to derive a solution. This involves carrying over to the solution common ideas of maps such as pirate maps, fantasy adventure maps, computer game maps, OS maps and so on. In doing so, the generation of a novel or innovative solution may be impeded (Chrysikou et al.2016). In this sense, the indexing of a map as a familiar object is indicative of functional fixedness (Duncker1972) and works to constrain creativity.
Of more importance to this study is the question of how to overcomefunctional fixedness, a major concern for those who encounter this bias among students and in their classrooms. The ability to move beyond the original use of an object is the primary challenge for those wishing to overcome functional fixedness. Studies suggest that the bias can indeed be overcome by adopting adefixiating approach. One such approach works through the presentation of well-designed analogies (see Chry-sikou and Weisberg2005; Solomon1994). The use of analogy serves to offer comparable examples that exhibit similar properties and techniques and teaches students to ask the question‘how have I seen this problem solved before’. Other studies (see Carnevale and Probst 1998; McCaffrey2012) approach problem solving by breaking an object down into smaller and smaller parts before re-describing each part in order to disassociate it from its origins. Referred to as theobscure hypothesis technique (McCaffrey and Krishnamurty2015) the aim is to decouple the object from the original context that produced the problem and unconceal that which is hidden (McCaffrey 2012, 2), thereby offering a means for getting at the array of features that exist within any object. Though these approaches offer a way forward, they also present challenges since all of the existing work on the topic appears to be concerned with objects and situations that might be thought of as having some concrete basis, whereas, media practice is largely concerned with more abstract con-cerns such as story and narrative. Consequently, the techniques outlined in the literature are not directly applicable to a media practice context. There needs to be further research design and testing of suitable approaches if this insight into the problem-solving strategies of creative media stu-dents is to be resolved.
It is important to note that there may also be other issues at work beyond the simple cognitive bias offunctional fixedness.In fact, group working may well be aconfounding variable.The noise of group working, the complexities of interactions, the differing interpersonal skill sets and the differing problem-solving styles of individuals (Treffinger, Selby, and Isaksen2008, 393) may all be contributors that impact on a group’s ability to work indexically or metaphorically. It may be that the adoption of familiar cartographic forms, such as a pirate map, is an effective solution to dealing with difficult and conflicting opinions within a group. This could, on one hand, be indicative of good group manage-ment if the decision-making process is clearly led. Or, it could be indicative of a dysfunctional group who, despite individual capabilities for metaphorical thinking, are not able to operate collectively at the symbolic level. It is clear that further research is required in order to identify the factors that limit group-based problem solving. The research design seemingly has value, since it provides an exper-imental tool that provokes group-based problem solving in a manner that foregrounds the complex-ities of group dynamics. However, as a method for rendering the‘invisible, visible’(Rose2014, 27) it is limited since in order to extract meaningful data from the research activity, the group interactions would still need to be observed.
Conclusion
does give voice to the challenges that students face in a way that allows educators to read in them their own perspective and point of view. It also functions as a tool for promoting reflection, nego-tiation, communication and other group-working skills and may have a pedagogic life beyond that of the research study.
As a practitioner and researcher, there is a direct relationship between the findings that have emerged from this study and the impact it has on my own teaching practice. The initial research questions emerged from my own reflection-on-action and have led to new insights into why some students struggle with problem solving. The role of practioner/researcher is one of achange agent(Trowler2016, 19), i.e. an educator who seeks to influence a wider audience of practitioners and to advance the debate around the particularities of media practice education. Though there are challenges ahead, there are also clear avenues for further investigation that might lead to new pedagogical approaches to learning and teaching in the media practice context. The evidence that emerges from this study of the bifurcation between indexical and metaphorical approaches to problem solving now merits further exploration in the light of theories aboutfunctional fixedness. In particular, there is a need to look further into the ways in whichfunctional fixednessconstrains crea-tive-problem solving and to consider how this might be removed as a barrier to expression and creativity.
Disclosure statement
No potential conflict of interest was reported by the author.
Funding
This work was supported by the Solent Learning & Teaching Institute under their seed funding scheme 2016.
ORCID
Roy Hanney http://orcid.org/0000-0001-7374-0032
References
Abudi, G.2016. The Five Stages of Project Team Development. Accessed October 2017.https://project-management. com/the-five-stages-of-project-team-development/.
Ahlberg, M. K., and J. Wheeldon.2012.Social Science Research: Maps, Methods & Meaning. London: SAGE. Banks, M.2008.Using Visual Data in Qualitative Research. London: Sage.
Carnevale, P. J., and T. M. Probst.1998.“Social Values and Social Conflict in Creative Problem Solving and Categorization.” Journal of Personality and Social Psychology74 (5): 1300–1309.
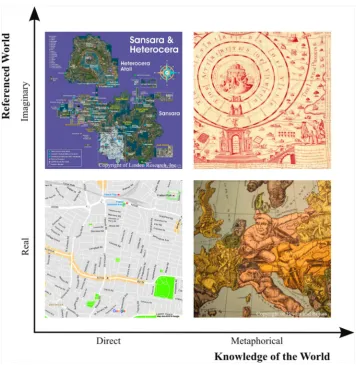
Celentano, A., and F. Pittarello.2012.“From Real to Metaphoric Maps: Cartography as a Visual Language for Organizing and Sharing Knowledge.”Journal of Visual Languages and Computing23: 63–77.
Chrysikou, E. G., K. Motyka, C. Nigro, S. I. Yang, and S. L. Thompson-Schill.2016.“Functional Fixedness in Creative Thinking Tasks Depends on Stimulus Modality.”Psychology of Aesthetics, Creativity, and the Arts10 (4): 425–435.
Chrysikou, E. G., and R. W. Weisberg.2005.“Following the Wrong Footsteps: Fixation Effects of Pictorial Examples in a Design Problem-Solving Task.”Journal of Experimental Psychology: Learning, Memory, and Cognition31 (5): 1134–1148. Duncker, K.1972.On Problem-Solving. New ed. Westport: Greenwood.
Gauntlett, D., and A. Fatimah.2012.“Action-Based Visual and Creative Methods in Social Research.”InThe Handbook of Visual Culture, edited by I. Heywood, and B. Sandywell, 589–606. London: Berg.
German, T. P., and H. C. Barrett.2005.“Functional Fixedness in a Technologically Sparse Culture.”Psychological Science16: 1–5.
German, T. P., and M. A. Defeyter.2000.“Immunity to Functional Fixedness in Young Children.”Psychonomic Bulletin and Review7 (4): 707–712.
Goria, S., and M. Papadopoulou.2012.“Icons Versus Symbols: Investigating Preschoolers’Cartographic Design.”Journal for Theoretical Cartography5. Accessed October 2017.http://meta-carto-semiotics.org/uploads/mcs_vol5_2012/MCS_ Vol5_2012_Goria.pdf.
Gruber, T.2016. “Great Apes Do Not Learn Novel Tool Use Easily: Conservatism, Functional Fixedness, or Cultural Influence?”International Journal of Primatology37 (2): 296–316.
Hanney, R., and M. Savin-Baden.2013.“The Problem of Projects: Understanding the Theoretical Underpinnings of Project-Led PBL.”London Review of Education11 (1): 7–19.
Huitt, W., and J. Hummel.2003. Piaget’s Theory of Cognitive Development.http://www.edpsycinteractive.org/topics/ cognition/piaget.html.
Humphrey, C.2013.“Dilemmas in Doing Insider Research in Professional Education.”Qualitative Social Work: Research and Practice12 (5): 572–586.
McCaffrey, T.2012.“Innovation Relies on the Obscure: A Key to Overcoming the Classic Problem of Functional Fixedness.” Psychological Science23 (3): 215–218.
McCaffrey, T., and S. Krishnamurty.2015.“The Obscure Features Hypothesis in Design Innovation.”International Journal of Design Creativity and Innovation3 (1): 1–28.
Mitchell, L. M.2006.“Child-Centered? Thinking Critically About Children’s Drawings as a Visual Research Method.”Visual Anthropology Review22: 60–73.
Pauwels, L.2010.“Visual Sociology Reframed: An Analytical Synthesis and Discussion of Visual Methods in Social and Cultural Research.”Sociological Methods and Research38 (4): 545–581.
Peirce, C.S.1994.Peirce on Signs: Writings on Semiotic. Edited by J. Hoopes. Chapel Hill, NC: University of North Carolina Press.
The Perfect Human.1967. Directed by Leth, J. Denmark.
Perry, W. G.1970.Forms of Intellectual and Ethical Development in the College Years: A Scheme. New York: Holt, Rinehart & Winston. http://search.ebscohost.com/login.aspx?direct=true&db=cat01619a&AN=up.135864&site=eds-live. Rose, G.2012.Visual Methodologies: An Introduction to Researching with Visual Materials. 3rd ed. Los Angeles, CA;London:
SAGE. http://search.ebscohost.com/login.aspx?direct=true&db=cat01619a&AN=up.985357&site=eds-live.
Rose, G.2014.“On the Relation Between‘Visual Research Methods’and Contemporary Visual Culture.”The Sociological Review62 (1): 24–46.
Rose, G.2016.Visual Methodologies: An Introduction to Researching with Visual Materials. 4th ed.London: SAGE. http:// search.ebscohost.com/login.aspx?direct=true&db=cat01619a&AN=up.1198091&site=eds-live.
Schlichtmann, H.2009.“Overview of the Semiotics of Maps.”In24th International Cartographic Conference. Santiago, Chile.
Schlichtmann, H.2014. “Information in Maps: Basic Characteristics.”Journal for Theoretical Cartography7. Accessed October 2017.http://meta-carto-semiotics.org/uploads/mcs_vol7_2014/MCS_Vol7_2014_Schlichtmann.pdf. Solomon, I.1994.“Analogical Transfer and ‘Functional Fixedness’ in the Science Classroom.”Journal of Educational
Research87 (6): 371–377.
The Five Obstructions.2003. Directed by Von Trier, L. Denmark: Jensen, Pa and Windeløv, V.
Treffinger, D. J., E. C. Selby, and S. G. Isaksen.2008.“Understanding Individual Problem-Solving Style: A Key to Learning and Applying Creative Problem Solving.”Learning and Individual Differences18: 390–401.