852
Copyright © 2011-15. Vandana Publications. All Rights Reserved.
Volume-5, Issue-2, April-2015
International Journal of Engineering and Management Research
Page Number: 852-862
Effectiveness of Integrated Marketing Communication Strategies Relating
to Housing Projects in Bangalore District
Dr. K. Nagendra Babu1, Lakshmana Y.G.2 1
Chairman & Associate Professor, Department of Commerce, University of Mysore, Mysore, INDIA 2
Assistant Professor, BNM Degree College, Bangalore & PhD Research Scholar, Department of Commerce, University of Mysore, Mysore, INDIA
ABSTRACT
Bangalore housing market is in the rise because of climatic advantages leading to best destination for education, health, employment and investment. However, studies show that that there are oversupplies of houses. Significant increase in the inventory is putting pressure on builders. Though the external factors are improving, other factors such as effectiveness of marketing communication of builders’ are necessary for growth of the sector. Many studies have highlighted the added effectiveness of the promotion tools by synergy through of integrated marketing communication. Nevertheless, execution of the IMC plan also requires an evaluation process to ensure the effectiveness of the effort. Usually the effectiveness is measured by two methods. One is the sales results for every rupee spent. The other method is an indirect evaluation in which the enhancement in brand equity is measured. The research is designed to test the effectiveness of integrated marketing communication for the housing projects done by the builders in Bangalore urban district. The effectiveness is measured in terms of whether the marketing communication through various promotion tools has reached the consumer and has created awareness, familiarity, liking and involvement towards the brand.
Keywords---- Integrated Marketing Communication Strategies, Housing Projects and Builders.
I.
INTRODUCTION
853
Copyright © 2011-15. Vandana Publications. All Rights Reserved.
of land space in metro areas, escalating land cost anddevelopment of housing projects far away from the central district. On one hand, Urban India has high housing shortage; on the other hand, there is a massive and rapidly growing stock of vacant houses. Though marketing of basic needs are considered easy. The private housing projects are products of high value and require huge marketing efforts. This study looks at the promotion of housing projects done by builders in urban area and finds their effectiveness individually and as an integrated marketing communication that provide a synergy to marketing. Housing products are high priced and decisions are many times lifetime oriented. Consumers consider many factors in buying decision and marketing communication need to be strategic to convince to buy the product from their company. This means that builders need to understand what to communicate so that it creates an attention.
II.
REVIEW OF LITERATURE
Many studies have highlighted the added effectiveness of the promotion tools by synergy through integrated marketing communication. Integrated marketing communications involves the coordination of many elements such as Promotion (Communication) Place (Convenience) Product (Customer) Price (Cost) through media advertising, direct mail, personal selling, sales promotion and public relations in order to produce a clear, unified, consistent and compelling customer-focused message about the organizations and its product. Nevertheless, execution of the IMC plan also requires an evaluation process to ensure the effectiveness of the effort. Usually the effectiveness is measured by two methods. One is the sales results for every rupee spent. The other method is an indirect evaluation in which the enhancement in brand equity is measured. The exhaustive review of the literature done by the researcher has revealed the research gap and hence this research is undertaken
• Jaehyuk Lee, Haeseong Je & Dong Woo Shin (2004) ) in their collective study titled, “Marketing strategy of Housing Construction Firms and Consumer’s Residential Consciousness: Evidence from Apartment Residents in Korea” aims to evaluate residential satisfaction based on the marketing factors of well-being apartments, as it is a high quality housing where residents are satisfied with the physical environment for their happiness & health. The marketing strategy of Korea’s housing construction firms is classified as green, well-being and ubiquitous. They found that overall residential satisfaction of the accredited green buildings is higher than non-accredited, the green
building residents are more satisfied with outdoor spaces than residential units, the unit design is considered to be more important than outdoor space design, the alternative energy use is going to be necessary in the future and the improvement of unit design is considered to be important in order to satisfy resident’s concern on well-being.
• Urmi Sengupta (2005) in her research titled “ Government intervention and public private partnerships in housing delivery in Kolkata” seeks to reflect on the emerging concept of public private partnership in developing countries as an offshoot of enabling strategies for housing delivery. It is the most prominent urban housing policy that has emerged in the last decade in India. Housing reforms in Kolkata under the flagship of PPP has taken the city in to a different league after decades of ineffective housing policy. The performance of PPP in Kolkata is apparent from the improvements made in the condition, quality and stock of housing as the joint approach brings together the efficiency in production and technical and marketing expertise of the private sector with the accountability and righteousness of the public sector. Although housing production under the PPP model has been impressive in terms of costs & quality, there are major roadblocks identified include, antiquated legislation and the high levels of municipal taxes, stamp duties & sanction fees.
• In the research study conducted by Al-Homoud, Al-Oun, Ayat Smadi, & Al- Hindawi (2009) titled “Exploring sales advertising in the housing market in Jordan” stated that sales advertisings are rarely used, though they, potentially, increase profits and sales and expand
development geographically. The purpose of this paper is to investigate the use of sales advertising in the emerging housing market in the city of Irbid, Jordan.
• The major finding s of the study is that the use of sales advertising in the housing market in Irbid is low. The major advertising methods include public relations and word of mouth along with a limited use of newspaper and on-site advertising. The obstacles developers face include lack of conviction, unawareness about advertising effect, lack of advertising professionals, lack of skills in advertisement designs and inability to afford it. This study recommends developers should be educated in terms of advertising management.
854
Copyright © 2011-15. Vandana Publications. All Rights Reserved.
down to 2-3% as per global practice, which is now in Indiavaries from 8-14% and fraud cases are also increasing day by day & careful measures and laws should be enacted to deal with these types of situations.
• A study by Seng, Yusof and Abidin (2011) titled “Types of innovation implemented by housing developers in a developing country” aims to investigate the types. The results have also demonstrated that housing developers implement market innovation as well as product innovation. Market innovation consists of exploring new business opportunities and the best way of serving it, is to focus more on customers’.
III.
STATEMENT OF THE PROBLEM
Selection of the communication methods requires to consider the different factors such as market type, product nature, product life cycle stage, price, and the availability of funds for promotion. Brand awareness, Brand familiarity, brand likeability and product involvement are used in finding the effectiveness of the integrated marketing communication in this study. The purpose of the study is to identify and analyze the integrated marketing communication strategies across several enterprises, societies & Government bodies engaged in the provision of housing and find the impact of them in bringing a positive change in terms of their objectives, growth and new trends in the field of housing sector. This research aims to identify the applicability and usefulness of the current integrated marketing communication strategies that are used in marketing housing projects in Bangalore urban district. The study also suggests the various methods and strategies that will be more beneficial in the interest of both the users and providers. Therefore the title for the study is framed as:
“Are the IMC Strategies relating to housing projects in Bangalore district effective?”
IV.
OBJECTIVES OF THE STUDY
1. To study the Integrated Marketing Communication tools used by housing project companies Bangalore district. 2. To analyse and compare the Integrated Marketing
Communication tools of different housing project companies Bangalore district.
3. To find out the effectiveness of Integrated Marketing Communication tools used by different housing project companies in Bangalore district.
V.
HYPOTHESES OF THE STUDY
• H1: There is significant influence of interaction effect (synergic effect) of promotional tools on brand awareness.
H0
• H
: There is no significant influence of interaction effect of promotional tools on brand awareness.
2: There is significant influence of interaction effect on brand image. H0
• H3: There is significant influence of interaction effect on involvement. H
: There is no significant influence of interaction effect on brand image.
0
• H
: There is no significant influence of interaction effect on involvement.
4: There is significant influence of interaction effect on likeability. H0: There is no significant influence of interaction effect on likeability.
VI.
SCOPE OF THE STUDY
The study covers the integrated marketing communication strategies of different players in housing sector. The study covers the importance, methods and effectiveness of integrated marketing communication strategies in marketing housing projects. The study comparatively analyses the integrated marketing communication strategies of different players. In addition to this, the study looks forward to develop new varieties of different methods of integrated marketing communication strategies in marketing housing projects. The study covers the housing projects in the geographical jurisdiction of Bangalore urban district.
VII.
RESEARCH METHODOLOGY
855
Copyright © 2011-15. Vandana Publications. All Rights Reserved.
has reached the consumer and has created familiarity,liking and involvement towards the brand. An ex-post facto or descriptive study is done. Usually the descriptive studies utilize the survey method. Therefore a survey method using a questionnaire was done. The unit of analysis is individual consumers.The sample size required for the study was calculated as 1280. A pretested, structured instrument was used for measuring the response. To maximise the probability of response rate in an email survey Tailored Design Method (TDM) proposed by Dillman (2007) was used. . It also provides a systematic procedure for survey implementation. The survey instrument was developed by adopting standard scales for brand recall, Brand recognition, involvement, brand familiarity and brand likeability. The exposure and experience of the promotional tools were listed from various sources and the scale measuring the frequency of exposure to the promotional tool of a particular brand was included.
VIII.
SOURCES OF DATA COLLECTION
The study is primarily relying on the primary data which is collected by administering a structured questionnaire. Wherever feasible and available, secondary data will be employed for the purposes of comparisons and inferences.
Tools and Techniques used for Data Analysis:
The statistical tools of Inferential statistics such as ANOVA to find the reliability of the model and multiple regression analysis are used to make claims about the entire populations from the data collected from the sample picked from the population. This requires that we go
beyond the data available to us and may be subject to error during the claims. So that the assumption is close to the truth.
IX.
DATA ANALYSIS AND
INTERPRETATION
To find out the Full interaction effect (Combined /Synergic effect) of promotional tools:
The effectiveness of the IMC effect of the marketing communication tools like Advertisement, Sales Promotion, Personal selling, Direct Marketing, Interactive Marketing and Public Relations is tested by multiple regression in which the synergy of the tools is included as the moderator. The variable is named as ‘Interaction effect’, which is calculated by the product of all promotion tools. The following hypothesis is framed for the test.
1. To Find The Synergic Effect of Promotional Tools on Brand Awareness, the Following Hypothesis is Framed for The Test.
• H1: There is significant influence of interaction effect (synergic effect)of promotional tools on brand awareness.
• H0: There is no significant influence of interaction effect of promotional tools on brand awareness.
Table-1: Synergic effect of promotion tools on Brand Awareness
Dependent Variable Brand Awareness
Predictors Advertisement, Sales Promotion, Personal selling, Direct Marketing, Interactive Marketing and Public Relations
856
Copyright © 2011-15. Vandana Publications. All Rights Reserved.
Model SummaryR R Square Adjusted R Square Std. Error of the Estimate
0.782 0.611 0.610 .29840849
ANOVA
Sum of Squares df Mean Square F Sig.
Regression 838.903 7 119.843 306.510 .000
Residual 534.097 1366 0.391
Total 1373 1373
Coefficients
Unstandardized Coefficients Standardized Coefficients
t Sig.
B Std. Error Beta
(Constant) -3.043 .040 -15.387 .000
Advertisement .328 .003 .369 10.591 .000
Sales Promotion .236 .004 .300 9.826 .000
Personal selling .244 .007 .276 3.378 .001
Direct Marketing .218 .006 .276 3.166 .002
Interactive Marketing .213 .002 .310 6.572 .000
Public Relations .255 .003 .334 8.189 .000
Interaction effect 6.852 .000 6.009 3.124 .002
(Source: survey data)
• First, the effect on brand awareness is tested and the results are presented in the table. The model
857
Copyright © 2011-15. Vandana Publications. All Rights Reserved.
model is analysed from the ANOVA table. Thevalues F=306.510, P=0.000 shows that the regression model is significant. Therefore, it can be concluded that brand awareness can be predicted by the promotional tools and the interaction effect. This implies 61.1% of the variation in the dependent variable is because of the predictor variables taken for the study under the influence of the moderator variable.
• Analysing the regression coefficients (B) reveal that all the promotional tools have significant influence. Advertisements (B=0.328, t= 10.591) has the highest influence and Interactive marketing (B=0.213, t=6.572) has the lowest influence on the brand image. Other promotional tools like Personal selling (B=0.244, t=3.378), Direct marketing (B=0.218, t=3.166), sales promotion (B=0.236, t=9.862) and Public relations (B=0.255, t=8.189) have positive and significant influence on brand awareness.
• To understand the synergic effect, the regression coefficient of interaction effect is analysed. The value is found to be (B=6.852, t=3.124), which is positive and significant. This shows that there is
synergic effect of the promotional tools on brand awareness. However to check if the interaction has improves the brand awareness, the R-square is compared with the model without interaction effect in table. R-Square value for the previous model is 0.513 and the current model is 0.611. This shows that the model predictability has increased by the interaction effect. Therefore, the null hypothesis is rejected and conclude that there is significant influence of interaction effect on brand awareness.
2. To Find The Synergic Effect Of Promotional Tools On Brand Image, The Following Hypothesis Is Framed For The Test.
• H2
• H
: There is significant influence of interaction effect on brand image.
0: There is no significant influence of interaction effect on brand image.
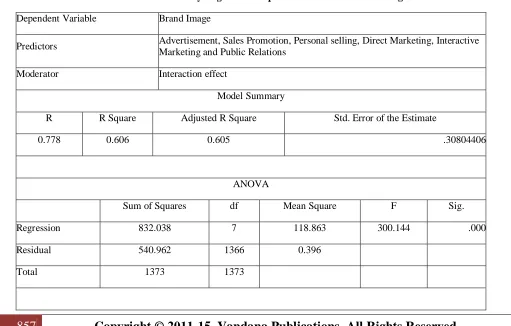
Table -2 Synergic effect of promotion tools on Brand Image
Dependent Variable Brand Image
Predictors Advertisement, Sales Promotion, Personal selling, Direct Marketing, Interactive Marketing and Public Relations
Moderator Interaction effect
Model Summary
R R Square Adjusted R Square Std. Error of the Estimate
0.778 0.606 0.605 .30804406
ANOVA
Sum of Squares df Mean Square F Sig.
Regression 832.038 7 118.863 300.144 .000
Residual 540.962 1366 0.396
858
Copyright © 2011-15. Vandana Publications. All Rights Reserved.
CoefficientsUnstandardized Coefficients Standardized Coefficients
t Sig.
B Std. Error Beta
(Constant) -2.895 .042 -9.478 .000
Advertisement .342 .003 .464 12.490 .000
Sales Promotion .322 .004 .485 5.873 .000
Personal selling .239 .007 .320 .539 .590
Direct Marketing .258 .006 .372 6.937 .000
Interactive Marketing .205 .002 .245 1.185 .236
Public Relations .253 .003 .302 2.619 .009
Interaction effect 3.839 .000 2.050 5.216 .000
(Source: survey data)
• The IMC effect of the predictor variables viz. Advertisement, Sales Promotion, Personal selling, Direct Marketing, Interactive Marketing and Public Relations on the dependent variable ‘brand image’ with the moderator variable ‘Interaction effect’ is tested by multiple regression and the results are presented in the table. The model fitness R square value is found to be 0.606. The significance of the model is analysed from the ANOVA table and the values F=300.144, P=0.000 shows that the regression model is significant. Therefore, it can be concluded that brand image can be predicted by the promotional tools and the interaction effect. This implies 60.6% of the variation in the dependent variable is because of the predictor variables taken for the study under the influence of the moderator variable.
• Analysing the regression coefficients (B) reveal that except for personal selling and interactive marketing, all the other promotional tools have significant influence. Advertisements (B=0.342, t= 10.490) has the highest influence and public relations (B=0.253, t=2.619) has the lowest influence on the brand image.
• Other promotional tools like sales promotion (B=0.322, t=5.873) and Direct marketing (B=0.258, t=6.937) have positive and significant
influence on brand image. Personal selling (B=0.293, t=0.590), and Interactive marketing (B=0.205, t=1.185) have positive but insignificant influence on brand image.
• To understand the synergic effect, the regression coefficient of interaction effect is analysed. The value is found to be (B=3.839, t=5.216), which is positive and significant. This shows that there is synergic effect of the promotional tools on brand Image. However to check if the interaction has improves the brand image, the R-square is compared with the model without interaction effect in table. R-Square value for the previous model is 0.509 and the current model is 0.606. This shows that the model predictability has increased by the interaction effect. Therefore, the null hypothesis is rejected and conclude that there is significant influence of interaction effect on brand image.
3. To Find The Synergic Effect Of Promotional Tools On Involvement, The Following Hypothesis Is Framed For The Test.
• H3: There is significant influence of interaction effect on involvement.
859
Copyright © 2011-15. Vandana Publications. All Rights Reserved.
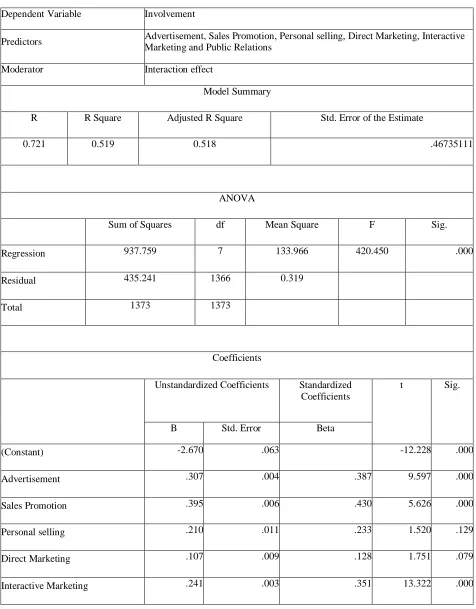
Table – 3 Synergic effect of promotion tools on InvolvementDependent Variable Involvement
Predictors Advertisement, Sales Promotion, Personal selling, Direct Marketing, Interactive Marketing and Public Relations
Moderator Interaction effect
Model Summary
R R Square Adjusted R Square Std. Error of the Estimate
0.721 0.519 0.518 .46735111
ANOVA
Sum of Squares df Mean Square F Sig.
Regression 937.759 7 133.966 420.450 .000
Residual 435.241 1366 0.319
Total 1373 1373
Coefficients
Unstandardized Coefficients Standardized Coefficients
t Sig.
B Std. Error Beta
(Constant) -2.670 .063 -12.228 .000
Advertisement .307 .004 .387 9.597 .000
Sales Promotion .395 .006 .430 5.626 .000
Personal selling .210 .011 .233 1.520 .129
Direct Marketing .107 .009 .128 1.751 .079
860
Copyright © 2011-15. Vandana Publications. All Rights Reserved.
Public Relations .380 .005 .436 17.086 .000
Interaction effect 1.247 .000 1.016 .648 .517
(Source: survey data)
• The IMC effect of the predictor variables viz. Advertisement, Sales Promotion, Personal selling, Direct Marketing, Interactive Marketing and Public Relations on the dependent variable ‘Involvement’ with the moderator variable ‘Interaction effect’ is tested by multiple regression and the results are presented in the table. The model fitness R square value is found to be 0.519. The significance of the model is analysed from the ANOVA table and the values F=420.450, P=0.000 shows that the regression model is significant. Therefore, it can be concluded that Involvement can be predicted by the promotional tools and the interaction effect. This implies 51.9% of the variation in the dependent variable is because of the predictor variables taken for the study under the influence of the moderator variable.
• Analysing the regression coefficients (B) reveal that except for personal selling and Direct marketing, all the other promotional tools have significant influence. Sales promotion (B=0.395, t= 5.626) has the highest influence and Interactive marketing (B=0.241, t=13.322) has the lowest influence on the Involvement. Other promotional tools like Advertisement (B=0.307, t=5.626) and Public Relations (B=0.380, t=17.086) have
positive and significant influence on brand image. Personal selling (B=0.210, t=1.520), and Direct marketing (B=0.107, t=1.751 have positive but insignificant influence on Involvement.
• To understand the synergic effect, the regression coefficient of interaction effect is analysed. The value is found to be (B=1.247, t=0.648), which is positive but insignificant. This shows that there is no synergic effect of the promotional tools on Involvement. However, the R-square is compared with the model without interaction effect in table. R-Square value for the previous model is 0.483 and the current model is 0.519. This shows that the model predictability has increased by the interaction effect. Therefore, the null hypothesis is accepted and conclude that there is no significant influence of interaction effect on involvement.
4. To Find The Synergic Effect Of Promotional Tools On Likeability, The Following Hypothesis Is Framed For The Test.
• H4
• H
: There is significant influence of interaction effect on likeability.
0
•
: There is no significant influence of interaction effect on likeability.
Table- 4 Combined / synergic effect of promotion tools on Likeability
Dependent Variable Likeability
Predictors Advertisement, Sales Promotion, Personal selling, Direct Marketing, Interactive Marketing and Public Relations
Moderator Interaction effect
Model Summary
R R Square Adjusted R Square Std. Error of the Estimate
861
Copyright © 2011-15. Vandana Publications. All Rights Reserved.
ANOVASum of Squares df Mean Square F Sig.
Regression 939.132 7 134.162 422.398 .000
Residual 433.868 1366 0.318
Total 1373 1373
Coefficients
Unstandardized Coefficients Standardized Coefficients
t Sig.
B Std. Error Beta
(Constant) -2.673 0.063 -12.395 .000
Advertisement 0.295 0.004 0.401 15.62 .000
Sales Promotion 0.324 0.006 0.432 0.867 .386
Personal selling 0.278 0.011 0.345 0.810 .417
Direct Marketing 0.145 0.009 0.215 1.036 .150
Interactive Marketing 0.194 0.003 0.234 3.407 .000
Public Relations 0.402 0.005 0.443 4.907 .000
Interaction effect 1.201 0.001 1.321 15.804 .000
(Source: survey data)
• Above Table presents the synergic effect of the predictor variables viz. Advertisement, Sales Promotion, Personal selling, Direct Marketing, Interactive Marketing and Public Relations on the dependent variable ‘likeability’ with the moderator variable ‘Interaction effect’. R-square value is found to be of 0.684 and is significant
with F = 422.398, P=0.000. This implies 68.3% of the variation in the dependent variable is because of the predictor variables taken for the study under the influence of the moderator variable.
862
Copyright © 2011-15. Vandana Publications. All Rights Reserved.
tools have significant influence. Public relations(B=0.402, t=4.907) has the highest influence and Interactive marketing (B=0.194, t=3.407) has the lowest influence on the Likeability. Advertisement (B=0.295, t=15.62) has positive and significant influence but sales promotion (B=0.324, t=0.867) Personal selling (B=0.278, t=0.810), and Direct marketing (B=0.145, t=1.036) have positive but insignificant influence on Likeability.
• To understand the synergic effect, the regression coefficient of interaction effect is analysed. The value is found to be (B=1.201, t=15.804), which is positive and significant. This shows that there is synergic effect of the promotional tools on likeability. However to check if the interaction has improves the likeability, the R-square is compared with the model without interaction effect in table. R-Square value for the previous model is 0.584 and the current model is 0.684. This shows that the model predictability has increased by the interaction effect. Therefore, the null hypothesis rejected and concludes that there is significant influence of interaction effect on likeability.
X.
FINDINGS
The conceptual model for the study shows the effectiveness of the promotional tools is measured by its influence on the brand awareness, familiarity and likeability.The synergy is tested by the interaction effect of promotional tools on brand outcomes.
1. The respondent’s exposure to the various advertisements of the presented brand was measured. The results show that the respondents have seen newspaper, classified, magazine and billboards of the brand very often.
2. Majority of respondents have been exposed to radio, television, transit ads, wall painting, lamppost and tree ads, and digital & neon signs often. Posters, Point of sales, cinema ads and slides are sometimes seen.
3. The study revealed that cash refund offers, price packs, premiums are often seen.
4. Under personal selling, majority of the respondents have often seen fairs and trade shows.
5. Majority of them said that they have heard of site visits by the company. Sales calls and visit by sales persons were sometimes seen.
6. In the direct marketing activities, the study found that many respondents have come across direct mailers, newspaper inserts and catalogues of the presented brand often. Majority said that they had telemarketing of the brand sometime.
7. The study found that in interactive marketing, Search engine marketing and social networking was often seen by majority of respondents. 8. Other interactive tools such as email, banner,
blogging, pop ups, mobile apps, banners pop ups were seen sometimes by majority of the respondents.
9. The study shows that more than half of the respondents have often seen the media sponsors, event sponsors, public utilities and media news. Almost half of the respondents reported that they have often come across social responsibility activities of the builders
10. On an average, involvement of the respondents on the brands was found high.
XI.
SUGGESTIONS
• The outcome of the study recommends that the effectiveness of integrated marketing communication is not by the synergy of the entire range of promotion tool but precisely choosing the combination of the tools. The choice needs to be based on the product.
• For creating brand likeability, and brand involvement, builders should use the personal communication tools.
• The synergy of the marketing communication is first due to the consistency of the message whereby consumer is able to track the same message across the media and effectiveness is due to the combination of personal and impersonal communication tools.
• Online advertisements are recommended to including at least six photographs. Photographs are useful in highlighting positive features of the house. Online media use animated or architectural drawing for presenting the picture. Interactive online media is helpful in creating virtual tour of the home; giving potential buyers a 360-degree view of the home.
• Being personal tool it is required to entice the customers to visit it in person. This requires the IMC to include the web address for the online listing in the print ad to attract buyers.
863
Copyright © 2011-15. Vandana Publications. All Rights Reserved.
communication, but also identifying the tools thatcan reach the consumers effectively and synergistically.
XII.
CONCLUSION
The interaction effect to test the synergy of all promotion tools together on brand likeability reveal that the synergy has an influence on the brand likeability. Therefore, apart from the individual and simultaneous effect, when the messages across the tools are consistent, the synergy will create more brand liking. However, comparing its effect on brand awareness and brand image, the results show that the effect is less than brand awareness and brand image.
The interaction of direct marketing and interaction marketing, between sales promotions and direct marketing, between personal selling and interactive marketing do not have significance on the likeability. Similarly, interaction between sales promotion and interaction marketing and between sales promotion and public relations do not have influence on likeability. Except for the mentioned relations, other interactions have an influence on the likeability.