Evapotranspiration and
Soil Moisture-Fertilizer Interrelations
With Irrigated Grain Sorghum
in the Southern High Plains
Conservation Research Report No. it
Agricultural Research Service
UNITED STATES DEPARTMENT OF AGRICULTURE
in cooperation with
CONTENTS
Study area Location
Soil
Climate Procedure
Experimental design Moisture levels Fertilizer treatments Cultural practices
Evapotranspiration determinations Other measurements
Results and discussion_ Evapotranspiration Gram yield
Grain quality
Other crop characteristics Water use efficiency
Irrigation water management Summary and conclusions
Literature cited Appendix
Page 1 1
2 a 5
5 5 5 5 6 6 6 6 8 11 12 14 15
16 17 18
Evapotranspiration and Soil Moisture-Fertilizer Interrelations with Irrigated
Grain Sorghum in the Southern Great Plains
By MARVIN E. JENSEN and WILLI8 H. BLETTEN Sa and Water Conservation Research Division, Agriczilturai Research Service'
In 1956 and 1957 grain sorghum represented 37 yercent of the harvested crop acreage in Texas (14 .' The largest concentrated area of sorghum is in the High Plains where the proportion of sorghum irrigated increased greatly during
the
drought years of the 1950's. In 1959 the mone-tary value of irrigated grain sorghum was esti-mated to be about $100 million.
As reported by the U.S. Census of Agiculture i the acreages of irrigated grain sorghum harvested in the 42-county High Plains area in 1950, 1954, and 1959 were 387,000, 11006,000, and 1,224,000
acres, respectively. The irrigated grain sorghum acreage in the eight counties—Castro, Deaf Smith, Floyd, Hale, Lamb, Lubbock, Farmer, and Swisher—represented over 80 percent of the total in the High Plains in 1954 and 1959.
Development • of high-yielding hybrids and a large increase in the number of irrigation wells in the area have been major factors in the three-fold increase in irrigated grain sorghum. The number of wells increased from about 8,000 in 1948 to 45,000 in 1958 and 52,000 in 1963. Ex-pansion since 1959 has been mainly north of the Canadian River.
Ideal topograp.hy. was instrumental in the rapid development of irrigation in the area. It is not uncommon for farmers to irrigate one-half-mile rows without any land smoothing.
The predominant soils in the area, except for Lamb and Lubbock Counties, consist mostly of clay kerns and silty clay loans (10, 16:). The High Plains is perhaps one of the largest irrigated areas having a single predominant soil.
The source of water used for irrigation is an aquifer that underlies most of the area. The
total water supply is extensive, but the rate of recharge by rainfall is very small compared to the current rate of pumping. The pumping lift ranges from about 100 to 400 feet in different areas of the High Plains. The cost of pumping water and the growing awareness that the current pumping rates greatly exceed natural recharge created a need for maximizing economic returns per unit of irrigation water and precipitation.
Without irrigation, inadequate precipitation is the major factor limiting crop production in the area. Under nonirrigated conditions, the common cropping sequences involving grain sorghum are continuous sorghum and sorghum after wheat. Bond and coworkers evaluated the frequency of obtaining various yields of grain sorghum under dryland conditions from 1907 to 1919 and 1943 to 1958 on the "hardland" soils in the Texas High
Plains (1). They found that the yield of con-tinuous grain sorghum was less than 2,000 pounds per acre about 80 percent of the time. With sorghum after wheat (fallow from harvesting of wheat until the next season), the yield was less than 2,000 pounds 70 percent of the time. The yields were less than 800 pounds 20 percent of the
time with continuous sorghum and 15 percent of
the time with sorghum after wheat. Yields exceeded 2,500 pounds about 5 percent of the time with continuous sorghum and about 15 percent of the time with sorghum after wheat. Commercial fertilizers currently are not needed in dryland sorghum production.
ields were doubled or tripled during the first 1 or 2 years of irrigation. -Yields decreased in subsequent years if nitrogen fertilizer was not used. The purpose of this study was to combine moisture and fertilizer levels in an experiment to provide irrigation and fertilizer recommendations for use by irrigation farmers in the area.
STUDY AREA
35°15' N., elevation 3,825 feet). The station is located near the northern edge of the
irrigated
gain
sorghum counties previously.mentioned.
The soil on the experiment station is representa-tive of the irrigated area to
the south as well
asto
Location
The experiment was located on the USDA Southwestern Great Plains Research Center near Bushland, Tex., 14 miles west of Amarillo (latitude
The authors gratefully acknowledge the computer D
services provided by the Data Processing Center, Texu
Ad M University, and the assistance of Frank 0. Wood,
Southwestern Great Plains Research Center, Bushland, Tex.,
in carrying out field operations and processing the volu-minous data.
Italic numbers In parentheses refer to Literature Cited, p. 17.
2
CONSERVATION RESEARCH REPORT 5, U.S. DEPT. OP AGRICULTUREthe irrigated area north of the Canadian River. The Canadian River bisects the High Plains in an east-west direction north of the station.
The soil on the experimental site is Pullman silty clay loam (3, 15). Organic matter content in the 0- to 6-inch depth after several years of tillage ranges from 1.6 to about 2.1 percent, as compared to a native grass site of 2.6 percent. A caliche layer (CaCO) occurs at a depth of 3.5 to 4 feet. The proportion of CaCO, by weight in the caliche layer is as high as 45 percent (15). The soil of a given layer is extremely uniform in physical properties and moisture-holding characteristics for extensive areas.
Bulk density determinations to a depth of 5 feet were made at four locations on the experimental site on September 18, 1956, by the use of two 1.85- by 4-inch cores per foot .of depth. The standard error of the mean of four cores was 0.056, or 3.8 percent of the mean volume weight. These data and soil moisture characteristics are summa-rized in table 1. Field capacity values given are the mean of high values measured 5 to 10 days after a preplanting irrigation. Wilting percent-ages are the mean of low values measured near harvest on the drier plots. These field capacity values would not be the maximum obtainable 1 to 2 days after excessive irrigation. However, they indicate available water-holding capacity under normal irrigation practices. when evapotranspira-tion rates are low. The rate of internal drainage by gr avity on this soil is very slow. Therefore, when evapotranspiration rates are high, the effective available water-holding capacity is greater than the values given in table 1, because
evapotran-TABLE 1.-Soil density and moisture-holding characteristic's, Pullman silty clay loam
Depth increment densityBulk capac-Field ity 1
Wilting
point 1 A veil-able water
inches f3. Joe. Percent Percent incises
0-12_ 1. 38 24. 6 12.6 1. 99
12-24 1. 52 22. 7 13.5 1. 67
24-36 1.52 21.0 13.0 1.46
36-48 1. 50 20. 4 13.6 1.24
48-60 11 1. 40 21.9 $ 13.5 1.41
60-72 1 3 1. 50 19. 9 13. 4 1. 17
Total:
0-48- 6.36
0-72... 8.94
1 On an oven-dry weight basis.
2 Contains as much as 45 percent CaCO, by weight.
4 Estimated.
spiration demands can be met with water that ordinarily drains from the profile in the 5- to 10-day period after irrigation.
Low intake rates on these soils limit the amount of irrigation water that can be applied in 12 to 24 hours to 4 to 5 inches during the growing season. A summary of intake measurements made in an adjacent experiment that uses level basins and tillage practices similar to those used in this ex-periment is presented in table 2. A 4-inch ir-rigation during the growing season requires about 16 to 20 hours to be absorbed. The intake from 0 to 0.33 hour ranges from 1.9 to 2.3 inches, and the intake from 0.33 to 15.33 hours ranges from 1.7 to 2 inches. Intake rates are higher during the preplanting irrigations. Intake rates when large furrows are used between sorghum rows on
TABLE 2.-Average intake rates for preplanting irrigations and cropping season irrigations on grain sorghum with sweep-chisel tillage used during the fallow period, Bushland, Tex., 1967-69
Year Irrigation
Intake rates for time interval after applying water
Weighted
0.33- 0.67- 1.33- 2.00- 2.67- 3.33- 4.67- 7.38- 10.67- average 0.67 1.33 2.00 2.67 3.33 4.67 7.33 10.67 16.33
hour hours hours hours hours hours hours hours hours
Preplant in.*.0.504 in./kr.0.356 In.lhr.0.252 In.*.0.224 1
957_ In.thr.0.216 In.lAr.0.168 In.*.O. 129 in./kr.0.108 In.*.a NO Ini 45wi Average (1 and 2) 1
Average (1 and 2)' . 638 . 279 . 161 . 122 . 140 . 118 . 104 . 083 . 081 . 110
1958_ . 624 . 240 . 108 . 108 . 072 . 120 . 105 .084 . MI . 114
1959- Preplant 1. 104 . 480 . 264 . 120 . 144 . 168 . 162 . 164 . 164 . 242 Average (1 and 2) 1 . 467 . 156 . 108 . 120 . 108 . 120 . 096 . OW . 084 . 128
100
80
cr 60 Q.
0 z 40
u.s IL IL 20
0
EVAPOTRANSPIRATION ETC., WITH IRRIGATED GRAM SORGHUM 3
these soils should be similar, because of rapid lateral water movement in the plow layer and the dense soil below the plow layer that extends to a depth of about 3 feet.
The soil on the experiment site was first
ir-rigated in 1956. Before 1956, the land was (allowed in 1955 with a previous cropping history of a wheat-sorghum-fallow dryland rotation.
Climate
The weather in the Great Plains is noted for its
great variability and rapid changes. Extreme variations in monthly rainfall, daily temperature,
and windspeed are normal expectations, especially during the months of Mardi, April, and May.
Annual precipitation ranges from less than 10 inches to over 30 inches.
A summary of average climatic conditions and the weather conditions existing during this 4-year study is presented in table 3. The probabifities of receiving various amounts of rainfall are illus-trated in figure 1 (5). The pattern of precipitation is similar for much of the area, but more precipi-tation occurs east of Amarillo.
/''
OCT.-MAY J
f
f ANNUAL
JUNE-SEPT.
I
10 20 30 40
PRECIPITATION (INCHES)
Peons 1.-Probability of receiving various amounts of annual, fallow period, and sorghum growing seaman precipitation at Amarillo,' Tex. The curves represent the percentage of time that precipitation can be expected to be lees than the amounts ehown.
50
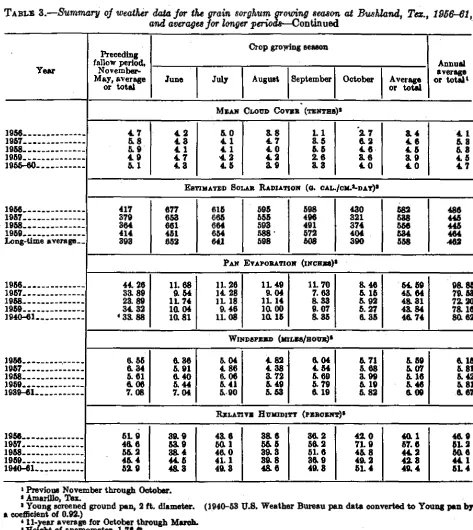
TABLE 3.-Summary of weather data for the grain sorghum growing season at Bushland, Tex., 1956-61, and averages for longer periods
Year
Preceding fallow period,
November-May, average
or total
Crop growing season
Annual average or tot,al l June July August September October Average
or total
PILICIP/TATION (INcioIB)
1956 6.65 1. 10 8. 18 2. 08 O. 12 0.82 6. 75 18.40
1957 & 62 8. 05 1. 70 4. 22 1.05 2.55 12. 57 21, 19
1958 9. 61 L 77 7.79 .58 2.05 . 21 12. 35 21. 96
1959 6.39 2.69 2. 15 2.50 1. 18 2.00 10. 47 16. 86
1939-61 7.20 2.60 2.88 2.51 1. 64 1.87 11.50 18. 70
M AN DAILY MAXIMIIII Ais TEMPZE►TIIRB ('P.)
1956 66.2 92.6 92. 9 91.7 90.2 80. 2 89.5 75.9
1957 63.6 88. 6 96.5 89. 9 83.8 69.9 85. 6 72. 8
1958
1959 59.764.4 89.398.5 91.089.6 92.6911 85. 188.9 78.872. 2 se. 87. 10 78.471.2
1939-61 62.9 89.4 91. 8 90. 5 84.9 74.6 86.1 72.6
M AN DAM' MINIMUM A/E TLLIPBRA.TURB (°P.)
1956 31.0 68.1 66.2 60. 8 55.5 46. 8 57.7 42.2
1957
1958 38.831 9 57.460.4
64.9
64.8 62 862. 0 M. 857.4
44.6
417 56. 257. 5
419 48. 2
1959 30.8 60.2 61. 6 63.5 58.8 89.5 55.7 40.9
1939-61 82. 1 59.5 68.3 62.8 54. 7 44. 1 56. 8 42.4
4
.
CONSERVATION RESEARCH REPORT 6, U.S. DEPT. OF AGRICULTURETABLE 3.-Summary of weather data for the grain sorghum growing season. at Bushland, Tex., 1956-61,
and averages for longer perio&---Continued
Year
Preceding fallow period,
No vember-M ay, average
or total
Crop grovring season
Annual average or total
June July August September October Average
or total
1956 1957 1958 1959 1955-60
1966 1957 1958 1959
Long-time average
MEAN CLOUD Coven (TsztTnar
4.7 6.8 & 9
4.9 5.1
42 4.8 4.1 4.7 4.8
5.0 4.1 41 4. 2 4.5
3.8 4.7 4.0 4.2 8.9
L1 3.5 5.5 2.6 3.3
2.7 6.2 4.6•
8.6 4.0
8.4 4.6 4.5 8.9 4.0
4.1 5. 8 5.8 45 4.7
ESTIMATED SOLAR RADIATION (O. CAL./C14.3-DAT). 417
379 364 414 393
677 658 661 451 652
615 665 664 654 641
595 655 598 588' 598
598 496 491 572 608
430 321 374 404 390
682 588 556 634 558
486 445 445 464
.462
PAN ETAPORAT/ (mom)
1956 44. 26 11. 68 11. 26 H. 49 IL 70 8. 46 54.59 98.85
1957 33.89 9.54 14.28 9.04 7.63 5.15 41 64 79. 53
1958 23.89 1L 74 11. 18 11. 14 8.33 5. 92 48.31 72.20
1959 34. 32 10. 04 9.46 10. 00 9.07 5.27 43.84 78. 16
1940-61 1 33. 88 10.81 11.08 10. 15 8.35 6.35 48. 74 80.62 A
1 WINDSPEND (mmas/Boum)1
1956 6.55 6.86 5.04 4.82 6.04 5. 71 5.59 6.15
1957 6.34 5. 91 4.86 4.38 4.54 5.68 5.07 5.81
1958 5.61 6.40 6.06 3.72 5.69 3.99 5. 16 5.42
1959 6.06 5.44 5.41 5.49 5.79 5. 19 5.46 & 81
1989-61 7.08 7.04 5.•90 5.53 6. 19 5.82 6.09 6.67
Rxi.anvi flumnirr (rneourrr) s
1956 5L 9 39.9 43.6 38. 6 86.2 42.0 40. 1 46.9
1957 46.6 53.9 50. 1 55.5 56.2 71.9 57.6 01.2
1958 55.2 38. 4 46.0 39.8 51. 6 45.8 44.2 50.6
1959 45.4 44.5 41. 1 39.8 89.9 49.2 42. 8 44. 1
1940-61 52.9 48. 8 49. 8 48.6 49. 3 51.4 49.4 51.4
Previous November through October. 1 Amarillo, Tex.
3 Young screened ground pan, 2 ft. diameter. (1940-53 U.8. Weather Bureau pan data converted to Young pan by a coefficient of 0.92.)
+ 11-year average for October through March. + Height of anemometer, 1.75 ft.
EVAPOTRANSPIRATION ETC., WITH IRRIGATED GRAIN SORGHUM
5
PROCEDUREoccurred in the field and some of the variability between blocks. New moisture blocks were installed each summer at depths of 4, 9, 16, 29, and 42 inches in the Fs and Fs fertility subplots of each moisture treatment. Readings were made three times a week during the main part of the crop season.
A summary of dates, depths of water applied, and stage of growth at each irrigation is given in table 10 in the appendix. Water from a well was delivered and measured to each moisture plot by the use of gated aluminum pipe and a flowmeter. A summary of rainfall by storms received during the growing seasons as recorded in a gage near the plots is presented in table 11 in the appendix. The sums of these values by months differ some-what from those presented in table 3 because of location.
Experimental Design
The experimental design was a randomized complete block with split plots. Four replica-tions of six soil moisture levels as complete blocks and six fertilizer treatments as split plots were used. Each moisture level was included in a level basin diked on all sides with level area dimensions of 30 by 265 feet. Depth of irriga-tion water applied was based on dimensions from center to center of the dikes, 33.3 by 168 feet. Fertilizer plots were 15 by 50 feet. The treat,-ments were maintained on the same plots for the four seasons. (Farmers frequently grow sorghum on the same field 3 to 5 years in succession.)
Moisture Levels
A preplanting irrigation was given all moisture treatments each year several weeks before plant-ing to wet the soil to a depth of about 6 feet. Moisturelevels are described below.
Moisture Joel Preplanting irrigation only
One 4-inch irrigation 1 week prior to boot stage.
Ms Irrigated when the weighted mean soil moisture tension approached 9 atmos-pheres.
Irrigated when the weighted mean soil moisture tension approached 4 atmos-pheres.
Irrigated when the weighted mean soli moisture tension approached 1)4 at-mospheres.
M4 Irrigated the same as Ms, for the first
irrigation, and irrigated the second time before the soil moisture tension ap-proached 4 atmospheres in 1957, 1958, and 1959. Irrigated the same as 1111 in
1956, except the third irrigation was not given.
The
inedweig hted mean soil moisture tension wasi hti quarters of the moisture depletion zone by 4, 3, 2, and I. The weighting procedure was based on typical soil moisture extrac
t
ion patterns. Son moisture tension was measured indirectly by cured plaster of paris moisture blocks (S) calibrated in a pressure membrane apparatus. Calibration con-sisted of placing six blocks selected at random in a special-built pressure membrane apparatus wit
cm. of soil above and below the block. Ind vidual leads for each block in the pressure mem-brans were used. The calibration curve was adjusted to 70° F. and used without further correction. The curing process consisted of at
least two 24-hour soaking and drying cycles. The standard deviation of the resistance of individual cured blocks immersed tapwater was about 25 ohms. The curing process removed most of the drift in calibration that nop;ofilly would have
Fertilizer Treatments
Nitrogen in the form of ammonium sulfate (20.6 percent N) and phosphorus in the form of concentrated superphosphate (45 percent P.O.) were used at the rates given below each year. except in 1957. No fertilizer was applied in 1957, because response to applied fertilizer did not occur in 1956, the first year of irrigation.
Phoophone
(45 Percent
Nitrogen Ps0s)
Fertiliser treatment No. (Lb./acre) (Lb./acre) F
F.
78 Fi
Fs Fs
In 1956, nitrogen was broadcast on the surface of the soil and worked into the top 2% inches of soil. In 1956, phosphorus placed with the seed restricted the germination to some extent, owing to limited soil moisture conditions. Consequently, all plots were irrigated on June 26 and June 27 to improve the stand. In 1958 and 1959 nitrogen was broadcast just ahead of each furrow opener and phosphorus placed ahead of the press wheel following the furrow opener (just above the seed).
Cultural Practices
Tillage
In 1956 and 1957 the plots were sweep-plowed to a depth of 6 to 8 inches after harvest. Other tillage operations varied from year to year accord-ing weed and volunteer sorghum growth. After the preplanting irrigation, usually given early in June or late in May, the plots were sweep-plowed to a depth of 2 to 3 inches and
Coda No.
Ms
bta
o y wegn tensions in successive
240 0
BO so°
120 soso
240
6 CONSERVATION RESEARCH REPORT 5, U.B. DEPT. OF AGRICI7LTURII
spike-tooth harrowed prior to planting to control volunteer sorghum growth and prevent large drying cracks.
Seeding and Harvesting
Plots were planted each year with RS-610 hybrid grain sorghum in rows 20 inches apart. Planting date, rate, and harvest dates were as follows:
Ranting rats
Date of planting (Lb.laere) Harvest dates 1956—June 13-14 15 Oct. 4-Nov. 2
1957—June 22 11 Oct. 29-80
1958—June 16-17 18 Oct. 6-16 1959—June 17-18 6 Oct. 10-28
The rate of planting used in 1959 was considered to be the minimum for maximum yields based on other studies (18).
Yield Determination and Disposal of Crop Residue
Yields were determined by hand-cutting heads, which were dried and threshed at a later date, except in 1956. In 1956, 4 rows, 40 feet long, were harvested from each subplot with a small self-propelled combine. In 1957, 1958, and 1959,
4 rows, 25 feet long were hand-harvested. After
hand-harvesting to determine yields, the rest of the plot area was harvested with a combine. Each year the residue was returned to the indi-vidual plots, except in 1957. In 1957, an offset combine was used that de posited the threshed stalk to the side of the plot. The stubble re-mainin* after harvest was shredded either in the fall or m the spring and disked into the surface.
Evapotranspiration Determinations
Evapotranspiration (Es) was determined from soil samples taken p_eriodically to depths of 4 or
6 feet on the F,, F`, and 111, subplots of each moisture level. Samples were taken by hand in 1956, partially by machine in 1957, and by machine in 1958 and 1959 (9).
Soil sampling sites were marked so that succes-sive cores could be taken about 1 foot or less from the preceding location moving in the same direc-tion each time. After removing the core, the hole was filled with surface soil and tamped. Because of the low intake rates and limited depths of water
applied, the rate of E, during an irrigation period
to the date of sampling after an irrigation) was calculated as follows:
(from the date of sampling prior to an irrigation
halm+ (Irrigation and rainfall)—Inehesy
Days between sampling dates Inches per day
where inchesi and inches, represent the total water in the profile before and after irrigating. The depth of irrigation water applied was gener-ally less than the amount required to bring the soil to field capacity with the exception of the first irrigation in 19561 which was applied to improve the germination and uniformity of stand.
Values obtained by this procedure for the irri-gation period usually were somewhat larger than those obtained between sampling dates after an irrigation. This method of calculation for the irrigation period assumes that each subplot re- . ceives the same depth of water and no deep percolation occurs. Small differences in intake between fertilizer subplots due to small differences in soil moisture content may have occurred from 1957 through 1959. The 1959 seasonal total E, was from the first to the last sampling date t• for the other years an adjustment was made back to the date of planting.
Other Measurements
Nitrogen content of the grain was determined
each year from 1956 through 1958 and in 1960. The percentage of protein .was obtained by using a constant ratio between nitrogen content and protein content. Detailed evaluation of total nitrogen uptake on three moisture levels with four rates of nitrogen was carried out in 1957 and 1958. The results of the nitrogen study have been pre-viously published (11). Height determinations were made with a surveyor's rod, and the average height of the grain sorghum was observed at full growth. The relative date of heading was deter-mined when the earliest plots were blooming. A numerical rating was used as follows: (1) late boot stage, (2) beginning to head s (3) partially headed, and (4) headed and blooming. The number of heads per unit area was determined as the plots were hand-harvested. Test weight of the grain was determined by standard volumetric and weighing procedures.
RESULTS AND DISCUSSION Evapotranspiration
The High Plains is not a large homogeneous irrigated area. Irrigated fields are intermixed with rangeland and nonirrigated farmland. The total acreage of irrigated crops in 1954 other than
EVAPOTRANSPIRATION ETC., WITH IRRIGATED GRAIN SORGHUM 7
of the land area. Thus, even during the summer season, about two-thirds of the area is nonirri-gated. Evapotranspiration determinations made in this 2.8-acre site surrounded by irrigated and nonirrigated land should be representative of irrigated fields surrounded by nonirrigated land in the area.
Seasonal Evapotransp iration
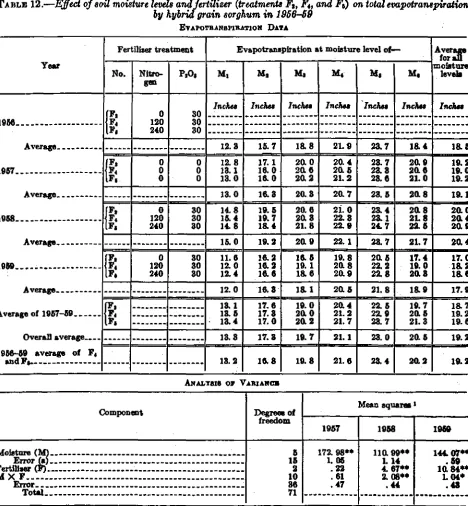
A detailed summary of seasonal evapotranspira-tion (Es) and analysis of variance for three fertility subplots on each moisture level are presented in table 12 in the appendix. Some of these data have been summarized and published earlier (8, 7, 8).
The largest yields and the highest water use efficiency were obtained on the moisture level. Therefore, the M, moisture level will be referred to as the optimum moisture level in the rest of this report. Cumulative E. averaged for the F, and F4fertilizer plots in 1957-59 and all fertilizer treatments in 1956 on the M, moisture level is resented in figure 2. The 4-year average seasonal
E, was about 22 inches.
n
I
• MSG • 1447 • ISIS n I155
a . s
x
i ••
* • .
•
• •
JULY AUGUST 50,70.11111 OGTOSIR
Fiona' 2.—Cumulative evapotranspiration for grain sorghum at Bushland, Tex., with optimum soil moisture conditions (Mi moisture level).
Climatic conditions during the 1956 growing season were nearly normal except in September and October, when solar radiation and air tem-perature were above normal and rainfall was below normal. Cumulative E, in 1956 closely followed the 4-year mean except in September, when it exceeded the mean. The total 1956 seasonal E. probably would have been higher if an additional irrigation had been given in Septem-ber. With below-normal rainfall in September and October, most of the available soil moisture was depleted by early October.
Low cumulative He in 1957 was a result of
below-normal solar radiation and air temperatures,
771-lea 0-44----4
especially in October. Solar radiation and air temperature were above normal in July 1957; however, the planting. date was about a week
later than at-erage, wnich apparently resulted in below-normal cumulative E, that month.
In 1958 heavy July rainfall (7.79 inches) may have caused some deep percolation beyond the soil sampling zone. Soil moisture in mid-July was greater m the 4- to 5-foot and 5- to 6-foot depths than that at corresponding depths on June 23. Also evaporation losses from the soil surface may have been above normal in July because of frequent rains.
Use of nitrogen fertilizer increased yields sub-stantially but had little influence on the seasonal
E, (appendix table 12). For example., with the
144moisture level, the 3-year average yield
(1957-59) was 194 percent greater on the highest nitrogen treatment than on the 0-nitrogen treatment, but the average seasonal E, was only 6.2 percent greater. In 1959, with a lower yield on the
0-nitrogen treatment., the yield was 262 percent
urger on the high-nitrogen treatment. The larger yield in 1959 was obtained with an increase of only 5.7 percent in A. There was no signifi-cant difference in E. between the 120- and 240-lb. N rate. Similar results have been reported for other areas (18).
During August, grain sorghum can be considered as having adequate evaporation and transpiring surfaces so as not to limit El. Consequently, an
estimate of mean evaporative demand or potential
E, should be approximately the same as the mean
E, determined on the M4 moisture level during this period. Potential E, as used here refers to evap-orative demand in irrigated fields located in arid and semiarid areas. The 4-year average E, for August was 8.6 inches (fig. 2). The average total radiation for August was 583 calories per square centimeter per day, which would be equivalent to the energy required to evaporate about 0.389 inch per day. The mean air temperature was 76.9° F. Jensen and Heise (4) obtained the equation Esio
(0.14T-0.37)R, for estimating potential E, by correlating measured E. from crops other than grain sorghum with solar radiation and mean air temperature. T is the mean air temperature in degrees Fahrenheit, R, is solar radiation. expressed as evaporation equivalent, and E . is estimated potential evapotranspiration. With this equation the estimated mean potential E,
during August at Amarillo is 8.5 inches.
Rate of Evapotranspiration
The average rate of evapotranspiration for sampling periods on the Mt moisture level for the
i
4 years is presented in figure 3 along with estimated mean potential E,. Estimated mean evaporative demand or potential Eels high in June and July up to about the first part of August, then it begins to
0
5
4
0.40
7-*
zui0.30
7
O.20
CONSERVATION RESEARCH REPORT 5, U.S. DEPT. OP AGRICULTURE
I MEAN POTENTIAL ET
\I- ._• t. • 1151
0 11117 i MOO a 1559
• • •
•
• t
•
E
N. \
• \ e‘
....
LILT AVOCIST SEPTEm•EN OOTOSER
Fianna 3.—Rate of evapotranspiration (E,) for grain sor-ghum at Bushland, Tex., with optimum soil moisture conditions and estimated mean potential 111.
decrease. The E1 rate was much less than the potential in June and early July because of limited transpiring surface area. As transpiring surface area increased in July, the mean E1 rate increased rapidly until the potential rate was reached during the first few days in August. The decrease in mean E, rats during August follows the decrease in potential E,. The effects of crop maturation and lower soil moisture levels appear to have reduced
E, below the potential during the latter part of September and in October. The mean rate of evapotranspiration shown in figure 3 should be applicable to irrigated fields in the area planted to grain sorghum about June 15. For sorghums planted 2 or 3 weeks earlier, the peak rate of Es
will be reached about 10 days earlier.
A summary of total water in the 0- to 4-foot depth for all moisture levels by sampling dates is presented in table 13 in the aTpendix. These values are the average of the F4 and F. plots. Total water in the 4- to 6-foot depth increment is presented in table 14. Soil moisture extraction from the 4- to 6-foot depth was small except on the dry treatments. Therefore, this depth was not sampled each time the 0- to 4-foot depth was sampled.
Grain Yield
Grain yields for each combination of moisture level and fertilizer treatment and a summary of the analysis of variance are presented in table 4. Yields were greatly affected by nitrogen fertilizer, especially_ where soil moisture did not restrict yields. No significant response to phosphorus occurred in the 4 years, with average yields of the same treatment as high as 7,200 lb./acre.
Nitropn fertilizer did not increase yields in 1956. Yields ranged from less than 1,000 lb./acre
with a preplanting irrigation only to over 6,000 lb./acre on the M4 moisture level plots. Severel lodging occurred on the M. and M. moisture levels (hie to charcoal rot (Macrophom(na phaseoh).
Moderate liidging occurred on the M1 and M. and some lodging occurred on the M, plots. Lodging was more severe on the plots fertilized at the 240
-lb./acre nitrogen rate. The
MI moisture level plots had very little lodging.
A response to nitrogen applied in 1956 occurred on the higher soil moisture levels in 1957. The yield without applied nitrogen was less on the optimum moisture level than on the medium level, apparently because about 1,600 lb./acre more gram was produced on this treatment in 1956. The M, moisture level plots lodged, and some lodging occurred on the M, level.
In 1958, the third year of irrigation, yields dropped about 50 percent without nitrogen fertilizer on the medium and optimum soil moisture levels. With a preplanting irrigation only, the yield was largest without applied nitrogen.
In 1959, the fourth year of irrigation, yield without applied nitrogen decreased to about
3,000 lb./acre on the optimum soil moisture level. The largest increase in yield occurred with the first increment of nitrogen (60 lb./acre) applied in 1956, 1958, and 1959.
The 4-year average yield with a preplanting irrigation only was about 2,500 lb./acre. On this treatment a slight response to applied nitrogen occurred in 1969. Similar results were obtained on the M5 moisture level (preplanting plus one seasonal irrigation), except a substantial response to nitrogen fertilizer occurred during the fourth year. In this case, the 4-year average yield with-out applied nitrogen was abwith-out 4,080 lb./acre, whereas the average yield with applied nitrogen was about 4,400. Most of this difference occurred in 1959. In 1959, the plots without applied nitro-gen yielded only about 3,300 lb./acre compared with the fertilized plots that yielded as high as 4,590 lb/acre.
On adequately fertilized plots of the medium moisture level (M3), which averaged about 5,800 lb./acre, a response to residual nitrogen occurred during the second year under irrigation. By the fourth year, yields increased from 3,200 to 5,700 lb. acre with applied nitrogen. These results indicate that when irrigating for a ykeld potential of 6,000 lb./acre, no nitrogen fertilizer may be necessary the first 2 years this soil is irrigated but about 60 lb. of N will be needed the third year and between 60 and 120 lb. the fourth year. With average yields of 7,000 to 7,500 lb./acre, a response to nitrogen occurred during the second year under irrigation. By the fourth year, nitro-gen increased yields from about 3,000 to 7,800 lb. per acre. Continuous production of 7,000 lb.
per acre, or more, would require at least 120 pounds or more of nitrogen annually.
9
EVAPOTRANSPIRATION ETC., WITH IRRIGATED GRAIN SORGHUMF, F, F, Fs F, 1959
TABLE 4.-Effect of soil moisture and fertilizer treatments on the yield of hybrid grain sorghum for 1956-49,
Bushland, Tex.
YIRLD DATA
ANALYSE! OF VARIANCE
Component Degrees of
freedom
Mean square. 1
1956 1957 1958 1959
Moisture (7‘) Error (a) Fertiliser (2) 5 15 a 111, 257, 683, 342, 911** 801 250 39,197, 504, 5, 838, 156** 222 120** 52, 17, 408, 258, 854, 100** 600 600** 35, 30, 658, 326, 267, 200** 800 400** M X F
Error (b) Total_ 25 90 143 229,
306,627509 258,794,681**694 2, 173,246,800**591 2, 168,195,700**171
** Significant at the ]-percent
treatment Yields at moisture level of- Average
for aR
moisture levels
Nitro-gee P,O, M,
M4 Ms Lb./acre 240
s
60 120 240 240 L6.1acre 0 80 30 30 30 60 Lbjecre 633 780 646 703 817 829 L5./acre 2, 161 1,924 2, 214 2, 026 2,030 2, 108 Lb./aere 4, 992 4, 865 5, 176 4.898 4, 158 4, 477 Lb.lacre 6, 704 6, 462 6, 213 6, 888 6, 450 6, 571 Lb.f acre 5, 433 5, 241 5, 870 5, 286 6,266 4, 947 Lb.lacre 4, 379 8, 590 3, 909 4, 134 3,942 8, 958 Lb.lacre 4, 050 3, 810 4, 004 3, 989 3,777 8, 815735 2, 077 4, 761 6, 548 5,840 3, 985 3, 908
0 0 3, 436 6, 193 6, 735 7, 648 7, 780 6,964 6,459
0 0 3, 319 5, 860 5, 762 5, 220 5, 830 6, 388 5, 309
0 0 0 0 0 0 0 0 3, 541 3, 697 3, 770 3, 567 5,765 5, 762 6, 030 6, 056 6, 6, 6, 7, 167 755 605 023
6, 539 6, 755 7, 499 7, 434 5, 808 6, 716 7,687 7,904 6, 213 6,526 7,180 6, 988 5, 670 6,035 6, 450 6, 494
3, 555 5, 942 6, 508 6, 848 6, 862 6,701 8,069
240 0 2, 058 4, 886 6, 128 7, 258 6, 924 8, 657 5, 652
30 2, 979 6, 226 3, 554 3, 442 3, 325 3, 848 3, 729
60 30 2, 718 5, 500 5, 925 6, 448 5, 938 6,350 5,480
120 30 2, 626 5, 089 8, 212 6, 964 8, 781 6,317 5, 665
240 30 2, 430 5, 258 6, 219 7, 232 7, 075 6, 650 5, 811
240 60 2, 118 6, 528 6, 678 7, 492 7, 029 6, 748 5, 915
2, 488 5, 248 5, 769 6, 473 6, 179 6, 095 5, 375
240 0 3,412 4,176 5, 254 7, 215 7, 770 6, 019 5, 841
30 2, 803 3, 320 3, 215 2, 980 2, 947 2,521 2,964
60 30 3, 300 4, 274 • 5, 058 5, 882 6, 692 6, 156 5, 080
120 30 3, 392 4, 496 5, 777 7, 148 7, 117 5, 934 5, 843
240 30 3, 281 4, 588 5, 718 7, 822 7, 698 5,967 5,846
240 60 3, 634 • 4, 921 5, 535 6, 934 7, 555 6, 810 5, 898
3, 304 4, 296 5, 093 6, 329 6, 463 5, 568 5,175
2, 385 4, 354 5, 777 7, 205 6, 977 6, 005 5, 450 2, 470 4, 082 4, 349 4, 526 4, 211 4, 080 3, 958 2, 551 4, 436 6, 582 6, 270 5, 827, 5, 657 5, 054 2, 604 4, 343 5, 910 6, 938 8, 475 5, 728 5, 333 2, 574 4, 476 5, 675 7, 251 6, 919 6, 930 5, 471 2, 536 4, 653 5, 903 7, 108 6, 894 8, 125 5, 530
2, 520 4, 891 5, 683 6, 550 6, 211 5,587 5,132
Component Degrees of Mean squares freedom
Moisture r Error (a Fertiliser
M X F Error (b)
Total
a 15 5 25 90 143
8, 070,671** 469, 260 43, 551, 814 0.
1, 039, 16640 329,169
10
CONSERVATION RESEARCH REPORT 5, V.S. DEPT. OF AGRICULTURETABLE 5.-Eject of residual nitrogen and previous moisture levels on yield of hybrid grain sorghum in1960
YIELD DATA
No. Nitrogen PA lira
Lb./acre Lb./acre Lb./ acre
240
0 800 6, 4865, 220
60 80 6, 519
F4 120 30 6, 767
Fl- 240 30 7,386
y.- 240 60 7, 654
Average.. 6, 672
Fertiliser treatment' Yields at moisture treatment' of
Nis
Lb./acre
8, 878 4,026 5,031 5,174 6, 584 7,047 5, 790
Ida
Lb./acre
6, 825
3,854 , 3 967 4,940
7, 478 7, 360
5, 654 Mg
Lb./acre
6, 480 3,276 4,006 4,561 6, 741 5,938 5,167
Lb./acre
6, 506 8, 132 3,576 4,372 6, 297 6,584 5, 078
Average for all
moisture
levels
Lb./acre Lb./aers
6, 591 6, 628 8, 622 3, 772 4,144 4, 541 4, 638 5, 076 7, 398 6, 980 6, 065 6,778 5, 406 5, 628
ANALYSIS or VARIANCE
Applied in 1956, 1958, 1959.
a 1956, 1957, 1958, 1959; adequate moisture supply in 1960. $ **-Significant at the 1-percent level.
The results of this study illustrated the primary interaction between nitrogen and soil moisture levels; i.e., when available soil moisture limited production, applied nitrogen requirements were reduced, and when soil moisture was not the limiting factor, applied nitrogen requirements were greater to obtain good yields. Also/ when sufficient water was applied for average yields of about 7,000 lb./acre, the production without nitro-gen fertilizer decreased the second year this soil was irrigated and continued to decrease as the reserve of available N was depleted.
In 1960, the experimental site was irrigated uniformly to evaluate the effects of residual nitro-gen and previous moisture levels on yield (table 5). The 1960 yields on the F,, F„ and F4
treat-ments were inversely related to amount of irriga-tion water and directly related to the amount of nitrogen applied during the previous 4 years. Nonificant yield response to phosphorus occurred.
Yield of grain sorghum was not materially affected by soil moisture level if the average available soil moisture in the 0- to 4-foot depth just prior to irrigations was more than 30 percent Yields from the Fs fertilizer treatment (and F4
if the yield on the F4 was not more than 2 or 8
percent less than the F, yield) on the MI, M„ and M, moisture levels were used to evaluate this
effect (fig. 4). The curve in figure 4 was fitted
by eye. Yields were •greatly reduced when the average available soil moisture level was less than
25 percent before irrigations. A similar pattern
of reduction in yield as influenced by the soil moisture level reached prior to irrigation was observed by Musick, Grimes, and Herron on
Richfield soil at Garden City, Kans. (11).
EN
n
NMI=
111111M1=i1111
MOM MI
1112111111111111111
Ell
III
111111111111
SO 40 SO SOAVAILARLS SOIL MOISTURE (PERCENT)
Ficrulz 4.-Available soil moisture in the 0- to 4-foot depth prior to irrigations can be depleted to an average of SO
• 1956 • 19 57 x 1950
n 1959
n 0
1:1 LINE
x % I
• •
a r
1.0
EVAPOTRANSPIRATION ETC., WITH IRRIGATED GRAIN SORGHUM
11
The soil moisture extraction pattern was evalu-ated during sampling periods when little or no rainfall occurred. The results indicated that as the season progresses from July 15 to September 15, the percentage of soil moisture obtained from the top foot during a sampling period decreased from about 50 to 35 percent. The percentage of
i extraction from the other depths to 4 feet n-creased during this period.
Delaying irrigations until small amounts of available water remained in the upper layers of soil decreased total seasonal E1 but yields de-creased by a greater proportion. This relation was evaluated by considering the average seasonal
E, on the F4 and F. fertilizer plots of the M4
moisture level as E. with optimum soil moisture (E,J. The yield on the F. fertilizer treatment on the M1 moisture level was used as the maximum
(Y....). The datapresented in figure 5 are mean relative yields (Y/Y..„) on F. and F. fertilizer plots and meanrelative E,(E.IE,.) where adequate nitrogen appeared to havebeen provided. Since the time of occurrence of low moisture conditions on different treatments was not always at the same stage of growth even within one year, some scatter of points is to be expected. However, the general trend indicated yields decreased more rapidly than E. For example, if irrigations were delayed, causing a 10-percent reduction in seasonal E,,
yields were reduced about 20 percent. Likewise, a 20-percent reduction in E, reduced yields about 35 percent. The same type of relation would not necessarily occur if yields included total dry matter.
produced.
0.2 04 06 0.8 1.0
RELATIVE ET ( Er/Er wax )
Pion= 5.—Relative yield decreased more rapidly than relative seasonal evapotranspiration when irrigations were delayed.
Larger yields on the nitrogen-fertilized subplots in 1957-59 resulted in lower average soil moisture than on the 0-nitrogen subplote. The mean soil moisture percentages for sampling periods from July 15 to September 15 for each depth are pre-sented in table 15 in the appendix. These values are averages of 64 to 112 soil samples. Average values cannot be used to compare mole-tura levels directly, because different sampling dates were involved. Differences in mean soil moisture in the 0- to 4-foot depth between the Fs plot and the average _of F. and F. plots are plotted in figure 6 against differences in yield between the
two.
These results indicate that if large yield or plant-growth differences are expected between treatments and if soil moisture level is an impor-tant factor, experiments should not be designed with subplot treatments having large yield or plant-growth differences. The mean soil moisture percentage on the nitrogen-fertilised plots aver-aged 0.9 percent (on an oven-dry weight basis) less than the 0-nitrogen plots when yields on the nitrogen-fertilised plots were 4,000 lb./acre greater. This difference represents about 10 cent of the total available soil moisture. The difference in soil moisture tension in the upm soil layers just before irrigating may have reached several atmospheres, especially on treatments where the soil moisture tension was allowed to
reach 4 or 9 atmospheres before irrigating.
Grain Quality
Soil moisture and nitrogen fertilizer affected the quality of the grain as well as the _yield. Test weight and protein content were used to evaluate quality.
Test Weight
A summary of test weights for all soil moisture and fertilizer treatments and an analysis of vari-ance are presented in table 16 in the appendix. The low 4-year average test weights on the Mi moisture level were due primarily to greater lodging in 1958 as rate of applied nitrogen increased.
The low values on the Ali treatment were duo
primarily to lodging in 1956. Lodging and low
test weights appeared to have been more severs when soil moisture was adequate early in the season but deficient during the latter part of the season.
Protein
0
12
CONSERVATION RESEARCH REPORT 5, U.S. DEPT. OF AGRICULTUREW sr
w
LL. LA.
o
—22
o
+2000
+4000
+6000
MEAN DIFFERENCE IN YIELD (LB./ACRE)
Flame 6.—Mean soil moisture content was lower on the nitrogen-fertilised plots than on the Fp plots when large differences in yields occurred.
• 1956
o 1957
x 1958
a I 9 5 9
A = 0.294 - 0.000279Y
A. = 0.75**0.73'x*
N = 32
n
••
o •
o
•
o
o 0 0 x x
x
x
A
A
—1000
table 17). In 1956, the protein content averaged 15.3, 14.0, 13.4, 11.3, 12.1 : and 14.3 percent for progressively increasing moisture treatments. In-dividual fertilizer treatments were not analyzed in 1956.
In 1957, protein content on the M 1 moisture
level averaged 11.65 percent as compared with 8.30 and 8.18 percent on the bils and Ms levels,
respectively. The 2-year average yields (1956 and 1957) on these treatments were 2,159, 5,548, and 5,894 lb /acre, respectively. The weighted mean protein content for 1957 and 1958 was about 11 percent with average yields of about 3,000 lb. weighted mean =sum of yield x protein content for each year/total 2-year yield). With larger yields on higher moisture levels, protein content was lower.
With average yields of about 5,000 lb./acre, protein content averaged 6.8 percent on the 0-nitrogen plots. With 240 lb./acre of nitrogen applied in 1956 and 1958, protein content averaged only 8.5 percent when yields averaged 6,400 lb./
acre. Thus, protein content was maintained to a certain extent when nitrogen applications exceeded that needed for yield.
Other Crop Characteristics
Plant Height
The height of the sorghum increased with the first two increments of applied nitrogen in 1958 but decreased slightly at the highest rate. Very little difference between nitrogen rates occurred in 1957 and 1959 (table 6). Low soil moisture during the late boot stage reduced plant height. The shortest plants were on the M1 moisture level.
Heading Dates
EVAPOTRANSPIRATIONETC.,
will
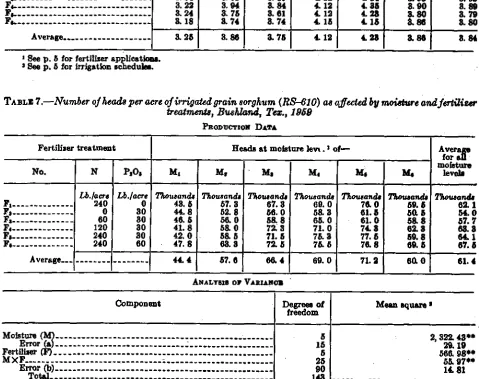
IRRIGATED GRAIN SORGHUM 13 Heads per Acre and Weight per HeadThe number of heads per acre and weight per head were primary components of large variations in yields in 1959. The lower yield on the low moisture levels was a result of fewer and smaller heads as compared to the higher moisture levels
(tables 7 and 8). Nitrogen fertilizer increased the
weight per head over the 0-nitrogen plot on the
medium and optimum moisture levels (table 8). However, there was only a small difference in head weights between the 00-, 120-, and 240-1b./acre nitrogen application rates. Therefore, large dif-ferences in yield between these treatments were due primarily to the number of heads per acre.
TABLE 6.-Average height of irrigated grain sorghum in 1957, 1958, and 1959, Bushland, Tex.
Fertiliser No.1 Height at moisture level of- Averagefor all
moisture
MI 1. levels
ri.
Ft. Ft. lg.FI 3.14 3.85 8.67 4. 15 4.29 3.89 & 83
3.38 3.98 3.76 3.98 4. 10 3.76 3.81
Fa_ 8.34 8. 95 & 89 4.22 4. 24 8.95 3.93
Fa 3.22 3.94 3.84 4. 12 4.85 3.90 3.89
F.. 3.24 3. 75 8.61 4. 12 4.28 3.80 3. 79
Fk & 18 8.74 3. 74 4. 15 4.15 8.8e 8.80
Average. 3.25 8.86 3.75 4. 12 4.23 3.86 3. 84
See p. 5 for fertiliser applications. 3 See p. 5 for irrigation schedules.
TABLE 7.-Number of heads per acre of irrigated grain sorghum (RS-610) as affected by moisture and fertiliser treatments, Buehiand, Tex., 1959
PRODUCTION DATA
Fertiliser treatment Heads at moisture levy . 3 o Average
for all moisture
levels
No. N 13,0s M, Me
Lbjacrs Lb.lacre Thousands Thousands Thousands Thousands Thousands Thousa
Fl 240 0 43.6 57. 3 67. 8 69. 0 76. 0 59. 5 ands2. 1
F, 0
60 8030 44.46. 85 52. 856. 0 58. 856. 0 65.. 5. 03 61.561. 0 50. 558. 54.057. 7
74 120 30 41. 8 58.0 72. 3 71. 0 74. 3 62. 3 63. 8
F. 240 30 42. 0 5& 5 71. 5 75.3 77.5 59. 8 64. 1
Iro 240 60 47. 8 68.3 72. 5 75.5 76.8 69.5 67.5
Average_ 44.4 57. 6 66`4 69. 0 71. 2 60.0 61. 4
ANALYSIS OF VABIANON
Component Degrees of Mean square'
freedom
Moisture (M) 5 2, 322. 43**
Error (a) 15 19
Fertiliser (F) 5 566. 98"
M X F 25 55.97"
Error () 90 14.81
Total 143
CONSERVATION RESEARCH REPORT 5, D.8. DEPT. OF AGRICULTURE
TA BLIC 8.—Weight per head of irrigated grain sorghum as affected by moisture and fertilizer treatments,
Busidand, Tex., 1950
PRODUCTION DATA
Fertiliser treatment Head weight at moisture treatment 1 of Average for all moisture
No. N m, MI li Ms Me levels
Lb./acre Lb.lacre Lb. Lb. Lb. Lb. Lb. Lb. Lb.
FI Ft Fi
F.
240
eo
120
0 30 30 30
0. 104 . 083 . 098 . 101
O. 110 . 093 . 115 . 112
O. 113 . ore . 125
. 117 0. 14
. 0764 . 134 .141
O. 148 . 073 . 138 . 135
O. 145 . 086 . 142 . 139
0. 127 . 082 . 124 . 124 F4
FS
240
240 3060 . 106.102 . 111. . 110. 114 . 142.133 . 140. 141 . 141.131 .125.120
Average.. 099 . 107 . 111 .128 .128 . 131 . 117
ANALTBIR OF VA./11AM.
Mean squati* Degrees
of freedom Component
5 15 a
25
go 143
0.004858** 000108
007082"
. 000416 .000057* Moisture (M)
Error (a) Fertiliser (F)
M X F Error (b)
Total
1 See p. 5 for irrigation schedule.
**= Significant at the 1-percent level
Water Use EiRciency
Water use efficiency, expressed in units of marketable products per unit of water evaporated and transpired during the growing season, is frequently used to evaluate water management practices. The term indicates the relative effec-tiveness of agronomic and irrigation practices in
maximum utilization of water supplies. Water use efficiencies for the 4 years are summarized in table 19 in the appendix.
Fertilizer Effects
Fertilizers are extremely important when at-tempting to obtain maximum production per unit of water. The effect of both soil moisture and nitrogen on water use efficiency after 4 years of irrigation is shown by data for /959 (table 19). With low moisture levels, nitrogen did not increase water use efficiency greatly. When soil moisture was not limiting, nitrogen fertilizer more than doubled the production of grain per unit of water. The large difference in water use efficiency was due to the use of nitrogen, which more than doubled grain yields but increased seasonal evapotranspira-tion less than 10 percent.
Annual Variations
in
a dry year such as 1956, water use efficiency with limited irrigations was low t but in the years of normal or above normal well-distributed prec*-tation, relatively high water use efficiency was alsoobtained with limited irrigation treatments. In contrast, medium to optimum soil moisture and adequate nitrogen fertility resulted in high water
use efficiencies in seasons with below normal, normal, and above normal precipitation.
irrigation Water Use Efficiency.
Irrigation water use efficiency was evaluated by considering yield increases over nonirrigated crop yields per unit of irrigation water applied prior to planting and during the growing season. The 4-y ear average production of grain per acre-inch of irrigation water applied is presented in table 9.
The highest 4-year average irrigation water use efficiency occurred on the optimum soil moisture level. With the irrigation practices used in this study—that is, a preplantinurrigation plus two or
EVAPOTRANSPIRATION ETC., WITH IRRIGATED GRAIN SORGHUM
15
k
TABLE 9.—Eject of soil moisture level and nitrogen on the production of grain sorghum per unit of irrigation water applied annually, Bushland, Tex.'Fertilizer treatment Increase at moisture level of- Average
for
moisture
levels
No. Ms M4 Me
Fs Fs Fs
Averages
Lb.I acre-inch
208 230 226
Lb.! acre-inch
288 314 328
16.1 acre-inch
226 340 328
Lb./ acre-inch
222 360 379
Lb.! acre-inch
178 308 334
acre-inch
• 207 330 346
Le.1
acre-inch
220 314 322
221 805 321 272 295 286
Based on the increase in yield over dryland yields of the same hybrid in 1957-59 and Early Heger! In 1956.
Fallow Period Irrigations
Irrigation before planting is practiced in the High Plains to assure a stand, to maintain growth until irrigation furrows can be made, and to germinate grain not removed during harvest. Ir-rigation of wheat is generally not economical after May 20, as yields will not be materially affected. Thus the irrigation wells can be used for preplant-ing irrigations for grain sorghum several weeks prior to the optimum time to plant. Also, because of the low intake rates, a preplanting irrigation is often made to store water in the 3- to 5-foot depth of the soil profile. Storing water in the 3- to 5-foot depth allows the farmer to irrigate more acres with a given water supply. If irrigations are made only after planting, the demand for water may be greater than the capacity of the wells when E, rates are high. Without water storage in the 3- to 5-foot depth, severe reductions in yield can occur.
Storage of rainfall during the fallow period is usually 15 to 20 percent of the offseason precipita-tion with dryland farming. About 25 percent of the total precipitation at Amarillo comes from storms bringing less than 0.25 inch each. Nearly TO percent of the precipitation comes from storms bringing less than 1 inch each (5). With these light showers, penetration into the fine-textured soil is limited and evaporation losses are high.
Storage efficiency of precipitation plus irrigation water applied offseason was also low. The 3-year average fallow season precipitation was 11.18 inches on the M, plots and 10.95 on the M, plots. However, because of high evaporation losses, preplanting irrigations were necessary to wet the soil to a depth of 6 feet. The average depth of preplanting irrigation was 5.5 and 5.2 inches for a total of 16.7 and 16.1 inches of pre-cipitation plus irrigation water on the A and M moisture levels, respectively. The average net gain in soil moisture from harvest to planting was 5.5 and 4.2 inches. Thus, the efficiency of storing precipitation plus irrigation water was
33 percent on the M, plots and 26 percent on the M. plots. This loss of water, primarily by evaporation,was approximately one-half the amount required to grow a crop of winter wheat during the same period. The total depth of water evaporated and transpired annually on the grain sorghum plots with optimum soil moisture was about 34 inches.
Irrigation Water Management
Irrigation water management practices for grain sorghum will vary with each farm unit, depending upon the crops grown, available water supply, general level of production desired, and facilities and labor for irrigating. Some general
irrigation guidelines can be derived from the results of this study.
Preplanting Irrigations
Under normal climatic conditions and recom-mended irrigation practices, the soil profile will be near the wilting percentage in the top 4 feet at harvest. As indicated in table 1, about
8
inches of available water could then be stored in the 0- to 4-foot depth. From table 3, the average precipitation during the fall and winter moon in this area is about 7 inches. However, from November through March approximately one-half of this precipitation comes from storms bringing less than one-half inch each, resulting in high evaporation losses. Therefore, unless large rains are received in April and May, the soil generally not be wet to more than 1 to 2 feet by planting time. With these soil moisture conditions, prep/elating irrigations may be more convenient than applying greater amounts of water after planting.High Production Loire!
16
CONSERVATION RESEARCH REPORT 5, 17.5. DEPT. OF AGRICULTORSpreplanting irrigation was given, irrigations can be scheduled by (1) observing rainfall that has occurred, (2) estimating probable rainfall based on current forecasts for 4 to 5 days ahead, and (3) utilizing the mean cumulative .Et or E, rate curve of figure 2 or 3. For high yields, only about 50 percent of available water can be de-pleted before irrigating the first time when the root system is not
fay
developed. Thus, the first irrigation should be applied to the entire field before 3 to 3.5 inches are used from the soil. With normal precipitation in June and July and a planting date near June 15, the first irrigation will be needed in late July or early August, depending on actual rainfall. The second irri-gation will be needed about August 15, allowing 3 to 3.5 inches to be depleted from the soil after the first irrigation. The third irrigation, and probably the last, would be needed between September 5 and 10. A season with below normal precipitation would require four irrigations with the first one beginning sooner than indicated, whereas a season with above normal precipitation may.require only two irrigations, each irrigation requiring 3.5 to 4 inches of water.Medium Production Level
If adequate fertilizer and a preplanting irri-gation are assumed, the first irriirri-gation for the medium production level should be given before
3.5 to 4 inches of soil moisture are used. With normal climatic conditions, the first irrigation will be needed about the first week in August. The second, andperhaps the last irrigation, should be given when about 5 inches of soil moisture are used after the first irrigation. With about 2.5 inches of average rainfall in August, this irrigation will be needed about September 1. A dry season would require three irrigations and a wet season perhaps only one irrigation, scheduled in a similar manner.
Low Production Level
If limited water supply or pumping capacity during the summer is anticipated, irrigation for a low production level may be necessary. The planting rate should be reduced to rates near those used for dryland farming. If a preplantingirriga-tion was given, then the first and only irrigapreplantingirriga-tion during the growing season should be given when the plants begin to show signs of severe wilting during the day. Preferably, this irrigation should be delayed until the middle or latter part of August during the milk stage. The yield with this practice will not be high, but it will be greater than dryland yields. Fertilizer requirements will be consider. ably less at this level of production. Lodging caused by charcoal rot may be severe some years with these limited irrigation practices.
SUMMARY AND CONCLUSIONS
The 4-yeax study of irrigated grain sorghum, with six soil moisture levels and each with six
fertilizer treatments, showed that seasonal eve o-transpiration (Es) will average about 22 inches from planting to harvest when irrigating and fertilizing for high yields (fig. 2). Nitrogen fertil-izer increased yields 2 to 2% times more than those from plots receiving no nitrogen, but increased seasonal E, only about 6 percent.
The rate of Et shortly after planting grain sorghum in June was less than 0.1 inch per day, even though solar radiation and air temperatures were high. As amount of vegetation increased, the Et rate increased rapidly, reaching a maximum of about 0.30 inch per day during the early part of August (ft. 3). During August and until harvest, the E, rate decreased as solar radiation, air temperature; and soil moisture decreased, and as the plants matured.
Grain sorghumyields were greatly affected by the soil moisture level. Yields were also greatly affected by the rate of nitrogen application in the third and fourth year after beginning to irrigate Pullman soil. To maintain yields of 6,000 to 7,000
lb./acre, at least 120 lb./acre of nitrogen wer required annually after 2 years of irrigation (table 4). With limited irrigations that restricted yields to 2,500 to 3,000 lb./acre, nitrogen fertilizer was not needed.
Yields were less than 6,000 to 7,000 Ib. per acre when more than 80 percent of the available water in the 0- to 4-foot depth had been depleted before irrigating (fig. 4). Delayed irrigations reduced seasonal E, by 10 to 20 percent, but yields were reduced 20 to 35 percent (ft. 5), Severe lodging caused by charcoal rot and low test weights occurred when soil moisture was adequate early in the season but inadequate late in the season.
LITERATURE CITED
(1) Bona J. J., ARMY, T. 3., and 'VAN DoRI1N, C. E. 1962. YIELD PROBABILITY EVALUATIONS FOR DRY
LAND GRAIN SORGHUM PRODUCTION ON TWO SOILS OF TRE SOUTHERN NIGH. PLAINS. Tex. Agr. Expt. Sta. Misc. Pub. 555, 7 pp., illus.
(2) Borrorcos, G. .T, and MICE, A. H.
1947. IMPROVEMENT IN THE PLASTER OF PARIS ABSORPTION BLOCS ELECTRICAL RESISTANCE METHOD FOR MEASURING SOIL MOISTURE UNDER FIELD CONDITIONS. Soil Bd. 63(6):
455-465.
(3) Comae, J. R., VAN DOREN, C. E., and WEITFIELD,
C. J. 1953.
THE EFFECTS OF IRRIGATION TREATMENTS ON EVAPOTRANSPIRATION AND PRODUCTION OF SORGHUM AND WHEAT IN THE SOUTHERN GREAT PLAINS. internotl. Soil Std. 7th
Cong. Trans. 1 (1):386-398. (7) - and Mosier, J. T.
1962. IRRIGATING GRAIN SORGHUMS. q.5. Dept. Agr. Leaflet 511, 6 pp.
- and 81.16TYNN, W. H.
1957. GOOD IRRIGATION MANAGEMENT BRINGS INCREASED SORGHUM YIELDS. Sail and Water 6(7):8-9.
- SLETTEN, W. H., and OCHE, R. L.
1960. MECHANIZER SOIL SAMPLER WITH OFFSET DRIVE. Amer. Soc. Agr. Engin. Trans.
3(1):22-24.
LoTermcn, F. B., and Coovaa, 3. R.
1962. SOIL FORMING FACTORS ON THE LLANO ESTACADO: I. PARENT MATERIAL, TIME AND TOPOGRAPHY. Tex. Jour. Sc!. 14(1):7-17. 17.
MATHERS, A. C. VIETB, F. G., Jr., JENSEN, M. E1
and SLErrEn, W. H.
1960. RELATIONSHIP OF NITROGEN AND GRAIN SORGHUM YIELD UNDER THREE MOISTURE REGIMES. Agron. Jour. 52:443-446. Munoz, J. T., Gamins, D. W., and HEREON, G. M.
1963. IRRIGATION WATER MANAGEMENT AND NITROGEN FERTILIZATION OP GRAIN sOli. (Alum& Agron. Jour. 55:295-298. PoRTER, K. B., JENSEN, M. E., and SLETTIN, W. H.
1960. THE EFFECT OF ROW SPACING, FERTILIZER
AND PLANTING RATE ON THE YIELD AND
WATER USE OP IRRIGATED GRAIN 501F °nun. Agron. Jour. 52:431-434.
Quinn', J. R., KRAMER, N. W., STEPHENS, J. C., and others.
1958. GRAIN SORGHUM PRODUCTION IN TEXAS. Tex. Expt. Sta. Bul. 912, 35 pp. TAYLOR, H. M., VAN DOREN, C. E., GODFREY, C. L.,
and COovsz, J. R.
1963. some or THE SOUTHWESTERN GREAT PLAINS FIELD STATION. TeX. Agr. Expt. Sta. Miro. Pub. 669, 14 pp.
Virn,_F. G., Jr.
1952. FERTILIZERS AND EFFICIENT USE OP WATER. Adv. in Agron. 14:223-264.
SOME CHARACTERISTICS OP THIS PULLMAN SOILS ON THE AMARILLO EXPERIMENT STATION. Tex. Agr. Expt. Sta. Mien. Pub. 97, 11 pp.
(4) SENSZN, M. E., and HAMM, H. B..
1963. ESTIMATING EVAPOTRANSPIRATION FROM SOLAR RADIATION. Amer. Soo. Qv. Engin. Proc., Jour. Irrig. and Drain. Div. 89(IR4): 15-41.
(5) and MumEnt, R. J.
1963. RAINFALL AT AMARILLO. Tex. Agr. Expt. Sta. Misc. Pub. 583, 9 pp.
(6) and MtnnE, J. T.
1960.
4.0
& 0
Inches
4.0
3. &05
Date
Apr. 8 June 27 July 26 July 30 July 31 Aug. 6 Aug. 11 Aug. 15 Aug. 30 Sept. 4
Preplanting Emergence
24-in. height 26-in. height 26-in. height Boot_ Boot Flower
Milk Soft dough
inches
4.0
3.0
Total
1957
June 8 July 24 Aug. 3 Aug. 30 Sept. Sept. 6 Sept. 13 Sept. 20
Total
1968
May 30 Aug. 8 Aug. 12 Aug. 19 Aug. 30 Sept. 3
Sept.5 Sp 9
Total
1989
June
July 24 July 31 Aug. 4_ Aug. 7 Aug. 19 Sept. 2 Sept. 15
Total
Average, 1956-59
Freplanting 18-m. height Boot Milk_ Milk Milk Soft dough Maturation
Preplanting Boot_ Flower Flower Milk Milk Soft dough Soft dough
Preplanting 16-in height
20-in. Boot_ height Boot Flower Soft dough Hard dough
5.88 9.88 13.. 75 15.75 17.06
5.0 4.0 4.0
5.0 4.0 4.0
13. 42 4.0 4.0
5.5 4.0 4.0
18
CONSERVATION RESEARCH REPORT 5, II.S. DEPT. OF AORICULTURSAPPENDIX
TABLE 10.—Record of irrigations and stage of growth of grain sorghum at Dushland, Tex., 1956-59