*Corresponding author: Govindaiah T.N ISSN: 0976-3031
Research Article
QUANTUM DOT STUDIES ON BINARY MIXTURE OF LIQUID CRYSTALLINE MATERIALS
Govindaiah T.N*, Mahendra K. B and Chethan B. N
Department of Physics, Government College (Autonomous), Mandya-571401, India
DOI: http://dx.doi.org/10.24327/ijrsr.2019.1011.4202
ARTICLE INFO ABSTRACT
Optical phase transition studies on binary mixtures of cholesteryl nonanoate (CN) and 1,7-bis-4-(4′-cyanobiphenyl) heptane (CB7CB) materials exhibits a cholesteric and re-entrant smectic-A phases sequentially when the specimen cooled from its isotropic melt at different concentrations and at different temperatures respectively. The photonic band gap and quantum dots of liquid crystalline materials are estimated with the help of temperature dependence of optical anisotropy from the experimentally measured values refractive index and helical pitch.
INTRODUCTION
Liquid crystals are ordered fluids characterized by molecular anisotropy. The most well known example of a liquid crystal phase is the nematic phase, typically formed from rod-like molecules in which the constituent molecules have local orientational order, defined by a director. The nematic phase is widely used in the display industry, for which molecular re-orientation under an applied electric field provides the mechanism for optical switching. There are many possible liquid crystal phases, with varying degrees of positional and orientational order, but still maintaining fluid-like properties and these include the layered smectic phases, columnar phases with two-dimensional hexagonal order and complex chiral phases such as the blue phases. The cholesteric phase, a chiral analog of nematic phase is particularly interesting for photonic devices as it exhibits a one-dimensional photonic band gap in planar alignment: that are very useful for lasing applications and spontaneous emission enhancement in single-photon sources for secure quantum communication. Although complicated, the blue phases also exhibit photonic band gaps and have been explored for similar lasing applications.
Structural tunability is one of the strengths of using liquid crystal materials in a photonic device. The photonic band gap of the cholesteric phase is tunable with temperature and applied electric field. In addition, the phase can be designed to have a specific band gap over a desired temperature range by varying
its molecular composition. Since liquid crystals can be designed to exhibit phases of interest at and around room temperature, material mixing and processing is relatively easy. Liquid crystals can be used to create electro-optically active thin films and apply them to a variety of different device geometries without the constraints of solid material growth or lithography [1, 2]. The electronic structure of quantum dots gives them unique semiconductor and optical properties that are tunable as a function of their physical size and composition. These structures tend to exhibit properties that are intermediate between bulk semiconductor materials and single molecules. A typical property of quantum dots is that the optical emission spectra can be tuned by changing their diameter. Quantum dots have also been proposed for the construction of improved transistors and for quantum computing and medical imaging applications [3].
In the present paper, our aim is to study the optical phase transition studies of binary mixtures of cholesteryl nonanoate (CN) and 1,7-bis-4-(4′-cyanobiphenyl) heptane (CB7CB) materials exhibits a cholesteric and re-entrant smectic-A phases sequentially when the specimen cooled from its isotropic melt at different concentrations and at different temperatures respectively. The photonic band gap and quantum dots of liquid crystalline materials are estimated with the help of temperature dependence of optical anisotropy from the experimentally measured values refractive index and helical pitch [4, 5].
International Journal of
Recent Scientific
Research
International Journal of Recent Scientific Research
Vol. 10, Issue, 11(D), pp. 35950-35954, November, 2019
Copyright © Govindaiah T.N, Mahendra K. B and Chethan B. N, 2019, this is an open-access article distributed under the terms of the Creative Commons Attribution License, which permits unrestricted use, distribution and reproduction in any medium, provided the original work is properly cited.
DOI: 10.24327/IJRSR
CODEN: IJRSFP (USA)
Article History:
Received 4th August, 2019 Received in revised form 25th September, 2019
Accepted 18th October, 2019
Published online 28th November, 2019
Key Words:
Texture studies; optical anisotropy; helical pitch; photonic band gap;
EXPERIMENTAL STUDIES
In the present study, we used the materials, namely, cholesteryl nonanoate (CN) and 1,7-bis-4-(4′-cyanobiphenyl) heptane (CB7CB). Mixtures of different concentrations of cholesteryl nonanoate (CN) and 1,7-bis-4-(4′-cyanobiphenyl) heptane (CB7CB) were prepared and they were mixed thoroughly. These mixtures of concentrations were kept in desiccators for 6 hours. The samples were subjected to several cycles of heating, stirring and centrifuging to ensure homogeneity. Phase transition temperatures of these mixtures were measured with the help of Gippon-Japan-polarizing microscope in conjunction with hot stage. The samples were sandwiched between the slide and cover slip and were sealed for microscopic observations. The refractive indices in the optical region were determined at different temperatures by employing the techniques described by the earlier investigators [6, 7].
RESULTS AND DISCUSSIONS
Optical Texture Studies
Molecular orientations of optical textures exhibited by the samples were observed and recorded using Gippon-Japan-polarizing microscope in conjunction hot stage. The specimen was taken in the form of thin film and sandwiched between the slide and cover glass. Mixtures of different concentrations of given molecules were slowly cooled from its isotropic melt. The genesis of nucleation starts in the form of small bubbles and immediately, these bubbles grow radially and form a fingerprint pattern, which is characteristic of the cholesteric phase with large values of pitch [8, 9]. The existence of fingerprint pattern of cholesteric phase as shown in Figure 1. On cooling the specimen, a cholesteric phase slowly changes over to well define focal conic fan shaped texture of SmA phase.
Figure 1 Microphotographs obtained in between the crossed polars.
Fingerprint pattern of cholesteric phase (250X).
This phase is unstable and then it changes over to SmC* phase, which exhibits radial fringes on the fans of focal conic textures, which are characteristic of chiral SmC* phase. Sequentially on cooling the specimen, this phase slowly changes over to schlieren texture of SmC phase In this phase transition studies; the molecular arrangement of SmC phase is also unstable and then it changes over to small bubbles in the form of battonnets,
which are the characteristic of SmA phase and hence this phase has been termed as the reentrant SmA (ReSmA) phase. Again on further cooling the specimen: the existence of re-entrant SmA (ReSmA) phase is slowly changes over to hexagonal close packed higher ordered SmB phase, which remains stable at room temperature [10].
Optical Anisotropy
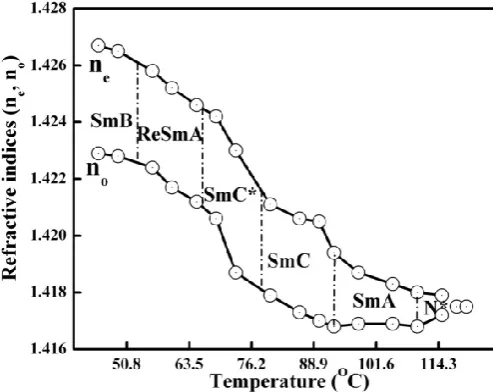
Results of this investigation are further supported by the optical studies. Temperature-dependent refractive indices are an important for practical applications, such as projection displays and thermal-induced photonic band-gap tuning. It is highly desirable to predict the refractive indices at the designated operating temperature of a liquid crystal device. The refractive indices for extraordinary ray (ne) and ordinary ray (no) of the
given mixture were measured at different temperatures for the different mixtures using Abbe Refractometer and Precession Goniometer Spectrometer. The temperature variations of refractive indices for 35% CN in CB7CB are shown in Figure 2.
Figure 2 Temperature variations of refractive indices for the mixture of 35%
CN in CB7CB.
Helical Pitch Measurements of Induced Chiral Smectic and Chiral Nematic Phases
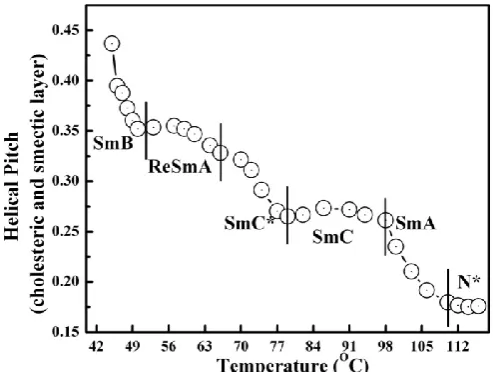
Helical pitch measurements were performed on the cholesteric phase following the well-known Grandjean-Cano wedge method [15, 16]. The given mixture was taken in a wedge-shaped cell treated for homogeneous alignment. The two glass plates formed a small angle at the wedge. The mixture was cooled slowly (0.2°C min−1) from isotropic cholesteric to smectic phase, which induces an array of equidistant Grandjean-Cano lines. The pitch of cholesteric phase was determined by measuring the distance between the Grandjean-Cano lines as a function of temperature. As the temperature was lowered, the mesophase changes from cholesteric to smectic phase and the spacing between lines are increased, indicating that: pitch in the cholesteric phase is also increasing. Temperature variation of pitch for the mixture of 35% CN in CB7CB is shown in Figure 3.
Figure 3 Temperature variations of helical pitch for the mixture of 35% CN in
CB7CB.
From this figure, it is evident that, the variation of pitch from cholesteric to smectic phase is smooth and continuous. But gradually, the value of pitch increases from 0.17 to 0.19 mm upon cooling the sample from cholesteric to smectic phase. The value of pitch increases steeply and reaches a maximum of 0.51 mm at the cholesteric to smectic phase transition. In this study, we have noticed that: the sequence is Isoropic-cholesteric-smectic-A-smectic-C-smectic-C*- Re-entrant smectic-A-smectic-B phases on cooling [17, 18]. Pitch is continuous at the cholesteric-smectic phase transition in spite of rather energetic transition. The pitch increases on cooling to smectic phase and it diverges on approaching the A, C, smectic-C∗, Re-entrant smectic-A and smectic-B phases. This divergence is related to second-order transition. It exhibits a steep decrease and it close to cholesteric phase which are usually the characteristics of second-order phase transition of smectic-A, smectic-C, smectic-C∗, Re-entrant smectic-A and smectic-B phase respectively at different temperatures. Here if there it follows to predict: how the molecular structures of chiral dopant molecules are related to the existence of helical twisting power. A small change in structure can lead to large changes in macroscopic helical twisting power [19, 20]. These large changes apparently arise because the chiral solute molecules with slightly different shapes can induce significant differences in local orientational order of the solvent molecules around them. Hence helical twisting power calculations are
necessary to have a twisted nematic solvent. This in turn induces different amounts of twist in the bulk solvent. Therefore it is clear that: theoretical method that can predict helical twisting values reliably would be extremely valuable.
Studies on Temperature Dependent Photonic Bandgap
Temperature variation of photonic band gap for the mixture of 35% CN in CB7CB is shown in Figure 4. From the figure, we have observed that: increase in temperature of given material causes a decrease in photonic band gap, for which in this region: the conductivity also decreases. In this study: the temperature dependent photonic band gap of liquid crystalline material are estimated at different concentration of given molecules, which shows different molecular structures and they have induced a phase separation and aggregation of the chiral molecules. If the temperature increases; sample are more and much more transparent and the planar helical structures become more uniform. If the increasing temperature causes an increase in pitch, which clearly tells that: the segregations of molecular layers decrease [21-24]. Temperature dependent optical birefringence, helical pitch and nano-molecular self-assembled aggregation of the molecules and optical band gap are more and more attractive to demonstrate scientific technological potential applications such as optical switches, filters and waveguides.
Figure 4 Temperature variations of photonic band gap for the mixture of 35%
CN in CB7CB.
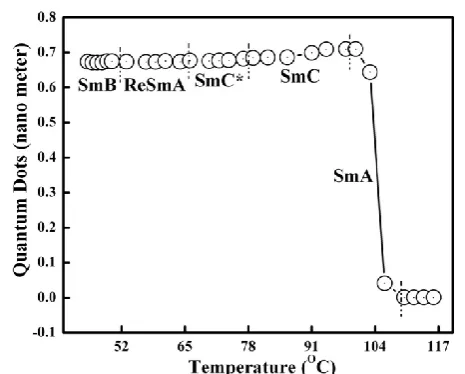
Studies on Temperature Dependent Quantum Dots of Liquid Crystalline Materials
Figure 5 Temperature variations of quantum dots for the mixture of 35% CN in CB7CB.
As the temperature increases from 45 OC to 100 OC, the values of quantum-dots are changes in the nano level of the order of 0.6738 to 0.71 nm. Temperature above 100OC, the values of quantum dots is 0.000677 to 0.0006658 nm. The changes in values of energy band gap structure of bulk material and radius of the quantum dots reduces a dimension of quantum dot and hence which increases the confinement energy in the quantum dot. The confinement energy in the quantum dots which can arise from electrostatic potentials generated by external electrodes, doping, strain or impurities [34]. The width of the quantum dot, energy band gap structure depends on its size and chemical composition [35, 36]. In the active surface area of optical-phase transition system, charge carriers are mutually exchange between the quantum-dot and in this region; the existence of charge carrier describe microscopically based discrete energy band gap of given materials, which are relevant to the nano-crystals of a semiconducting materials. Quantum dots are particularly significant for optical applications owing to their bright, pure colors along with their ability to emit rainbow of colors coupled with their high efficiencies, longer life times and high extinction coefficient. Examples include light emitting diodes and solid state lighting, displays and photovoltaic’s [37-39].
CONCLUSIONS
Microscopic investigation of the binary mixture of given molecules shows the existence of cholesteric and re-entrant smectic-A phases for different concentrations and at different temperatures. Temperature variations of photonic band gap and quantum dots are changes the values of energy band gap structure of bulk materials. Quantum confinement is very useful in explaining the ability of a quantum dot to have size dependent properties. Optical studies on quantum dots are more attractive to demonstrate scientific technological potential applications, such as quantum computing and medical imaging system.
References
1. de Gennes, P. G. & Prost, J. (1993).The Physics of Liquid Crystals. 2nd ed.Clarendon, Oxford.
2. Craig, D. P. (1979). Optical Activity and Chiral Discrimination, Edited by S. F. Mason D. Reidel, New York.
3. Govindaiah, T. N., (2016). Mol. Cryst. Liq. Cryst. 626,151-159
4. Fraden, S. (1995). In Observation, Prediction, and Simulation of Phase Transitions in Complex Fluids, Edited by M. Baus, L. F. Rull, & J. P. Ryckaert (Kluwer, Dordrecht).
5. Musevic, I., Skarabot, M., Heppke, G. & Nguyen, H. T. (2002). Liq. Cryst. 29, 1565-1568.
6. Nagappa, Revanasiddaiah, D. & Krishnamurti D. (1983). Mol. Cryst. Liq. Cryst.101, 103-127.
7. Govindaiah, T. N, Sreepad, H. R. & Nagappa. (2014). Mol.Cryst. Liq. Cryst.592, 82-90.
8. Govindaiah, T N. & Sreepad, H. R. (2015). Phase Transitions. Vol-88(4), 368-374.
9. Serafin Delica, Melvin Estonactoc, Mary Claire Micaller, Leonorina Cada, & Zenaida Domingo. (1999). Science Diliman. 11(2), 22-24.
10. Govindaiah, T. N., Sreepad, H. R., Kempegowda, B. K. & Nagappa. (2013). Mol. Cryst. Liq. Cryst. 587, 54-59. 11. Alkeskjold, T. T., Bjarklev, A., Hermann, D. S., &
Broeng, J. (2003). Opt. Express, 11, 2589.
12. Alkeskjold, T. T., Lægsgaard, J., Bjarklev, A., Hermann, D. S., Anawati, D. S., Li, J. & Wu, S. T. (2004). Opt. Express, vol. 12, 5857.
13. Warenghem, M., Henninot, J. F. & Abbate, G. (1998). Opt. Express, vol. 2, 483.
14. Warenghem, M., Henninot, J. F., Derrin, F. & Abbate, G. (2002). Mol.Cryst. Liq. Cryst., 373, 213.
15. Sadashiva, B. K. (1999). Pramana J. Phys. 53, 213-222. 16. Govindaiah, T. N., Sreepad, H. R. & Nagappa. (2013).
Mol.Cryst. Liq. Cryst. 575, 22-29.
17. Balasubramanian, D. (2005). Photochem. Photobiol. 81, 498-501.
18. Govindaiah, T. N. & Sreepad, H. R. (2005). J. Mol. Liq. 202, 75-78.
19. Stutzer, C., Weissflog, W. & Stegmeyer, H. (1996). Liq. Cryst. 21, 557.
20. Yarmolenko, S. N., Kutulyas, L. A., Vashchenko, V. V. & Chepeleva, L. V. (1994). Liq. Cryst. 16, 877.
21. Zhang, F. & Yang, D. K. (2002). Liq. Cryst. 29, 1497-1501.
22. Li, J., Gauza, S. & Wu, S. T. (2004). J. Appl. Phys. 96, 19-24.2004.
23. Chanishvili, A., Chilaya, G., Petriashvili, G., Barberi, R., Bartolino, R., Cipparrone, G., Mazzulla, A. & Oriol, L. (2003). Appl. Phys. Lett. 83, 5353-5355.
24. Govindaiah, T. N., (2016). Mol. Cryst. Liq. Cryst. 631, 99-106.
25. Chow, W.W., Schneider, H.C. & Phillips, M.C. (2003).
Phys. Rev. A 68, 053802.
26. Rodt, S., Schliwa, A., Pötschke, K., Guffarth, F. &
Bimberg, D. (2005). Phys. Rev. B 71, 155325.
27. Feldtmann, T., Schneebeli, L., Kira, M. & Koch, S.W.
(2006). Phys. Rev. B 73, 155319.
28. Gies, C., Wiersig, J., Lorke, M., & Jahnke, F.(2007).
Phys. Rev. A 75, 013803.
29. Asryan, L.V., & Suris, R. A. (2010). Appl. Phys. Lett.
96, 221112.
30. Erneux, T., Viktorov, E.A., Kelleher, B., Goulding, D.,
31. Tong, C.Z., Yoon, S.F., Ngo, C.Y., Liu, C.Y., & Loke, W.K. (2006). IEEE J. Quantum Electron. 42, 1175-1183
32. Lüdge, K. & Schöll, E. (2009). IEEE J. Quantum
Electron. 45, 1396-1403.
33. Gioannini, M. (2012). J. Appl. Phys. 111, 043108.
34. Dorfs, D. & Eychmueller, A. (2006). Zeitschrift fuer Physikalische Chemie. 220 (12), 1539.
35. Ashoori, R. C. (1996). Nature. 379 (6564), 413.
36. Takeda, H. & John, S. (2011). Phys. Rev. A 83, 053811.
37. Yoffe, A. D. Advances in Physics, 2001, 50(1), 1. 38. Nirmal, M. & Brus, L. (1999). Accounts of Chemical
Research. 32(5), 407.
39. Sargent, E. H. (2012). Nature photonics. 6(3), 133.
How to cite this article:
Govindaiah T.N, Mahendra K. B and Chethan B. N.2019, Quantum Dot Studies on Binary Mixture of Liquid Crystalline Materials. Int J Recent Sci Res. 10(11), pp.35950-35954. DOI: http://dx.doi.org/10.24327/ijrsr.2019.1011.4202