Mehdi et al. World Journal of Pharmaceutical and Life Sciences
VALIDATION OF A FORCED DEGRADATION UPLC METHOD FOR ESTIMATION OF
FLUNIXIN
Syed Rashed Faizan Mehdi*, Syed Mohiuddin, Hussain Ali Khan and Syed Majid
Department of Pharmaceutical Analysis, Deccan School of Pharmacy, Hyderabad, TS, India.
Article Received on 07/12/2018 Article Revised on 28/12/2018 Article Accepted on 18/01/2019
1. INTRODUCTION
Flunixin, 2-[[2-Methyl-3-(trifluoromethyl) phenyl] amino] pyridine-3-carboxylic acid (Fig. 1), is a nonsteroidal anti-inflammatory drug (NSAID), analgesic, and antipyretic used in horses, cattle and pigs. It is often formulated as the meglumine salt.[1,2]
Chemical stability of Flunixin is a matter of great concern as it affects the safety and efficacy of the finished drug product. Forced degradation studies provide data to support identification of possible degradants; degradation pathways and intrinsic stability of the Flunixinmolecule and validation of stability indicating analytical procedures.[4,5,6]
A detailed literature revealed that several analytical methods have been reported for the determination of Flunixin in pharmaceutical dosage forms. In our present knowledge, there is no method reported for the estimation forced degradation studies of Flunixin in pharmaceutical dosage form by UPLC. [13-17]
Hence, the aim was to develop a specific, rapid, sensitive, and accurate UPLC method which can estimate the forced degradation studies of Flunixin.
The present work aims with the developed method to be only this mobile phase is sufficient for quantification of degraded products under stress.
Fig. 1: Molecular Structure of Flunixin, 2-[[2-Methyl-(trifluoromethyl) phenyl] amino] pyridine- 3-carboxylic acid.[12]
2. EXPERIMENTAL
Materials
Flunixin (99.99 % purity) used as analytical standard was procured from Active Pharma Labs (Hyderabad). HPLC grade methanol, Acetonitrile (HPLC grade) was purchased from Qualigens fine chemicals, Mumbai, India. Distilled, 0.45 μm filtered water used for UPLC quantification and preparation of buffer. Buffers and all other chemicals were analytical grade.
World Journal of Pharmaceutical and Life Sciences
WJPLS
www.wjpls.org
SJIF Impact Factor: 5.008*Corresponding Author: Syed Rashed Faizan Mehdi
Department of Pharmaceutical Analysis, Deccan School of Pharmacy, Hyderabad, TS, India.
ABSTRACT
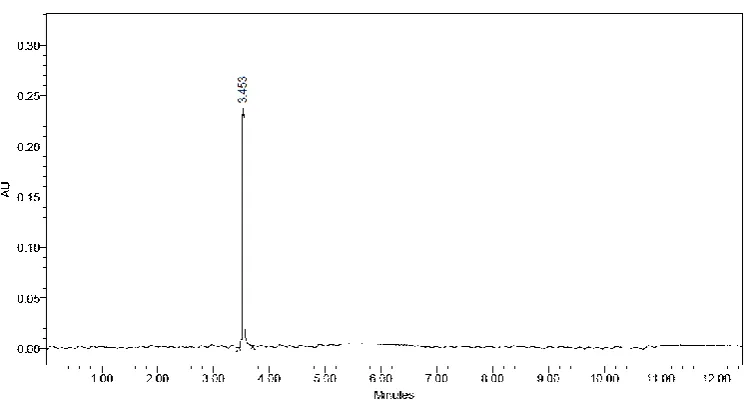
A specific, precise, accurate and forced degradation UPLC method is validated for estimation of Flunixin. The method employed, with Hypersil BDS C18 (100 mm x 2.1 mm, 1.7 μm) column in an gradient mode, with mobile phase of Methanol, 0.1% Orthophosphoric acid and Acetonitrile in the ratio of 45:35:20 %v/v/v. The flow rate was 0.1 ml/min and effluent was monitored at 239 nm. Retention time was found to be 3.453±0.08 min. The method was validated in terms of linearity, accuracy, precision, limit of detection (LOD), limit of quantification (LOQ) etc. in accordance with ICH guidelines. Linear regression analysis data for the calibration plot showed that there was good linear relationship between response and concentration in the range of 1- 10 µg/ml respectively. The LOD and LOQ values for were found to be 0.31607(μg/ml) and 0.95781(μg/ml) respectively. No chromatographic interference from parenteral’s excipients and degradants were found. The proposed method was successfully used for estimation of (parenterals form).
Mehdi et al. World Journal of Pharmaceutical and Life Sciences
Instrumentation
Acquity, Waters UPLC system consisting of a Water 2695 binary gradient pump, an inbuilt auto sampler, a column oven and Water 2996 wavelength absorbance detector (PDA) was employed throughout the analysis.
The data was collected using Empower 2 software. The column used was Hypersil BDS C18 (100 mm x 2.1 mm, 1.7 μm). A Band line sonerex sonicator was used for enhancing dissolution of the compounds. A Labindia pH System 362 was used for pH adjustment.
Chromatographic Conditions
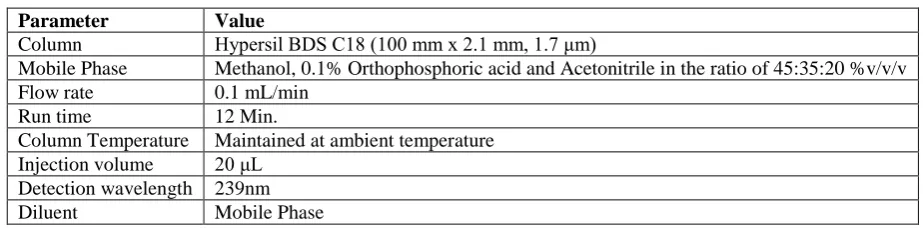
Table 1: Chromatographic Conditions of the validating method.
Parameter Value
Column Hypersil BDS C18 (100 mm x 2.1 mm, 1.7 μm)
Mobile Phase Methanol, 0.1% Orthophosphoric acid and Acetonitrile in the ratio of 45:35:20 %v/v/v Flow rate 0.1 mL/min
Run time 12 Min.
Column Temperature Maintained at ambient temperature Injection volume 20 μL
Detection wavelength 239nm Diluent Mobile Phase
Preparation of Standard Stock Solution Preparation of Diluent
In order to achieve the separation under the optimized conditions after experimental trials that can be summarized. Stationary phase like Hypersil BDS C18 (100 mm x 2.1 mm, 1.7 μm) column was most suitable one, since it produced symmetrical peaks with high resolution and a very good sensitivity and with good resolution. The flow rate was maintained 0.1mL min-1 shows good resolution. The PDA detector response of Flunixin was studied and the best wavelength was found to be 239 nm showing highest sensitivity.
The mixture of three solutions methanol, 0.1% orthophosphoric acid and acetonitrile in the ratio of 45:35:20 %v/v/v. The buffer used is 2.96 gms of Sodium phosphate in 100 ml with gradient programming was used as mobile phase at 0.1 mL/min was found to be an appropriate mobile phase for separation of Flunixin. The column was maintained at ambient temperature.
Preparation of internal standard solution: (Sol 1)
Weighed accurately about 100 mg of Testosterone propionate working standard and transfer to 1000 ml volumetric flask, add 100 ml Diluent and sonicate to dissolve it completely and then dilute to 1000 ml with diluent. 10 ml of the above solution to 100 ml with diluent and filter out above solution through the 0.45micron filter. (10μg/ml Concentration)
Preparation of Flunixin standard solution: (Sol 2)
Weighed accurately about 100 mg of Flunixin and transfer to 1000 ml volumetric flask, add 100 ml Diluent and sonicate to dissolve it completely and then dilute to 1000 ml with diluent.
Preparation of Mixed Standard solution
Pipette out 10 ml of (solution 1} and (solution 2) in to 100 ml volumetric flask, dilute to volume with diluent and mix.
Preparation of Sample solution
Weigh 1000 ml dry volumetric flask into 1000 ml volumetric flask and weigh accurately the sample quantity for calculation add 80 ml diluent and sonicate for 10 minutes, cool to room temperature and diluent to make up 1000 ml. Transfer 100 ml above solution and 300 ml of (solution 1) into 500 ml volumetric flask and make up the volume with diluents. Filter the solution through 0. 45μ.filter (concentration of Flunixin 10 mcg/ml).
Forced Degradation Studies
Forced degradation studies like acid hydrolysis, basic hydrolysis, dry heat degradation, wet heat degradation and oxidative degradation were carried out.
3. RESULTS AND DISCUSSIONS
Validation
Fig. 2: Standard Chromatogram of Flunixin, using mobile phase of Methanol, 0.1% Orthophosphoric acid and Acetonitrile in the ratio of 45:35:20 % v/v/v.
Linearity and Range
The linearity of an analytical procedure is the ability to obtain test results that are directly proportional to the concentration of an analyte in the sample.
The calibration curve showed good linearity in the range of 1 – 10 µg/ml, for Flunixin(API) with correlation coefficient (r2 ) of 0.9996. A typical calibration curve has the regression equation of y = 51046.38x + 4603.667for Flunixin. Results are given in Table 3.
Limit of Detection (LOD) and Limit of Quantitation (LOQ)
The LOD and LOQ of Flunixinwere calculated by mathematical equation. LOD= 3.3×standard deviation ÷ slope and LOQ=10×standard deviation ÷ slope. The LOD of Flunixinwas found to be 0.31607(μg/ml) and the LOQ of Flunixinwas found to be 0.95781(μg/ml). Results are given in Table 3.
Table 3: Summary of validation parameters for the proposed method.
Parameter Flunixin
Linearity 1 – 10 ppm Intercept (c) 4603.667 Slope (m) 51046.38 Correlation coefficient 0.9996
LOD 0.31607(μg/ml) LOQ 0.95781(μg/ml)
Precision
The Precision of the method was studied in terms of intraday and interday precision of sample injections (5µg/ml). Intraday precision was investigated by injecting six replicate samples of each of the sample on the same day. The % RSD was found to be 0.534. Interday precision was assessed by analysis of the 6
solutions on three consecutive days. The % RSD obtained was found to be 0.925. Low % RSD values indicate that the method is precise. The results are given in table 4.
Robustness
Small deliberate changes in chromatographic conditions such as change in temperature (± 2°C), flow rate (± 0.1ml/min) and wavelength of detection (± 2nm) were studied to determine the robustness of the method. The results were in favor of (% RSD < 2%) the developed UPLC method for the analysis of Flunixin. The results are given in table 6.
Accuracy
Mehdi et al. World Journal of Pharmaceutical and Life Sciences
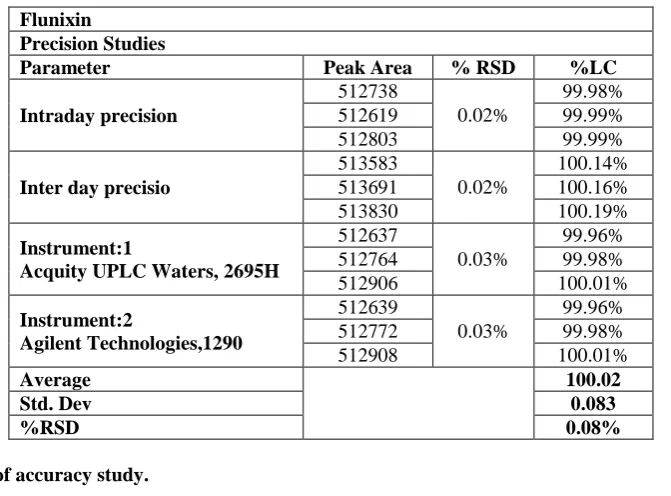
Table 4: Results of Precision Studies.
Flunixin
Precision Studies
Parameter Peak Area % RSD %LC
Intraday precision
512738
0.02%
99.98% 512619 99.99% 512803 99.99%
Inter day precisio
513583
0.02%
100.14% 513691 100.16% 513830 100.19%
Instrument:1
Acquity UPLC Waters, 2695H
512637
0.03%
99.96% 512764 99.98% 512906 100.01%
Instrument:2
Agilent Technologies,1290
512639
0.03%
99.96% 512772 99.98% 512908 100.01%
Average 100.02
Std. Dev 0.083
%RSD 0.08%
Table 5: Results of accuracy study.
Flunixin
Level % Amount added (μg/ml) Amount found (μg/ml) % Recovery
Mean recovery
(%) Std. Dev
% RSD
50 16.51 16.29 98.66
98.90 0.552 0.56% 100 33.03 32.88 99.54
150 49.54 48.81 98.52
Table 6: Results of Robustness Studies.
Robustness Studies
Parameter Value Peak Area % RSD
Flow Rate
Low 512939
0.06%
Actual 513272
Plus 513508
Temperature
Low 512948
0.06%
Actual 513265
Plus 513523
Wavelength
Low 512604
0.13%
Actual 513442
Plus 513897
Forced Degradation Studies
According to Singh and Bakshi, the stress testing suggests a target degradation of 20-80 % for establishing stability indicating nature of the method. UPLC study of samples obtained on stress testing of Flunixinunder different conditions using mixture Methanol, 0.1% Orthophosphoric acid and Acetonitrile in the ratio of 45:35:20 %v/v/v as a mobile solvent system suggested the following degradation behaviour.
a. Acid hydrolysis
An accurate 10 ml of pure drug sample solution was transferred to a clean and dry round bottom flask (RBF). 30 ml of 0.1 N HCl was added to it. It was refluxed in a
Fig. 3: Chromatogram showing the degraded products in Acidic degradation.
b. Basic hydrolysis
An accurate 10 ml of pure drug sample solution was transferred to a clean and dry RBF. 30 ml of 0.1N NaOH was added to it. It was refluxed in a water bath at 60°C for 4 hours. Drug became soluble after reflux which was insoluble initially. It was allowed to cool at room temperature. The sample was then neutralized using 2N
HCl solution and final volume of the sample was made up to 100ml with water to prepare 100ppm solution. It was injected into the UPLC system against a blank of Methanol, 0.1% Orthophosphoric acid and Acetonitrile in the ratio of 45:35:20 %v/v/v after optimizing the mobile phase composition, chromatogram was recorded and shown in Fig. 4.
Fig. 4: Chromatogram showing the degraded products in Basic degradation.
c. Wet heat degradation
Accurate 10 ml of pure drug sample was transferred to a clean and dry RBF. 30 ml of HPLC grade water was added to it. Then, it was refluxed in a water bath at 60°C for 6 hours uninterruptedly. After the completion of reflux, the drug became soluble and the mixture of drug and water was allowed to cool at room temperature.
Mehdi et al. World Journal of Pharmaceutical and Life Sciences
Fig. 5: Chromatogram showing the degraded products in Wet heat degradation.
d. Oxidation with (3%) H2O2
Approximately 10 ml of pure drug sample was transferred in a clean and dry 100 ml volumetric flask. 30 ml of 3% H2O2 and a little methanol was added to it to
make it soluble and then kept as such in dark for 24
hours. Final volume was made up to 100 ml using water to prepare 100 ppm solution. The above sample was injected into the UPLC system. The chromatogram was recorded and shown in Fig. 6.
Fig. 6: Chromatogram showing the degraded products in H2O2.
In all degradation studies, there was a significant formation of degradation products when compared to that of a standard. This indicates that, the drug may be
Table 7: Forced Degradation study for the developed method.
Nature of Stress Degradation condition Time(h) Number of degradation products (Rt)
Acidic 60°C 3 3 (0.512, 1.313, 1.878)
Basic 60°C 9 1 (2.921)
Oxidative RT 48 1 (1.128)
Wet Heat 105°C 24 3 (4.192, 4.783, 5.011)
4. CONCLUSION
A specific, sensitive and selective forced degradation UPLC method has been validated for the analysis of Flunixinin bulk dug and parenteral dosage form. Based on peak purity results, obtained from the analysis of force degradation samples using described method, it can be concluded that the absence of co-eluting peak along with the main peak of Flunixinindicated that the developed method is specific for the estimation of Flunixinin presence of degradation products. Further the proposed UPLC method has excellent precision, sensitivity and reproducibility. Even though no attempt has been made to identify the degraded products, proposed method can be used as forced degradation method for assay of Flunixinin commercial formulations.
5. ACKNOWLEDGEMENTS
The authors are thankful to Active Pharma Labs (Hyderabad, India) for providing gift sample of Flunixin.
6. REFERENCES
1. Flunixin. The American Society of Health-System Pharmacists. Retrieved Dec 2, 2015.
2. Hamilton, Richart Tarascon Pocket Pharmacopoeia 2015 Deluxe Lab-Coat Edition. Jones & Bartlett Learning, 2015; 451. ISBN 9781284057560. 3. Sangita B. Gavitre*, Dr. Ashok P. Pingle,
Nanasaheb R. Kale, Javed A. Mirza., RP-HPLC Assay Method Development and Validation of Flunixin in Metered Dose Inhaler- A Research; World Journal of Pharmacy and Pharmaceutical Sciences, 3(8): 2193-2206.
4. M Blessy, , Ruchi D. Patel, Prajesh N. Prajapati, Y.K. Agrawal; Development of forced degradation and stability indicating studies of drugs—A review; Journal of Pharmaceutical Analysis, June 2014; 4(3): 159–165.
5. S. Singh and M. Bakshi. Guidance on conduct of stress tests to determine inherent stability of drugs. Pharm. Technol, 2000; 26: 24–31.
6. ICH guidelines, Q1A (R2): Stability Testing of New Drug Substances and Products (revision 2), International Conference on Harmonization. Available from:〈http://www.fda.gov/downloads/ Regulatory Information/ Guidances/ ucm128204. pdf〉, 2003.
7. USP-NF; Validation of Compendial Procedures; General Chapters, 2010; 1: 734-736.
8. Fifeld .F W.; Kealey D.; Principal and practice of analytical chemistry; USA Blackwell publishing; 5th edition, 2004; 2: 5-7.
9. Dudhasia K.R.; Patel A.V.; Patel C.N.; Development and Validation of a Reversed phase HPLC Method for Simultaneous Estimation of Clotrimazole and Flunixin in lotion and cream dosage form; Journal of Chronicle of Young Scientist, 2014; (3): 1-107. 10. Reddy U.M.; Reddy K.H.; BObbarala V.;
Penumajji., Determination of Flunixin , Clotrimazole, Chloramphenocol, Lidocaine, in Pharmaceutical Formulations using a novel RP-HPLC method. International Journal of Pharma and Biosciences, 2011; 2(3): 453-462.
11. Prajapati N. B.; Dey S.S.; Dr. Upadhyay U.M.; Development and Validation of RP-HPLC Method for Simultaneous estimation of Salicylic acid and Flunixin in their Bulk and Combined Dosage form; International journal of Pharmaceutical Research and Development, 2013; 5(3): 1-50.
12. David A. Williams, William O. Foye, Thomas L. Lemke; Foye's principles of medicinal chemistry; 6th Ed Wolters Kluwer Health, 2008; 698-728. 13. B. Srivastava, B. K. Sharma, Uttam Singh Baghel,
Yashwant, NehaSethi. Ultra Performance Liquid Chromatography (UPLC): A Chromatographic Technique.Int. J. Pharm. Quality Assurance, 2010; 2(1): 19-25.
14. Nguyen D.T., Guillarme D, Rudaz S, Veuthey J. L., Fast Analysis In Liquid Chromatography Using Small Particle Size And High Pressure. J Sep Sci., 2006 Aug; 29(12): 1836-48.
15. Katharina Sterz, Gerhard Scherer, Josef Ecker. A Simple and Robust UPLC-SRM/MS Method To Quantify Urinary Eicosanoids.J Lipid Res., 2013; 1-28.
16. Ashok kumar, UPLC: A preeminent technique in pharmaceutical analysis. Acta poloniae pharmaceutica– drug research, 2012; 69(30): 371-380.
![Fig. 1: Molecular Structure of Flunixin, 2-[[2-Methyl- 3-(trifluoromethyl) phenyl] amino] pyridine- 3-carboxylic acid.[12]](https://thumb-us.123doks.com/thumbv2/123dok_us/9785737.1964082/1.595.313.537.495.620/molecular-structure-flunixin-methyl-trifluoromethyl-phenyl-pyridine-carboxylic.webp)