Copyright © 2007-2008, Usability Professionals’ Association and the authors. Permission to make digital or hard
Beyond
Jed R. Wood Co-Founder LimeChile, LLC [email protected]
Larry E. Wood Principle Parallax, LLC [email protected]
History and Assumptions
Card sorting was originally developed by psychologists as a method to the study of how people organize and categorize their knowledge. As the name implies, the method originally consisted of researchers writing labels representing concepts (either abstract or concrete) on cards, and then asking participants to sort (categorize) the cards into piles that were similar in some way. After sorting the cards into piles, the participants were then asked to give the piles a name or phrase that would indicate what the concepts in a particular pile had in common.
In the world of information technology, information architects and developers of desktop and Web-based software applications are faced with the problem of organizing information items, features, and functions to make it easier for users to find them. Card sorting can be an effective means of discovering the optimal organization of information for potential users’ viewpoint.
Unfortunately, the development and practice of card sorting in information technology has been driven mostly by opinion and anecdotal experience, with little influence from
systematic research. As a result, many of the decisions faced by developers in conducting a card sort study are based on analogy to seemingly similar arenas (e.g., survey
Number of Participants
Current practice:
Because of the similarity between card sorting and survey research, it is assumed by many researchers that the more participants that can be recruited for the card sorting task, the more valid the results will be. However, in addition to the increased effort and the logistical issues that might be involved in recruiting a large number of participants, a much greater effort is required to analyze a large body of data. Interestingly, the one study that has been published (Tullis & Wood, 2004) on this question indicates that useful results can be obtained with fewer participants than one might otherwise suppose.
Recommendation:
As few as 25-30 participants will likely yield results similar to those of several hundred, provided these participants are representative of actual users and are familiar with the domain being considered. Thus, researchers could save time and money, not to mention the headache of analyzing all the extra data.
Participant Instructions
Current practice:
When psychologists began to use card sorting as a methodology to study conceptual and category structures, they were careful to give non-directive instructions (e.g., “There is no right set of categories. Just group things together that seem to be similar in some way.”) because they were concerned about biasing participants. Unfortunately, some information technology researchers have carried that practice over into current card sorting work.
Recommendation:
Avoiding bias is generally a noble goal, but this seems to counter the purpose of gathering information that is relevant to the goal of making it easier for users to navigate through Web pages. Hence, researchers should be explicit about the intended purpose of conducting the card sorting study (e.g., “Please group these items as you would expect to find them on our
corporate intranet”).
Participants’ Complete Understanding of Items
Current practice:
Far too many information technology researchers are overly optimistic about their participants’ familiarity with the items.
Recommendation:
Because it is impossible to guarantee that all participants will have a common understanding of the domain items, it is helpful to provide more detailed descriptions of the items to be sorted. In early research by psychologists, it was a common practice to include the description of an item on the back of the item card. Then participants could simply turn the card over and review the description to make certain they were thinking about the item in the intended manner. We strongly recommend that item descriptions be provided, even in the most promising situations (e.g., a corporate intranet with employees as participants).
Open vs. Closed Sorting Tasks
card sorting project. The assumption seems to be that the existing structure is close to optimal—it just needs some minor adjustment.
Too frequently in our experience, researchers are convinced they have a list of categories that is useful, but just needs some minor adjustment. However, they have little or no evidence related to whether or not potential users are of the same mind. In the extreme, we know of a project in which users refused to participate because they experienced such difficulty in making
meaningful sense of the categories in which they were asked to sort a set of content items.
Recommendation:
Begin research with an open sort. Only after carefully analyzing the data should a closed sort be conducted for validation. If the decision is made to begin with a closed sort, make it simple and be prepared to obtain less-than-optimal results.
Data Analyses
Current practice:
The ability to analyze card sorting data is a “touchy-feely” qualitative experience that can’t be described beyond “eyeballing” and “looking for trends.” Eyeballing the data is very tedious, time-consuming, and idiosyncratic, which results in a procedure or method that is not reliable. It works well when there are only five participants and a small set of items, but not so well with 30+ participants and a hundred items. While this general method can be useful as an auxiliary aid, we prefer to begin with the more formal cluster analysis and resulting tree diagram.
Recommendation:
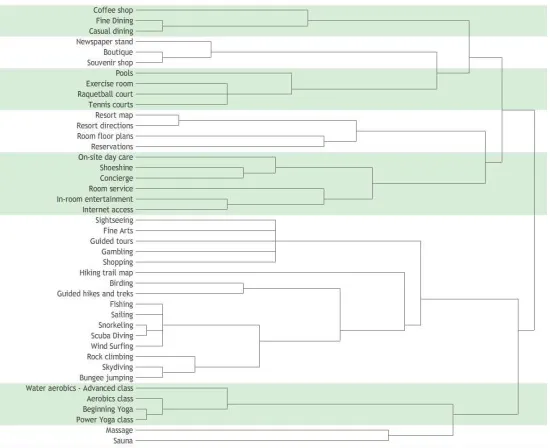
Cluster analysis is a statistical procedure developed to analyze similarities and differences in the ways people categorize sets of domain items. The results can be used to produce a hierarchical tree diagram (formally called a dendrogram), an example of which is shown in Figure 1. While there are a number of cluster algorithms (Romesburg, 1984), we prefer a simple one based on the frequency with which content items are placed in the same category across all participants in a card sorting project. Essentially, the tree represents an average of the groups or categories produced by each of the card sort participants. It works on the principle of the similarity of each item to every other item, as sorted by the participants.
Figure 1. Sample hierarchical tree diagram
Issues Needing Additional Research
There are several other practices that could benefit from additional research. The following sections present a few practices that are on our agenda.
Sort just a few
Issue:
Most Web sites have sufficient content to produce very long lists for participants to sort. This, in turn, results in such a long list of domain items that it is questionable to expect participants to reliably perform the task.
Proposed research:
To shed some light on this issue, Tullis and Wood (2005) reported that useful results can be obtained by having participants sort a random sample of items, so long as enough participants are gathered to sufficiently cover the full set of items. We’re interested in pushing the
boundaries of these findings. What if a randomly selected single item is given to thousands of participants in a closed sort? How might the results differ from those of participants that have the context of a larger set of items?
Finding vs. sorting
Issue:
categories. In the second study, participants would be given the list of categories but only one of the items for which to choose a category.
Take your time vs. hurry up
Issue:
It’s common for us to observe researchers including phrases such as “take your time and carefully consider…” in the pre-sorting instructions provided to participants. However, we argue that users of the Web typically aren’t particularly cautious when browsing, which calls into question whether encouraging card sorting participants to be cautious is appropriate.
Proposed research:
One recent study we conducted encouraged just the opposite of cautious card sorting. We encouraged participants to “sort the items reasonably quickly.” Early results indicate that there isn’t a substantial difference. Furthermore, it’s worth considering that “reasonably quickly” is a better match for how most people browse and search on Web sites—clicking the first link that seems like it will yield satisfactory results. We plan to conduct additional studies relevant to this issue.
Multi-level sorting
Issue:
Given that all but the simplest of information hierarchies consist of more than two levels, it seems logical to allow participants to sort items into multiple levels. However, a difficulty arises during analysis. If “eyeball analysis” of single-level sorting is problematic with large numbers, then adding multiple levels exacerbates the problem. Though cluster analysis can be made to work with multiple levels, the amount of variation introduced can easily bring out the weakness of cluster analysis—the fact that it’s essentially an “average.”
Proposed research:
Because of the difficulty with data analysis mentioned previously, we have recommended a staged approach for obtaining a multi-level architecture. That is, first conduct a typical single-level sort, analyze to find a preliminary set of categories, and then use those categories as
items in a second card sorting study. However, many researchers seem to believe it would be desirable to ask participants to create second level categories as well as first level categories all in one task. Even though we haven’t yet found solutions to the analysis problems, we plan to continue to address this issue.
Summary
Given its origin in the investigation of knowledge organization and category structure, the methodology of card sorting has come a long way in the world of information technology. Card sorting has been a very useful method for gathering useful information from potential Web site users related to the most useful information architecture of a Web site and for the organization of features in an application, whether Web-based or resident on a desktop computer.
References
Romesburg, H. C. (1984). Cluster Analysis for Researchers, Lifetime Learning Publications. Tullis, T. & Wood, L.E. (2004). How Many Users Are Enough for a Card-Sorting Study? Poster
presented at the Annual Meeting of the Usability Professionals Association, June 10-12, Minneapolis, MN.
Tullis, T. & Wood, L.E. (2005). How Can You Do a Card-sorting Study with LOTS of Cards? Poster presented at the Annual Meeting of the Usability Professionals Association, June 24-July 1, Montreal, QB, Canada.
About the Authors
Jed R. Wood Jed is an interaction designer and
entrepreneur. He bridges the gap between design and programming through a deep respect and talent for both. In addition to working on WebSort with Larry, Jed works on other Web applications as a founding partner of LimeChile. He holds a Master's degree from the Institute of Design, where he serves as adjunct faculty member.
Larry E. Wood