Impact of sediments and constructions on river
flooding in Coimbra, Portugal
J. A. Sá Marques
1, Nuno Simões
1, Lucas Maluf
2, F. S. Santos
2, J.M.P.
Vieira
3, J.L.S. Pinho
3, L. Vieira
31 INESCC, Department of Civil Engineering, University of Coimbra, Rua Sílvio Lima. Pólo II,
3030- 790 Coimbra, Portugal
2 Department of Civil Engineering, University of Coimbra, Rua Sílvio Lima. Pólo II, 3030- 790
Coimbra, Portugal
3 Department of Civil Engineering, University of Minho, 4710-057 Braga, Portugal jasm@dec.uc.pt
Abstract
In Coimbra city, Portugal, the riverbanks have suffered several floods events in the past, due to its hydrological regime, the low slope and consequent lack of capacity of the Mondego River in its final 30 km. The construction of several dams in the upstream part of the river catchment has improved the use of the hydraulic capacity of the river system and reduced the number and intensity of flooding events in Coimbra. Nevertheless, intense rainfall events combined with inadequate procedures of the dam operation rules and lack of monitoring of sediments dynamics can still originate inundation in Coimbra such as those registered between 9th and 11th of January 2016. This work presents modelling scenarios demonstrating the influence of the sediment accumulation into the riverbed and its effect on the water levels. It also presents the influence that piers from a new bridge can have into the river flow dynamics.
1
Introduction
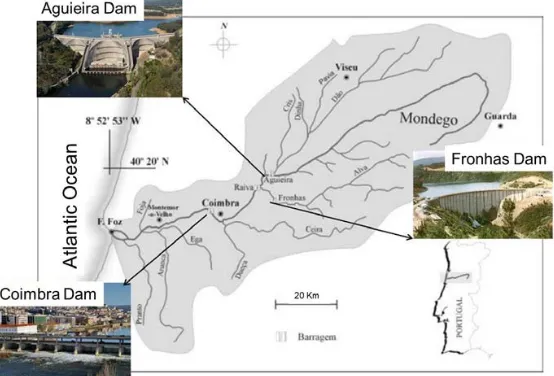
Historically, the region of Coimbra has suffered from frequent flooding events caused by the Mondego River that crosses the city. In the 70s, a large plan of constructions started and several dams were built: Aguieira Dam, Fronhas Dam, Raiva Dam and Coimbra Dam (Figure 1) (Hidroprojecto, 1978). These constructions have significantly reduced the occurrence and magnitude of inundation downstream. Nevertheless, intense rainfall events combined with inadequate procedures of the dam operation and lack of monitoring of sediments dynamics can still originate significant floods in the river banks in Coimbra, such as the ones registered in 2000, 2001 and 2016.
Although these floods were smaller than the ones before the construction of the dams, they have reached important infrastructures of the city, such as the Choupalinho and Parque Verde recreational
Engineering Volume 3, 2018, Pages 1814–1821
areas, and the Santa Clara Monastery, a historical touristic area. On the other hand, a new bridge was built with its piers foundations on the riverbed, and extraction of sediments at this river section was cancelled since the 90s (Martini et al., 2004).
This paper presents the methodology and results from the simulation of the river floods from January 2016 in Coimbra. It evaluates the impact of the river bed (bathymetry) and the effect of the piers of the new bridge in the water levels and consequent flooding areas.
2
Case Study
The Mondego river has a 258 km extension, it starts at an altitude of 1525 m (Serra da Estrela) and ends at the Atlantic Ocean near the city of Figueira da Foz. The catchment has an area of 6644 km2,a Mediterranean climate with strong seasonal flow variation, well-defined drought and wet periods oscillating from an annual average of 1213 hm3 in a dry year to a 4032 hm3 in a rainy one.
The main tributaries of Mondego River are Dão, Alva and Ceira rivers. Aguieira Dam is located on the Mondego River and Fronhas Dam in Alva River. Near the city of Coimbra, Mondego also receives a contribution from the Ceira River. In Coimbra, there is a multi-purpose mobile dam- bridge that creates a water mirror (small reservoir) (Figure 1). The hydraulic behaviour of the system is strongly affected by the operational rules of the upstream Aguieira Dam (INAG, 2011).
3
Methodology
In this study, the following information was used: topography of the flooding area; river bathymetry from 2001 and 2008 (which was the most recent available); flows from 2001 and 2016 floods; water level records from the flooding event of 2001; river cross sections; operational rules of the Aguieira Dam and; the rating curves at Coimbra Dam.
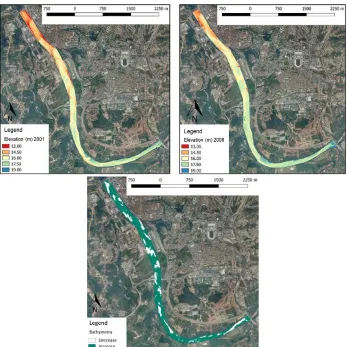
The digital elevation model was build taken into account the different topographic information from the critical area in Coimbra. To study the effect of the batimetry, two different input files for the
hydrodynamic model were built: one was originated coupling the DEM with the bathymetry file of 2001 and the other the DEM with the bathymetry file of 2008.
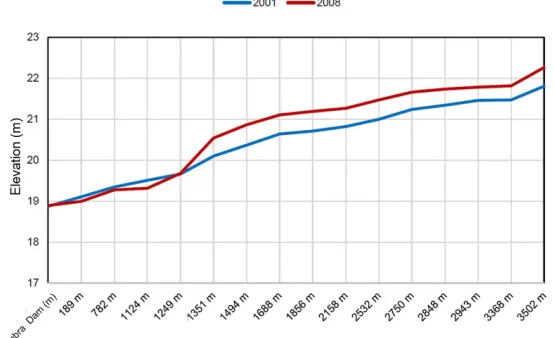
Figure 2 shows the bathymetry of the river in the study area in the years of 2001 and 2008. Due to the flat profile of the river bed in Coimbra city, there is a considerable accumulation of sediments, elevating, in average, the river bed profile aproximattely 0.50m to 1.00m in some locations.
The hydrodynamic modelling was a combination of 1D and 2D modelling, using the Saint-Venant equations (Chanson, 2004). The upper part of the catchment from the Aguieira Dam to Coimbra is a narrow valley. Consequently, the hydraulic modelling was done using 1D approach, using crossectional river information. The critical area (Coimbra) was analysed using a 2D approach. Figure 3 represents an overview of the hydrodynamic modelling approach. The 2D model received the 1D outflow as the upstream boundary condition. The downstream boundary condition was represented by the rating curves of Coimbra Dam. The boundary conditions (river inflows) were given by the records of Aguieira and Fronhas Dams discharges and by records in existing hydrometric stations (SNIRH, 2016). Also, the contribution given by the Ceira River into the Mondego River was represented as a lateral inflow using recorded flow information.
Figure 3 Hydrodynamic modelling approach 1D + 2D
The record of the river flow at Coimbra in the events of 2001 and 2016 are presented in Figure 4.
Figure 4 Hydrographs 2001 and 2016
4
Model Calibration
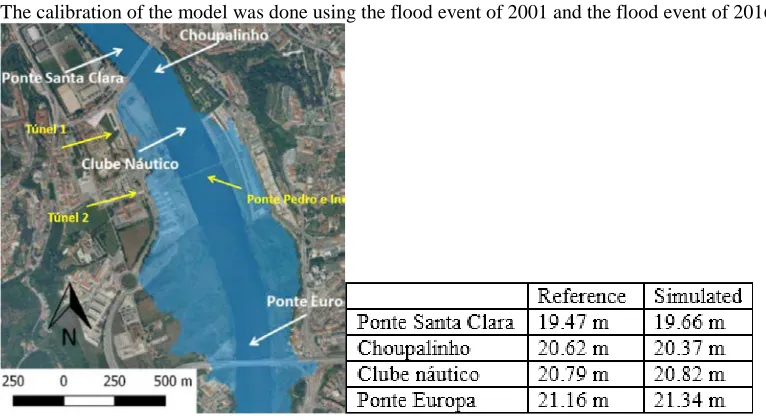
The calibration of the model was done using the flood event of 2001 and the flood event of 2016.
Firstly, the model calibration was done using reference values from the flood event of 2001. For this purpose, four control sections were established with reference values: Ponte de Santa Clara, Choupalinho, Clube Náutico e Ponte Europa (Figure 5).
Additionally, the resulting floodplain was compared with a previous study, (Santos et al., 2002).
Figure 6 Floodplain estimated in Seabra et al., 2002 followed by the Floodplain of the new simulation and the overlapping of both scenarios
Secondly, the flooding of January 2016 was simulated using the most recent bathymetric (2008) and the hydrograph of 2016. The main objective was to demonstrate that the flow condition generated during that event were able to represent the floodplain inundation correctly.
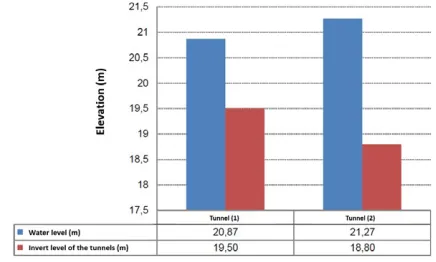
This event caused floods in the important historical area of Coimbra. To cause that inundation, the water would have to flow through pedestrian tunnels that links inundated areas to the river under a road located along the left river bank. The comparison between the level of the tunnel base and the river level evidence that the water levels were high enough to cause such inundation by the water flowing through the tunnels (Figure 7).
Figure 7 River water level compared with the tunnels invert level.
match with previous results. The simulation of 2016 enable to validate and improve the calibration of the 2016 event. The calibration of these events was challenging due to the usual uncertainty in the runoff quantification and the lack of a more recent bathymetry.
The calibrated model was then used to make the proposed analysis and comparisons:
• Evaluation of the impact of the river bed (bathymetry) into the water level during the flooding event.
• Analisys of the flow dynamics around the pillars of the new bridge.
• Simulation of different maximum flow profiles as upstream boundary conditions and its consequences for Coimbra.
5
Results
Results section will present bathymetric analysis, evaluation of the rainfall event of January 2016 and its consequences, the flow dynamics around the pillars of the bridge and analysis the impact of different maximum flow profile into the inundated area at Coimbra
5.1
Bathymetric influence on water depth
Results of two simulations were compared, considering identical simulation parameters, using the hydrograph of 2001 as an upstream boundary condition, and two different river bed profiles. The first simulation used the bathymetry from the year of 2001 and the second simulation used the 2008 bathymetry. Figure 8 presents the water level longitudinal profile for both simulations. It can be seen that the accumulated sediments between 2001 and 2008 have a significant impact on the water levels, increasing the water level in approximatelly 0.5m. This means that for identical flood discharges higher river water levels are reached along the urban river stretch.
Figure 8 Water level longitudinal profile with bathymetry files from 2001 and 2008
5.2
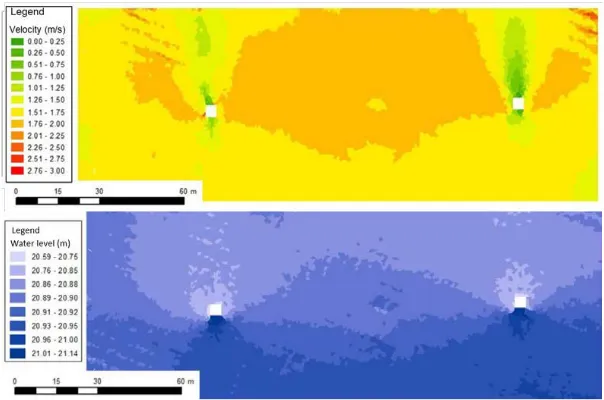
Flow dynamics around the piers
piers of the bridge (Figure 9) and that the water levels are higher on the upstream part of the structure. Moreover, local scour problems may occur at the piers foundations at this location.
Figure 7 Velocity and water level profiles around the piers of the bridge
5.3
Flooding areas for different maximum flow
Results from a simulation that considers the most recent bathimetry (2008), a triangular flood hydrograph with a peak flow of 2000 m3/s and a total duration of 20 hours, has shown that the area
around Coimbra starts to be inundated when the flow reaches approximately 700 to 750 m3/s, instead
of the 1200 m3/s (the original design value). Around 1000 m3/s an important recreational area called
Choupalinho is affected. For flows greater than 1400 m3/s the majority of the recreational zone between
the two bridges are inundated (Figure 10).
6
Conclusion
The combined 1D/2D hydrodynamic modelling approach was effective to simulate the flood inundations of a urban river stretch. The method that made use of the complexity of the 2D model just in the interest zone was able to simulate different historical observed flood scenarios.
The study was able to demonstrate that sediment accumulation on the river bed affects the water level profile significantly along the river. Consequently, it is important to monitor the river bathymetry in such a flood-prone region. Bridges and structures can increase the flow resistance and consequently increase the risk of flooding upstream their location.
The event of January 2016 has highlighted the needs of additional flooding protection measures to prevent the historical area from being inundated.
Flood studies should be updated frequently, following changes in sediment accumulation and/or the construction of new hydraulic structures into sensitive areas of flood vulnerable water system.
Acknowledgement
This research was partially supported by the Portuguese Environmental Agency and the Portuguese National Association of Engineers.
References
Hidroprojecto (1978) Regularização do Baixo Mondego. Açude-Ponte de Coimbra. Projecto base. Volume 3. Estudos hidráulicos. MESA-DGSH-DSAH.
Martini, P., Carniello, L. and Avanzi, C.,Two dimensional modelling of flood flows and suspended sediment transport: the case of the Brenta River, Veneto (Italy), Natural Hazards and Earth System Sciences (2004) 4: 165–181
INAG (2011) Ofício SAI-DOPS/2011/45 do Departamento de Obras, Protecção e Segurança – Divisão de Segurança de Barragens sobre “Sistema Aguieira-Raiva-Fronhas. Revisão das normas de exploração das albufeiras e dos orgãos de segurança. Estudos de Base. Doc. EDP 2171-P1358/07.”
Chanson, H., The Hydraulics of Open Channel Flow: an Introduction, Butterworth-Heinemann, Oxford, UK, 2nd Edition, 2004.