Advanced Ceramics Progress
J o u r n a l H o m e p a g e : w w w . a c e r p . i r
Preparation and Characterization of TiO
2Nanoparticles Prepared by Sol-Gel
Method
F. Mirjalilia, S.A. Manafi*b, I. Farahbakhshc
aDepartment of Materials Engineering, Maybod Branch, Islamic Azad University, Maybod, Iran. bDepartment of Engineering, Shahrood Branch, Islamic Azad University, Shahrood, Iran. cDepartment of Engineering, Quchan Branch, Islamic Azad University, Quchan, Iran.
P A P E R I N F O
Paper history:
Received 10 October 2017
Accepted in revised form 12 December 2017
Keywords: CTAB
TiO2 Nanoparticles sol-gel Method TEM
A B S T R A C T
In this study, TiO2 nanoparticles have been synthesized by sol-gel method in which aqueous solutions
of titanium isopropoxide and ethanol were used to prepare the titania sol. CTAB and Span 20 were used as the surfactant stabilizing agent. Then, the effects of the different parameters such as pHs, stirring times, surfactants and temperatures on TiO2 nanoparticles were studied. The X-ray diffraction
(XRD), Fourier transforms infrared spectroscopy (FTIR), and transmission electron microscopy (TEM) analyses were used to characterize the samples. The observations revealed that the pH of 3.5 and 36 h stirring time could provide dispersion without agglomeration with rutile and anatase phases. However, at higher pH, the powder resulted in the formation of anatase phase. Using CTAB as a surfactant could modify the shape, size, and provide better distribution of TiO2 nanoparticles compared with that of the
Span 20 as a surfactant. Finally, the nanopowder was calcined at 450, 550 and 650 °C. It obviously showed that by increasing the temperature, the size of the nanoparticles increases to 30 nm which might be due to acceleration in the crystal growth of titanium dioxide at high calcination temperatures.
1. INTRODUCTION1
Titania is a very well-known and well-researched material due to the constancy of its chemical structure, biocompatibility, physical, optical, and electrical properties. Its photocatalytic properties have been used in various environmental applications to remove contaminants from both water and air [1]. TiO2 has
three polymorphic forms of crystal structure namely brookite, anatase and rutile. Among other factors, this variation of applications of titanium dioxide is possible because of the properties like high stability, low cost, and non-toxicity [2].
Titania is usually utilized in the form of nanoparticles in suspension for the high catalytic surface area and activity [3]. However, TiO2 nanoparticles in suspension
are difficult to handle and are eliminated after being used in water and wastewater treatment [4]. TiO2
nanostructures show an outstanding physiochemical properties, significantly different from bulky structure, like large specific surface area, extremely small size of
1*Corresponding Author’s Email:ali_manafi2005@yahoo.com (S.A.
Manafi)
particles, and quantum size effect [1,5]. Recently, there has been considerable interest in the synthesis of titanium dioxide nanoparticles.
Over the past decade, the synthesis and
functionalization of one-dimensional nanostructural materials have become one of the most highly energized research areas. Several methods have been used to synthesize nanosized TiO2, such as sol-gel,
hydrothermal, solvothermal, sonochemical, direct oxidation, electrodeposition, micelle and inverse micelle usage, emulsion or hydrolysis precipitation, chemical/physical vapor deposition, microemulsion processes, microwave approaches and ultrasonic [6-9]. These various studies consisted enormous number of varieties containing materials, experimental tools, instrumentations and experimental conditions. Consequently, researchers have to go through various preparation methods to get TiO2 samples of certain
preferred characteristics. [6-8,10]. Among the numerous preparation techniques, sol- gel is considered as one of the simple methods for synthesizing nanoparticles at ambient conditions. Besides, it does not require complicated set-up and the experimental conditions can be controlled easily [9,11,12].
In common sol-gel methods for preparing TiO2 material,
highly reactive alkoxide titanium precursors are violently hydrolyzed and further condensed to form the Ti–O–Ti network [5,8,9].
In sol-gel processes, TiO2 is usually arranged by the
reactions of hydrolysis and polycondensation of titanium alkoxide, (TiOR)n to form oxo-polymers, which are transformed into an oxide network [1,13]. These reactions can be schematically represented as follows:
Hydrolysis:
M(OR)n + H2O → M(OR)n-1(OH) + ROH (1)
Condensation and Dehydration:
M(OR)n + M(OR)n-1 → M2O(OR)2n-2 + ROH (2)
Dealcoholation:
2M(OR)n-1(OH) → M2O(OR)2n-2 + H2O (3)
The overall reaction is
M(OR)n + H2O → MOn/2 + nROH (4)
where M= Si, Ti, Zr, etc. and R = alkyl group. The relative rates of hydrolysis and polycondensation strongly influenced the structure and properties of metal oxides. Factors that are crucial in the formation of metal oxides include reactivity of metal alkoxides, water to alkoxides ratio, pH of the reaction medium, nature of solvent and additives and reaction temperature. By varying these process parameters, materials with different surface chemistry and microstructure can be obtained [1,13,14].
Jimmy et al., investigated dispersion of nanoparticles using different methods which have become an essential and challenging issue [10]. In this regard, the tendency to coagulate can be defeated through the following methods: 1) Electrostatic revulsions between similarly charged particles, resulted from the creation of an electric double-layer, 2) Repulsive steric forces improving dispersion of solid particles by addition of organic mixtures, based on the interaction between the adsorption layers of admixture and 3) electrostatic mechanism generated by polyelectrolytes [10,11]. Behpour et al., [8] also described the effect of dispersants type and concentration on dispersion of two marketable and one synthesized titania nanopowders. They took the advantage of zeta-potential measurement and particle size distribution to characterize the nano titania suspensions.
In spite of a simplicity of sol-gel technique, some drawbacks limit its performance in nanoparticles synthesis such as spontaneous aggregation of primary particles, and small surface area of synthesized TiO2
nanoparticles [13,15]. Therefore, one of the characteristic property of titanium dioxide is its ability to aggregate into large particles via chemical bounds
[14,16]. Using the surfactants and different stirring time is the most effective method for preventing aggregation and powerful method for dispersing the particles in heterogeneous systems [1,17].
Most consideration in prior studies was concentrated on clarifying the response mechanisms and applying this simple methodology [15,18].
Previously, it was found that the anatase phase began to appear upon the calcination of the hydrolyzed species of titanium alkoxides at 450 °C for 3 hours [19]. However, minor change in parameters such as pH, calcination temperature and stirring time considerably affect the TiO2 characteristics. Consequently, different
crystallinities and structures of TiO2 can be achieved by
controlling such parameters. Moreover, little work has been devoted to the fabrication of highly crystalline TiO2 materials through a new synthesis method using
surfactant molecules as a pore directing agent along with different stirring time-based sol–gel route. To this end, the novelty of this report is to obtain the optimum pH and stirring time and then modify the TiO2
nanoparticles with different surfactants and different calcination times.
2. MATERIALS AND METHODS
TiO2 nanopowders were prepared by solution sol-gel
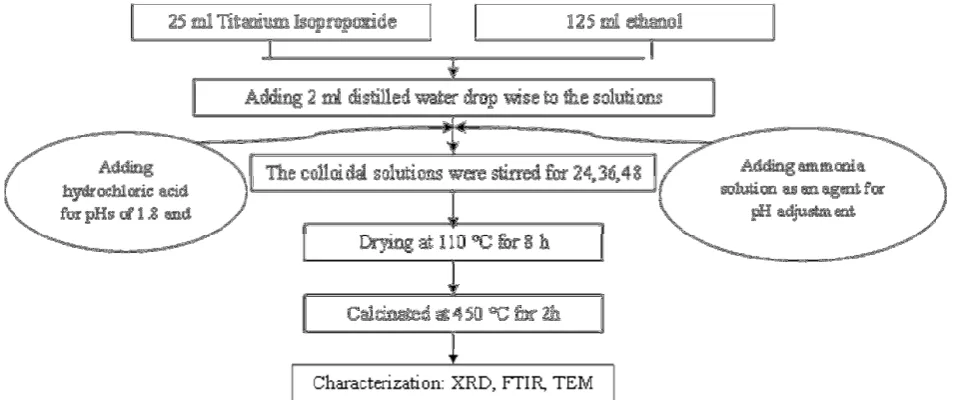
method using titanium isopropoxide (TTIP, 98%, Merck) with Ethanol (99.5%, Merck) and ammonia solution (25%, Merck) and hydrochloric acid (HCl, 25%, Merck) as the agent for pH adjustment as previously reported [15,20]. The suspensions of 2.5 ml titanium isopropoxide with 12.5 ml ethanol were vigorously stirred at 25 °C. After that, 2 ml distilled water was slowly added dropwise to the solution to form colloidal solution under vigorous stirrer and the resulting solution was stirred for different stirring times (24, 36, and 48 h) with adjusted different pH values of 1.8, 3.5, 7, 9 and then, the colloidal solution was dried in an oven at 110 °C for 8 h, and the obtained xerogel was calcinated at 450 °C for 2 h as shown in Fig. 1. In the next part, for enhancing the properties, the effect of two surfactants (CTAB, Merck and Span 20, Merck) was investigated. The suspensions of ethanol with certain amount of surfactants (CTAB and Span 20) were vigorously stirred at 25 °C for 1 h. After that, the suspension of 2.5 ml titanium isopropoxide was added to the above solutions and then, 2 ml distilled water was slowly added dropwise to the solutions to form colloidal solution with adjusted pH and dried and the resulting solution was stirred for 36 h and calcinated at 450, 550 and 650 °C for 2 h.
Phase identification was performed by X-ray diffraction (XRD, PW1800, Philips) using nickel-filtered Cu-Kα
spectroscopy (FTIR, Perkin Elmer Spectrum 100) was conducted by the universal attenuated total reflection (UATR) method. Microstructures and morphology of
powders were identified by transmission electron microscopy (Philip Netherlands).
Figure 1. Flow chart for preparation of TiO2 nanopowders
3. RESULT AND DISCUSSION
The XRD patterns of the TiO2 nanopowder with
different pH (1.8, 3.5, 7, 9) are illustrated in Fig. 2. The sharp peaks emerged in the XRD pattern for pH of 1.8, 3.5 and 7 correspond to both anatase and rutile phases which is in agreement with Joint Committee on Powder Diffraction Standard (JCPDS) card PDF No. 76-1940 and 21-1272, respectively [21]. However, with increasing the pH from 7 to 9, only anatase phases remained. It can be seen that with increasing the pH from 1.8 to 9, the peak intensity of anatase phases at 19, 25, 37 and 47° was increased. Thus, the pH is expected to play a significant controlling role in the selective crystallization of anatase phase during sol-gel process [18,22]. This mechanism might be explained using the concept of partial charge model [1,19].
Figure 2. XRD patterns of nanocrystalline titania samples prepared by sol-gel method with various pH condition
According to this model, hydrolysis of titanium cation was occurred at strong acidity condition. In this condition, a stable species of [Ti(OH)(OH2)
5
]3+ would be formed, however; due to the positive charge of hydroxo group, these species were not able to condense. When acidity is not sufficiently low to stabilize this precursor, deprotonating would take place, forming new species of [Ti(OH)2(OH2)5]2.
However, these species also did not reduce probably because of spontaneous in intramolecular oxidation to [TiO(OH2)5]
2+
[1,15,23]. Condensation to both anatase and rutile started when the solution movement was
adequate to allow further deprotonating to
[TiO(OH)(OH2)4]+, which could undertake inter
molecular deoxolation of [TiO(OH)3(OH2)3] +
depending on exact pH value. In lower pH region, deoxolation did not occur and oxidation led to linear growing along the equatorial plane of cations [1,19,24]. This led to rutile formation due to oxidation between resulting linear chains. Meanwhile, in higher pH values, when deoxolation occurred, condensation could progress along the apical direction and led to the twisted chain of anatase structure. [1,13,25]. The higher acidity provided rutile formation and lower acidity led to anatase formation. For these reasons, anatase and rutile phases were found in pH range of 1.8 to 7, but by increasing of pH from 7 to 9, only the anatase phase was created. The crystallite size of TiO2 with various pH was also
The equation is as follows:
t=0.89λ/βcosθ (5)
where, t is grain size, λ is the wavelength, β is peak width chosen at half height in radians and θ is the angle in degrees [10,15,26].
β= (βm2- βs2)1/2 (6)
where βm, is the peak width at half-maximum of the
sample and βs is the peak width at half-maximum of the
standard sample.
TABLE 1. The crystallite size of TiO2 nanoparticles at
different pH
pH β (RAD)
(°)
(nm)
1.8 0.0032 25.39 43 3.5 0.0039 25.33 36 7 0.0029 25.38 48 9 0.0026 25.41 53
It is observed that, by increasing the pH from 3.5 to 9, the crystallite size of TiO2 was increased.
According to several studies, the variety of TiO2 surface
charge was pH dependent. TiO2 in sols possessed
electrical charge because of the absorption of H+ or OH- in aqueous suspension. According to Saja et al. [1], the surface charges of TiO2 could be determined by
chemisorption of:
For H+, TiO2+nH+↔TiO2Hnn+ for pH <IEP (7)
For OH-, TiO2+nOH
↔TiO2(OH)nn
for pH > IEP (8)
Moreover, the researchers concluded that the dispersed nanoparticles in a solvent tend to agglomerate and the electric potential is developed by an electric double layer called Zeta layer which is consisted of inner and outer layers. When all the particles have the same electrical charges they tend to separate and do not agglomerate and the repulsion of deposited particles is directly proportional to the zeta potential. When the zeta potential of solution is higher than +30 eV or lower than -30 eV, the solution is stable. Furthermore, the Zeta potential is reduced by increasing the pH to a point where the zeta potential reached zero, which is named as isoelectric point (IEP) [12,17,27].
For these reasons, the best dispersion condition of nanoparticles was seen at pH=3.5. The value of the zeta potential was decreased at higher potential. It causes a reduction of potential difference between the separated phases and its surrounding. Therefore, this was the main reason for the repulsion between the TiO2 nanoparticles.
At this condition, the Van der Waals forces were increased and resulted in agglomeration of TiO2
nanoparticles. Taken together, the pH=3.5 is the best pH for preparing the TiO2 nanoparticles.
The XRD patterns of TiO2 nanoparticles with different
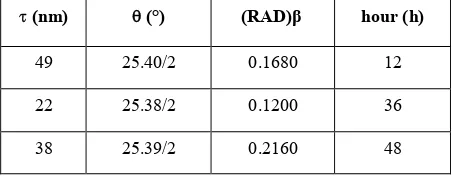
stirring times are shown in Fig. 3. The XRD characteristic peaks revealed that, the main phases of all three samples were anatase and rutile phases. Furthermore, no significant difference was observed between them indicating that, the increase in stirring time does not affect the crystal structure of the final product. The crystalline size of nanopowders was calculated according to Scherer equation as shown in Table 2. It was observed that by the increase of stirring time to 36 h the crystallite size decreased. However, further increase of stirring time increased the crystallite size due to the agglomeration of nanoparticles. Takahashi and Yamaguchi [19] found that during stirring of a solution, the viscosity increased, therefore the particle size improved, however, due to the spinner revolution, the particle size decreased. So that with increasing the stirring time from 12 h to 36 h the crystallite size decreased. As it proceeded, after 36 h, more water evaporated from the sol, thus the supersaturated solution supplied the material necessary to bond colliding particles and form agglomerates. Moreover, this effect was probably due to Brownian forces that led to particle aggregation [18,28]. In addition, heat generated in the longer stirring time might be playing a factor in enhancing the movement of particles and particle aggregation [29]. Novakovic and Korthaus [19] have reported that drying of the sol invariably leads to agglomeration because the residual salts present in the sol form solid bridges between particles as the water evaporates.
TABLE 2. The crystallite size of TiO2 nanoparticles prepared
at different stirring times
hour (h) β (RAD) (°)
(nm) 12 0.1680 25.40/2 49 36 0.1200 25.38/2 22 48 0.2160 25.39/2 38
So that, with increasing the stirring time to 48 h, the crystallite sizes were increased. It is well understood that the 36 h stirring time is the optimum time for further surfactant treatment.
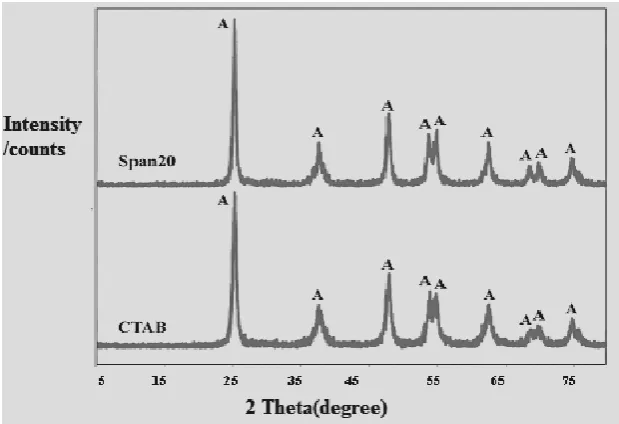
The XRD patterns of TiO2-CTAB and TiO2-Span 20 are
The crystallite size of nanopowders was calculated according to Scherer equation as shown in Table 3.
Figure 3. XRD patterns of nanocrystalline titania samples prepared by sol-gel method with various stirring time condition
Figure 4. XRD patterns of nanocrystalline titania samples prepared by sol-gel method with various surfactants
It was observed that by increasing of CTAB as a surfactant, the crystallite size decreased. However, Span 20 as a surfactant did not play any significant role in dispersion of nanoparticles. In the case of cationic surfactant CTAB, low agglomeration, high dispersive and uniform crystallite size were obtained because of the electrostatic interaction between CTA+ cations and Ti (OH)6
anions, and the cation CTA+ condensed into aggregates in which counter ions Ti (OH)62- were
related to the interfaces between the head group to form CTA+ - Ti (OH)62- pair [30].
This might indicate a better dispersion, less agglomeration of nanoparticles with CTAB as well as more powder crystallization. Therefore, it was inferred that the best surfactant for TiO2 nanoparticle is CTAB.
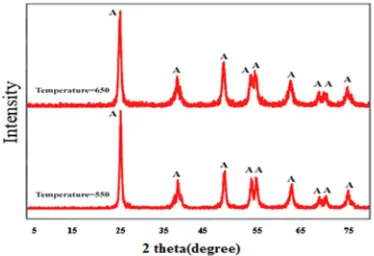
The XRD patterns of TiO2 nanoparticles with CTAB as
a surfactant at different temperatures are shown in Fig. 5.
TABLE 3. The crystallite size of TiO2 nanoparticles with
different surfactants
surfactant β (RAD)
(°)
(nm)
CTAB 0.0089
25.3353/2 16
Span 20 0.0049
25.3259/2 29
However, TiO2 nanopowder at 650 °C revealed a little
bigger particle size and better powder crystallization. The crystallite size of TiO2 nanopowder at different
temperature according to Scherer equation is shown in Table 4.
TABLE 4. The crystallite size of TiO2 nanopowder at various
temperatures
(nm) (°) β (RAD) Temperature (°C)
34 25.4625/2 0.0043 550
37 25.3746/2 0.0037 650
By comparing the crystallite size of TiO2 nanopowder,
it is concluded that with increasing the temperature, the
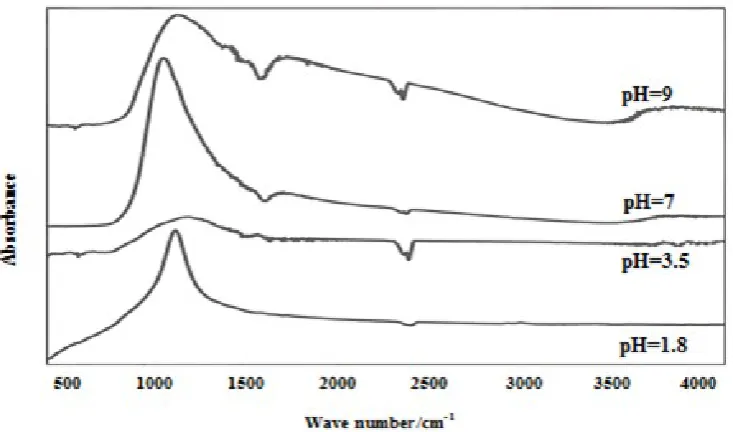
crystallite size was a little increased which might be, because of the acceleration of the crystal growth of titanium dioxide at high calcination temperature [23,30]. The FTIR spectra of calcined TiO2 revealing the
absorption band at 400-4000 cm-1 are shown Fig. 6. The TiO2 powder showed absorbance peak in the range of
3500-3900 cm-1 related to vibration characteristics of O-H bond revealing the presence of water [14,25,31]. In addition, the peaks in the range of 2300-2400 cm-1 correspond to C-O bond revealing the presence of CO2
from air, while the peak at 1700 cm-1 was due to the O-H bond revealing the presence of water [26].
Moreover, the bonds in the range of 800-1200 cm-1 belong to the Ti-O-Ti and Ti-O-O bonds [27,32].
Figure 5. XRD patterns of nanocrystalline titania samples prepared by sol-gel method at various temperatures
The results showed that the obtained material after calcining is mostly the crystalline TiO2.
The FTIR spectra of TiO2 nanoparticles with different
stirring times are also illustrated in Fig. 7. The vibration peaks in the rang of 800-1200 cm-1 are ascribed to Ti-O-Ti and Ti-O-Ti-O-O bonds [27, 33]. The peaks confirmed the formation of TiO2 phase. The absorption band in the
range of 3500-3900 cm-1 and 1700 cm-1 are related to vibration characteristics of O-H bond revealing the presence of water [29,34]. Moreover, with increasing the stirring time from 12 to 48 h the intensity of O-H bond was decreased revealing the water evaporation and loss of water of TiO2 nanoparticles.
Fig. 8 shows the FTIR spectra of the TiO2 nanoparticle
with different surfactants. The vibration peaks in the
range of 800-1200 cm-1 are ascribed to O-Ti and Ti-O-O bonds [28,35].
This confirmed the formation of TiO2 phase which is in
agreement with XRD result. The absorption bands in the range of 1380 and 1600 cm-1 was ascribed to the C-C characteristic peak related to hydrocarbon phase from surfactants [30,36]. The peaks confirmed the presence of CTAB and Span 20 as surfactants.
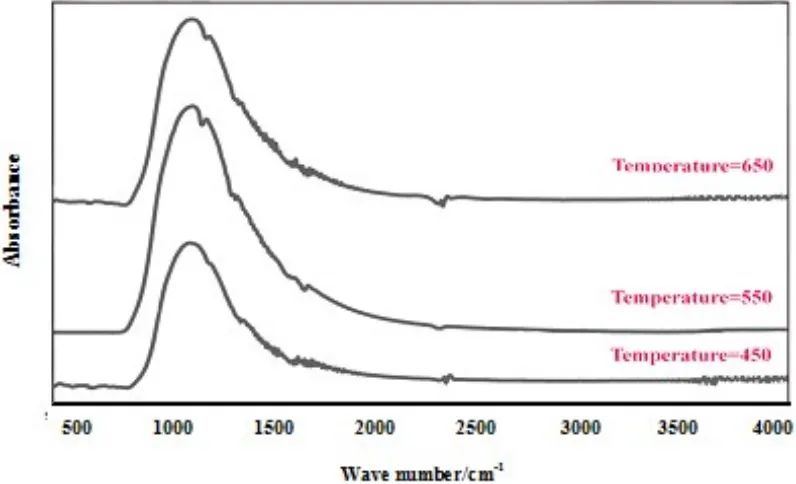
The FTIR spectra of TiO2 calcined at different
temperatures are also shown in Fig. 9. As mentioned before, the absorption band at the 800-1200 cm-1 was ascribed to Ti-O-Ti and Ti-O-O bonds which were confirmed the formation of TiO2 phase. The vibration
8, no significant difference was occurred between the spectra after increasing the temperature. However, after increasing the temperature all the peaks related to O-H
bond shifted to the lower absorbance which might be attributed to the evaporation and loss of water [10].
Figure 6. FTIR curves of nanocrystalline titania samples prepared by sol-gel method with various pH
Figure 7. FTIR spectra of nanocrystalline titania samples prepared by sol-gel method with various stirring times
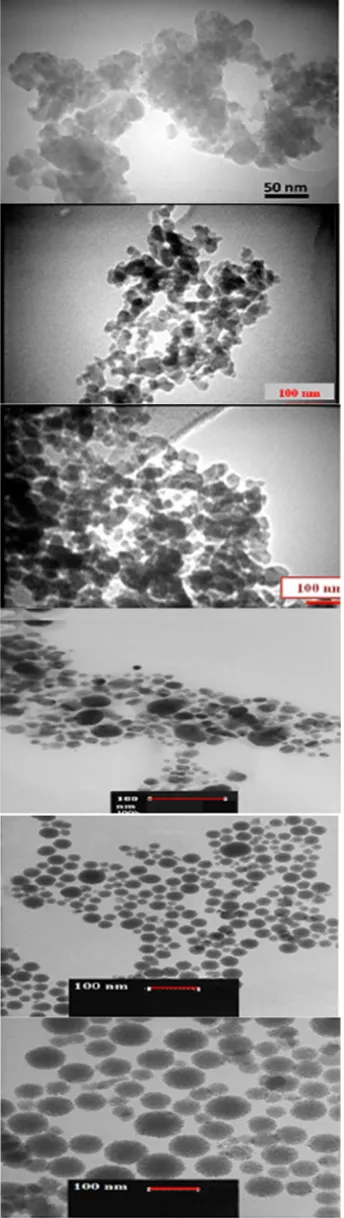
The morphology of calcined TiO2 with the different
condition was evaluated by TEM images as shown in Fig. 10. The TEM image of TiO2 was used to
investigate the particle size and morphology of TiO2
nanopowders. As for the sample with pH=3.5. the particle size was in the range of 30-35 nm with spherical shape and they had better dispersion and less agglomeration than particles at pH=1.8.
As depicted in Fig. 10(a), TiO2 nanopowder at pH=1.8
revealed the particle size around 38 nm with asymmetrical shape and some agglomeration.
The TEM micrograph of nano TiO2 particles after 36
The TEM micrograph of TiO2 capped with CTAB
indicated that by adding surfactant, the dispersion of particles increased. Furthermore, the addition of surfactant improved the dispersion and formed nanoparticles with the sizes in the range of 16-20 nm with spherical shape (Fig. 10(d)). The CTAB surfactant
was a cationic serviceable group which could accelerate the adsorption of Ti ions. Moreover, some negatively-charged groups were able to induce repulsive force for adsorption of Titanium (Ti4+) ion and subsequent complexion with them. The TEM micrograph of TiO2 at
650 °C is also shown in Fig. 10(f).
Figure 8. FTIR curves of nanocrystalline titania samples prepared by sol-gel method with various surfactants
It showed that by increasing the temperature, the size of particles increased to 30 -33 nm with spherical shape and good dispersion without any agglomeration which
might be due to acceleration of the crystal growth of titanium dioxide at high calcination temperature [33,39].
Figure 10. TEM micrograph of TiO2 nanoparticles at different
conditions a: pH=1.8 , b: pH=3.5, c: 36 h stirring time, d: CTAB as a surfactant and e: 550 °C as a temperature, f:650 °C as a temperature
4. CONCLUSION
The sol–gel method was used for the synthesis of nano-TiO2 from titanium isopropoxide which was coupled
with the presence of surface active agents, like CTAB and Span 20. Selection and control of the precise pH, stirring time together with surface active agents proved to be important in controlling the particles size, degree of aggregation and the particles shape. The pH of 3.5 could provide dispersion without agglomeration in nanoparticle powder with rutile and anatase phases; however, at higher pH the powder resulted in the formation of anatase phase. Moreover, the particle size after 36 h, in comparison with 12 ,24 and 48 h, generated a better dispersion as well as finer particles. The microstructural observation showed that nano-TiO2
powder with CTAB surfactant with 36 h stirring time was produced in the range of 16-20 nm and the implementation of CTAB as a surfactant effectively modified the shape and size distribution of TiO2 in the
structure better than the Span 20 as a surfactant. At last, with increasing the temperature from 450 to 650 °C, the particle sizes of TiO2 was increased to 30 -33nm,
basically spherical shape with good dispersion and without any agglomeration.
5. ACKNOWLEDGMENTS
One of the Author’s (SK) is thankful to the College management for permitting to do Ph D.
REFERENCES
1. Saja, S., Taweel, A. and Haider, R., "New route for synthesis of pure anatase TiO2 nanoparticles via utrasound-assisted sol-gel
method", Journal of Chemical and Pharmaceutical Research, Vol. 8, No. 2, (2016), 620-626.
2. Zielinska, B. and Borowiak-palen, E., "A study on the synthesis, characterization and photocatalytic activity of TiO2 derived
nanostructures", Materials Science-Poland, Vol. 3, (2010),626-639.
3. Choia, H., Stathatos, E. and Dionysios, D., "Sol–gel preparation of mesoporous photocatalytic TiO2 films and
TiO2/Al2O3 composite membranes for environmental
applications", Applied Catalysis B: Environmental, Vol. 63, (2006), 60-67.
4. Venkatachalam, N., Palanichamy, M. and Murugesan.,V, "Sol– gel preparation and characterization of alkaline earth metal doped nano TiO2: Efficient photocatalytic degradation of
4chlorophenol", Journal of Molecular Catalysis A: Chemical, Vol. 273, (2007), 177-185.
5. Kamil. F., Hubiter, K., Abed, T.K. and Amiery, A.A., "Synthesis of Aluminum and Titanium Oxides Nanoparticles via Sol-Gel Method: Optimization for the Minimum Size",
Journal of nanoscience and technology, Vol. 2, No. 1, (2016), 37-39.
6. Divya, C., Janarthanan, B., Premkumar, S. and Chandrasekaran, J., "Titanium dioxide nanoparticles preparation for dye sensitized solar cells applications using sol-gel method",
7. Peruma, S., Gnana, C., Monikanda, K. and Ananthakumar, S., "Synthesis and characterization studies of nano TiO2 prepared
via sol-gel method", International Journal of Research in Engineering and Technology, Vol. 3, (2014), 651-658. 8. Behpour, M. and Chakeri, M., "Ag-doped TiO2
nanocomposite prepared by sol gel method: Photocatalytic Bactericidal Under Visible Light and Characterization", Vol. 2, (2012), 227-234.
9. Manh, N., Thanh, N. and Hoang, N., "Low-temperature synthesis of nano-TiO2 anatase on nafion membrane for using
on DMFC", Journal of Physics: Conference Series, Vol. 187, (2009),1-6.
10. Jimmy, C., Jiaguo, Y., Wingkei, Y. and Zhang, L., "Preparation of highly photocatalytic active nano-sized TiO2 particles via
ultrasonic irradiation", Chemical Communications, (2001), 1942-1943.
11. Macwan, D.P., Pragnesh, N. and Dave, N., "A review on nano-TiO2 sol–gel type syntheses and its applications", Journal of
Materials Science, Vol.46, (2011), 3669-3686.
12. Miao, Z., Xu, D., Ouyang, J., Guo, G., Zhao, X. and Tang, Y., "Electrochemically induced sol−gel preparation of single-crystalline TiO2 nanowires", Nano Letters, Vol. 7, (2002),
716-720.
13. Choi, H., Stathatos, E. and Dionysios, D., "Sol–gel preparation of mesoporous photocatalytic TiO2 films and TiO2/Al2O3
composite membranes for environmental applications", Applied Catalysis B: Environmental ,Vol. 63, (2006), 60-67.
14. Zaleska, A., "Doped-TiO2: A review", Recent patents on
Engineering ,Vol. 2, (2008), 157-164.
15. Harold, P. and Alexander, E.K., "Xray diffraction procedures for polycrystalline and amorphous materials", Willy, New York, (1974).
16. Vetrivel, D., Rajendran, K. and Kalaiselv, V., "Synthesis and characterization of pure titanium dioxide nanoparticles by sol- gel method", International Journal of Chem Tech Research,
Vol. 7, (2015), 1090-1097.
17. Yang, J., Mei, S. and Ferreira, J., "Surface and sorption properties of TIO2 nanotubes, synthesized by electrochemical
anodization", Materials Science and Engineering: C, Vol. 15, (2001), 183-190.
18. Novakovic, R. and Korthaus, B., "Advanced Ceramics for Use in Highly Oxidizing and Corrosive Environment", Trans Tech Publications Ltd, Switzerland, (2001).
19. Billik, P. and Plesch, G., "Mechanochemical synthesis of nanocrystalline TiO2 from liquid TiCl4", "Scripta material, Vol. 56, (2007), 979-982.
20. Li, J.G., Kamiyama, H., Wang, X.H., Moriyoshi, Y. and Ishigaki, T., "Controlled one-step synthesis of nanocrystalline anatase and rutile TiO2 powders by in-flight thermal plasma
oxidation", Journal of the European Ceramic Society, Vol. 26, (2004), 15536-15542.
21. Seok, S.I. and Kim, J.H., "Synthesis of TiO2 nanoparticles in
porous silica microspheres", Materials chemistry and physics,
Vol. 86, (2009), 176-182.
22. Prasad, K., Pinjari, D., Pandit, A. and Mhaske, S., "A novel approach to synthesis and characterization of titanium dioxide",
Ultrasonics sonochemistry, Vol. 17, (2010), 409-415. 23. Abbas, F., Bensaha, R. and Taroré, H., "Regulation of the
physical characteristics of titania nanotube", Comptes Rendus Chimie,Vol. 17, (2014), 288-275.
24. Fallah, M., Zamani-Meymian, M.-R., Rahimi, R., Rabbani, M., "In vitro bioactivity and corrosion resistance of Zr incorporated TiO2 nanotube arrays for orthopaedic applications", Applied
Surface Science, Vol. 316, (2016), 264-275.
25. Agartan, L., Kapusuz, D., Park, J. and Ozturk, A., "Effect of initial water content and calcination temperature on photocatalytic properties of TiO2 nanopowders synthesized by
the sol–gel process", Ceramics International, Vol. 41, (2015), 12788-12797.
26. Leyva-Porras, C., Toxqui-Teran, A., Vega-Becerra, O., Miki-Yoshida, M., Rojas-Villalobos, M., García-Guaderrama, M. and Aguilar-Martínez, J., "Characterization of nanophase titania particles synthesized using in situ steric stabilization", Journal of Alloys and Compounds, Vol. 647, (2015), 1755-1765. 27. Yousefi, A., Allahverdi, A. and Hejazi, P., "Effective dispersion
of nano-TiO2 powder for enhancement of photocatalytic
properties in cement mixes", Construction and Building Materials, Vol. 41, (2016), 224-230.
28. Karkare, M., "Choice of precursor not affecting the size of anatase TiO2 nanoparticles but affecting morphology under
broader view", International Nano Letters, Vol. 4, (2014), 1-9. 29. Lope,. T., Gomez, R., Sanchez, E., Tzompantzi, F. and Vera, L
"The effect of calcination temperature on the crystallinity of TiO2", Journal of Sol-Gel Science and Technology, Vol. 22,
(2003), 363-370.
30. Milani, H. and Nasirian, S., "Decreasing of the activation energy of TiO2 nanoparticles by applying ultrasound waves
using the sol-gel method", Iranian Journal of Physics Research, Vol. 11, (2012), 411-416.
31. Antoine, R., Dalod, M., Henriksen, L., Grande, T. and Einarsrud, M., "Functionalized TiO2 nanoparticles by
single-step", Journal of Nanotechnology,Vol. 8, (2017), 304-312. 32. Poursani, A., Nilchi, A., Shariat, S. and Nouri, J., "The
Synthesis of Nano TiO2 and Its Use for Removal of Lead Ions
from Aqueous Solution", Journal of Water Resource and Protection, Vol.8 ,(2016), 438-448.
33. Rostami, A. and Nasiri, S.M., "Synthesis of mesoporous nanoparticles of TiO2 from ilmenite", Materials Research
Express,Vol. 4, (2017), 22-30.
34. Zielinsk, B., Borowlak, E., Kalenczuk, R.J., "A study on the synthesis, characterization and photocatalytic activity of TiO2
derived nanostructures", Materials Science-Poland, Vol. 28, (2010), 585-594.
35. Gigliola, L., Corrado, B., Federica, G., Giulia, P., "Synthesis and characterization of TiO2 nanoparticlesfor the reduction of
water Pollutants", Materials, Vol. 10, (2017), 1208-1219. 36. Qianqian, Y., Jingyu, X., Xiangdong, W., Xiaoling, G. and
Tong, Z., "Preparation of highly crystalline mesoporous TiO2 by sol–gel method combined with two-step calcining process",
Journal of Experimental Nanoscience, Vol. 11, No. 14, (2016), 1127-1137.
37. Divya1, C., Janarthanan, B., Premkumar, B., Chandrasekaran, J., "Titanium dioxide nanoparticles preparation for dye sensitized solar cells applications using sol-gel method",
Journal of Advanced Physical Sciences, Vol. 1, No. 1, (2017) 4–6.
38. Mane, C., Pawar, R., Gaikwadc, D.,Khobare, R., "Synthesis of TiO2 nanoparticles by Microwave Assisted Sol- Gel Method",
Journal of Medicinal Chemistry and Drug Discovery, Vol. 2, (2017), 580-584.