An Analysis of Urban Sprawl Using Factor Analysis Technique (Case:
Qazvin City Districts)
Esfandiyar Zebardast*
Professor, Department of Urban Development, Faculty of Urban Development, College of Fine Arts, University of Tehran, Tehran, Iran
Hossein Ghanooni
Ph.D. of Urban and Regional Planning, School of Architecture and Urban Development, Shahid Beheshti University, Tehran, Iran
Received: 2018/07/23 Accepted: 2019/02/06
Abstract: Urban sprawl is an issue in many cities throughout the world, which has affected many aspects of urban life negatively. Urban sprawl, which is generally attributed to horizontal and leapfrogged extension of city boundaries caused by citizen’s will to leave central urban areas and live in urban countryside. The first step for tackling this problem is the identification of sprawled places and the influential factors on sprawl in urban land. Therefore, this article analyses urban sprawl phenomenon in Qazvin city districts. Relying on relevant theoretical texts, 13 indicators are chosen among others in literature for measuring urban sprawl in Qazvin districts. These indices are localized according to the conditions of Iran and the data associated with each of them are extracted using census statistics and Geographic Information System (GIS). Then, factor analysis technique is implemented by SPSS software and the indicators are attributed to four factors. By assessing the contributing indicators to each factor, they are named density, configuration, land-use and accessibility respectively. The results of factor analysis are very consistent with literature. These factors explain the variance of urban sprawl by 27.8, 21.6, 11.3 and 9.5 percent respectively. It is shown that "shape index" and "fractal dimension" as new indicators for measuring urban sprawl are significantly effective on this phenomenon. Results show that districts 4, 5, 7, 11 and 12 are the most sprawled and districts 17, 28, 38 and 39 are the least sprawled districts in Qazvin. These two new indexes in Iranian urban literature can be used in other sprawl studies in the country. In addition, the results of this study can guide Qazvin municipality to make important decisions about the direction of city development.
Keywords: Urban Sprawl, Factor Analysis, Configuration, Qazvin JEL Classification: 018, 021, C21, R14, N65
* Corresponding author: [email protected]
To cite this document: Zebardast, E., & Ghanooni, H. (2019). An Analysis of Urban Sprawl Using Factor Analysis Technique (Case: Qazvin City Districts). Urban Economics and Management, 7(2(26)), 65-84.
www.iueam.ir
Indexed in: ISC, EconLit, Econbiz, SID, EZB, GateWay-Bayern, RICeST, Magiran, Civilica, Google Scholar, Noormags, Ensani ISSN: 2345-2870
1- Introduction
The 19th and the early 20th century can be called a period during which the industrial revolution led human beings form an economy based on agriculture to an economy, which was in the power of cities. The change of economic structure led to a change in the way people live (Jaeger & Schwick, 2014), not only reducing the number of workers in the agricultural sector, but also enabling citizens to transport agricultural goods from villages with rapid transportation vehicles such as automobile to the city without direct communication with the surrounding villages. On the other hand, the formation of economic sector of services alongside the industry sector coupled with the attractions of life in the cities led to the loss of agricultural lands and open spaces around cities. The horizontal expansion of cities gradually resulted in the loss of agricultural land and open spaces surrounding the cities. more population vertically, but residents’ tendency to live in larger single-family residential units (Nazarniaa et al., 2016) made horizontal expansion the desirable development shape for residents.
Since the 1970s, urban sprawl has attracted much attention from urban scholars and planners because of its economic and social costs (Liu et al., 2018). Numerous studies have examined North American cities because it was initially thought to be an American phenomenon (Hamidi & Ewing, 2014; Ewing et al., 2002). However, the cities in developing countries are experiencing urban sprawl due to rapid urbanization and horizontal urban expansion (Liu et al., 2018). Throughout the world, urban sprawl is a challenge for sustainable use of urban land (Hennig et al., 2015). These
issues clearly show the necessity and importance of paying attention to sprawl in Iranian cities.
Sprawl is not limited to certain parts of the world and does not have a link with the level of development of countries (Frenkel & Ashkenazi, 2008). It has threatened the existence of natural resources through extensive use of lands in the major cities of developing countries (Terzi & Bolen, 2009). Some scholars support urban sprawl because of its positive impacts such as provision of quality and affordable housing (Nechyba & Walsh, 2004), provision of housing for racial minorities like black people (Kahn, 2001) and adherence to the free economy, market rules and consumer preferences (Bogart, 2006), but most urban development thinkers have cited negative impacts of sprawl and have offered solutions to deal with it (Ewing et al., 2002, Ewing et al., 2006, Frenkel & Ashkenazi, 2008).
The city of Qazvin is one of the historic cities of the central Iran. The city has been subject to many changes over history and has experienced many physical and land use changes, but these developments generally have been slow and gradual, while the rapid evolution of Qazvin city from 1928 to 2007 has been much higher than that of all previous periods. At this period, the gardens have attached to the dilapidated walls of the city, and the impacts of city development in the southern part of the city is quite evident on the axis crossing Imamzadeh Hossein and the continuation of the North-South axis in the northern section of the city. At the period of 1976-1995, the city walls were collapsed and with changes in land use patterns, the city extended to the north. It is evident that in parallel with the growth of the city, a
significant portion of the city, which has been located in central old city, has been transformed into decay urban areas (Consultant engineers of the “City and Planning”, 2005).
These issues represent the excessive and unplanned expansion of Qazvin in horizontal direction and make urban sprawl phenomena a possibility in Qazvin. In addition, about 26 percent of the land use area is wasteland, which is even more than the percentage of streets in the city (Sardari & Barati, 2009). It indicates that the city has a large extent of infill development potential but has not used this potential and has been expanded only in the horizontal direction. This phenomenon becomes more important because it usually has adverse consequences on the city. In the case of Qazvin, these impacts include expansion of city borders to surrounding gardens and demolition of those gardens, movement of resources and wealth to the north of the city, which is the main expansion direction of Qazvin, whose effect is the creation of decay and poverty in the old city areas. Excessive dependence on cars, traffic congestion, water and air pollution -and their adverse effects on city gardens- are other negative impacts of urban sprawl on the city of Qazvin.
The present paper attempts to answer the following questions:
1) How is the distribution of sprawl in different areas of Qazvin?
2) What indices explain urban sprawl phenomenon and to what extent?
3) What is the impact of two indices called “Fractal Dimension” and “Shape Index” on sprawl phenomenon?
The present paper briefly reviews the literature of urban sprawl. After that, the conceptual model of the research and selected indicators for measurement of
urban sprawl are introduced. Finally, the methodological-analytical discussions and conclusion of the paper are presented.
2- Literature Review
a) Foreign Researches
Torrens (2006) presents four dimensions of households, business owners, planners and officials as the main causes of urban sprawl (Torrens, 2006). Angel (2007) views sprawl as a manifestation of the fragmentation and separation of city parts from each other. In his opinion, sprawl is the result of citizens’ desire to limit social and economic relations and add to their private privacy, size of the housing unit, business location and enjoying the open spaces (Angel, 2007).
Patacchini & Zeno (2009) identify five factors in the creation of urban sprawl: access to automobiles, increase in household incomes, increase in employment rates, increase in the percentage of ethnic minorities and raise of crime rates in the city center (Patacchini & Zenou, 2009).
Ehrlich et al., (2018) study the effects of institutional contexts on the creation of spatial differences in the urban sprawl patterns of Europe. Data used in this paper are a collection of panel data associated with urban sprawl, compiled using high-quality satellite imagery from 36 European countries. These images are compared between 1990 and 2012 in different countries. Accordingly, the incidence of urban sprawl is greater in Central and Eastern Europe than in the Central European countries. According to the results of this study, urban sprawl -especially outside the functional areas of cities- has an inverse relationship with the increase in housing prices. The authors have found that decentralization and devolution of political tasks on local
levels have a significant positive relationship with urban sprawl. Countries with decentralization and devolution of power to local levels have shown 25 to 30 % more sprawl. This result is consistent with the proposition that “in countries where decentralization has taken place, financial attractions at the local level leads to the licensing of housing units on the edge of current developments”.
The study of Zhang et al., (2018) uses national data to explore spatial patterns of land development in Chinese cities. In this study, urban sprawl cases and their relationship with the level of economic development have been investigated using the new land-spatial data on the border of cities and development densities in all cities of china. For comparison, the past and current borders of Chinese cities have been selected for years 1990 and 2010. Two main indices of this study for measurement of sprawl were population density and road intersection density. The results indicate that Chinese cities have experienced an enormous increase in the level of built areas and yet, have witnessed a sharp decrease in development density in newly constructed urban areas (compared to central areas), a result that confirms urban sprawl. Furthermore, the results of the regression analysis in this study show that the level of urban economic development, after controlling effective factors, has a direct relationship with urban horizontal expansion.
Hamidi & Ewing (2014) study used cross-sectional data for large urban areas of the United States in 2010 (162 urban areas). The criterion for identification of large urban areas was the population of more than 200,000 in 2010. They have measured 15 variables from four factors (development density, land use composition,
centralization of activities, access to streets) to calculate the degree of sprawl in these areas. These 15 variables were analyzed by Principal Component Analysis (PCA), which confirmed structural validity and classification of four factors. Finally, factor scores were combined for calculation the urban sprawl index. They then converted the 2010 values into the 2000 values to obtain comparable values based on year 2000. The comparison of the corresponding values of 2000 and 2010 shows highest and lowest sprawl rates. The results have shown general rise (though few) increase in urban sprawl of large urban areas in the United States.
Jaeger & Schwick (2014) introduced a new method for measuring urban sprawl; a method based on the definition of urban sprawl as a phenomenon with three specifications: (1) increase in built lands in a given area, (2) higher dispersion of built lands in a given area (3) greater share of the occupied land in relation to population or jobs (less intensive use of built lands). According to this new method, which leads to the calculation of the combined index called Weighted Urban Proliferation (WUP), the rate of change in the cities of Switzerland was measured for the period 1935-2002. Accordingly, the result of this study indicated that the degree of sprawl in Switzerland has increased by 155 % from 1935 to 2002. According to the past trends, the paper predicts that by 2050, urban sprawl in Switzerland will experience a 50% increase.
b) Iranian Researches
Azizi & Arasteh (2012) examine sprawl solely based on floor area ratio. Raeisi Jelodar & Esfandiari (2014) use Holden model (1991) to measure sprawl.
This model shows how much of the city's growth is attributed to population growth and how much is caused by the unplanned urban growth. The model also uses solely per capita indicators (inverse of density), population and area. Ahmadi et al., (2011) have comparatively studied urban sprawl in three middle-sized cities of Iran (Kashan, Sanandaj, Ardabil) and by means of factor analysis, show that in the cities of Ardabil and Kashan, the most important factors in explaining sprawl phenomenon are “centrality” and “mixed use” factors, but in Sanandaj, “density” and “accessibility” have shown more explanative of urban sprawl.
Zebardast & Habibi (2009) have chosen 10 indices for measurement of sprawl in Zanjan urban areas and factor analysis has led to four factors of “density”, “mixed-use”, “centrality” and “accessibility” to explain this phenomenon.
Hosseini & Hosseini (2015) have analyzed sprawl in urban regions of Iran according to experts, who first identified 14 influential factors on this phenomenon and then questioned the impact of each of these factors on urban sprawl in Iran from 30 experts. Finally, factor analysis showed five factors (economic, government’s urban policies, urban management system, population and lifestyles) that have the highest explanation of sprawl phenomenon, respectively.
In the study of Moosavi et al., (2015) the effects of urban sprawl and social capital on each other have been investigated. They have identified six indices for measurement of sprawl: population density, open space rate, average Floor Area Ratio, distance from the city center, residence duration in current neighborhood and accessibility.
3- Theoretical Background
Like city itself, the urban sprawl is a phenomenon, whose definition has been debated for more than 70 years. Some scholars have stressed that in the definition of sprawl, the causes of occurrence, consequences, and manifestations of sprawl have to be separated from the phenomenon itself (Jaeger et al., 2010).
Reviewing other theoretical foundations related to sprawl indicates that three fields can be determined to explain this phenomenon:
1) Sprawl definition: Since there is still no consensus on the definition of sprawl, its various definitions can pave the way for identifying the different dimensions of this phenomenon and defining its measures.
2) Causes of the occurrence of sprawl 3) Results and manifestations of sprawl
Definitions of Urban Sprawl
The importance of sprawl definition results from this fact that without a clear definition, quantification and modeling of urban sprawl would be extremely difficult (Bhatta et al., 2010). Sprawl measures are often closely related to how this phenomenon is defined (Liu et al., 2018; Paulsen, 2014).
There is still no consensus on sprawl definitions and its opposites such as compact development, pedestrian-friendly design, transport-oriented development (TOD) and the general term “smart growth” (Hamidi & Ewing,2014). An overall understanding of sprawl is that this phenomenon is an uncontrolled growth towards the outskirts of the city: the spread of the city by occupying excessive amounts of the urban land that is often considered problematic and unstable (Weilenmann et al., 2017). Torrens (2006) defines sprawl as an
advanced stage of the city’s evolution toward a compact structure. Angel (2007) defines sprawl as the form ation of extensive and infinite borders of metropolitan areas. Ewing et al. (2002) define urban sprawl as low-density development with segregation of land uses, such as residential, commercial and office use, which lacks dynamic activity centers and gives people little options to choose their access ways. According to Galster et al. (2006) urban sprawl is a type of land use in an urban area that has low levels of density, continuity, concentration, clustering, centrality, nuclearity, mixed-use and proximity . Hamidi & Ewing (2014) believe that the most important element of sprawl that contains its key definition is poor accessibility. Poor accessibility can be well observed in leapfrog development. Although all studies see sprawl as a complex phenomenon encompassing many dimensions (Ehrlich et al., 2018), there is a common point in all of them: urban sprawl refers to the amount of built area and its distribution on the land. The more the land is built and the more distributed across a wider geographic range, the greater the urban sprawl (Estiri, 2014).
According to the new methodologies of some scholars, the concept of sprawl takes new definitions: the more area built over in a given landscape (amount of built-up area) and the more dispersed this built-up area in the landscape (spatial configuration), and the higher the uptake of built-up area per inhabitant or job (lower utilization intensity in the built-up area), the higher the degree of urban sprawl (Jaeger & Schwick, 2014). Jaeger & Schwick (2014) believe that an important advantage of their definition and method of measurement of sprawl is
in the sense that it only measures the phenomenon itself (not its causes or manifestations).
Zebardast & Habibi (2009) define urban sprawl as expansion of the city and its suburbs on rural and agricultural land. They believe that residents of sprawled neighborhoods tend to live in nearby single-family homes and commute with cars. Low density is one of the main indicators of this type of urban expansion. Residents of sprawled neighborhoods tend to avoid pollution and prefer to live in a low-density region.
In the present paper, sprawl is defined as “unplanned, far from the center and automobile-dependent growth that influences the environment, the economy and the social structure of the city, and can be characterized as having low concentration, segregation of land uses and limited accessibility”.
Causes of urban Sprawl
With increase in urban population, the city has to expand vertically or horizontally. If the growth is horizontal, it may sometimes exceed the existing borders of the city and enter agricultural and natural fields. This horizontal growth along with the growth of highways makes the city center less attractive. Industry sector, which no longer needs the center to supply raw materials, rapidly expands on the outskirts, looking for cheap land and high access to the wide network of highways. Nowadays, the highways have become the new center of gravity for the development of urbanization (Torrens, 2006).
For some researchers, the causes of urban sprawl are increase in population and income, low land prices, access to
cheap and affordable housing and low infrastructure and transportation costs (Habibi & Asadi, 2011; Torrens, 2006). Some researchers believe that high rate of car ownership, easy access to peripheral lands, and lack of central planning are elements that have led to rapid spread of urban sprawl in the United States (Hamidi & Ewing, 2014).
Many factors lead to the formation of an urban development pattern called sprawl: consumers’ preferences for cheaper land, interest in single-family housing units, desire to live in low-density and green neighborhoods and inclination to have a second house. Improvements made in long distance communications and reduction in the price of fuels gives people more options for their dwellings (Nazarniaa et al., 2016).
Totally, five major factors lead to urban sprawl. The first three factors are the same between United States and Europe and they increase urban sprawl in both continents. However, the two final factors, in the two continents, influence urban sprawl in an opposite way. These five factors are: (Patacchini & Zenou, 2009):
1. More access to the cars, which reduces travel expenses and thus increases urban sprawl.
2. Increasing incomes that encourages households to live in larger residential units, and since the land is less expensive on the outskirts of the city, increases urban sprawl.
3. Increasing the employment rate, which increases sprawl because employment is highly correlated with income.
4. An increase in the percentage of ethnic minorities in the cities will lead to greater sprawl in the US and less sprawl in Europe.
5. An Increase in the crime rate, which leads to greater urban sprawl in the US and a decline in sprawl in Europe, because in Europe white families tend to get away from crime-prone regions.
Effects and Manifestations of Urban Sprawl
Any expansion of the city on the fringes is not necessarily sprawl. Sprawl refers to a specific form of this extension (Zhang et al., 2018). From the perspective of Zhang et al. (2018), sprawl occurs only when the urban expansion exceeds the area needed for accommodation of added population.
However, the spatial characteristics of sprawl are often intuitive and are easily visible: leapfrog, fragmented or low-density development and poor accessibility are some of them (Liu et al., 2018; Ewing & Hamidi, 2017).
According to Torrens (2006), sprawl has specifications that distinguish it from its previous urban patterns and other patterns such as smart growth. First, the sprawl is characterized by suburbanization. Second, sprawl appears on the outskirts of cities and in areas that have not been urban before. Third, sprawl is low density by nature. Fourth, is characterized by similar land uses. Single-family residential use forms the bulk of the land use in sprawled areas, while commercial land use usually forms a tape; Rows of activities that are formed on the fringes of highways and are almost inaccessible without cars. Fifth, the appearance of sprawled areas is usually criticized for being "boring and dull". Sixth, sprawl usually takes place in situations where a coherent planning system does not exist. This is obvious by comparing rules and restrictions at city center and city fringes (Torrens, 2006).
In other researches, different results and manifestations are mentioned for urban sprawl, namely: increase in traffic congestion (Garrido-Cumbrera, 2018), increase in water and power demand (Lasarte Navamuel et al., 2018; Jaeger & Schwick, 2014), increase in household energy consumption (Stiri, 2014), encroachment on agricultural land and change of land uses that have a key role in the nutrition of communities (Zhang et al., 2018; Nazarniaa et al., 2016; Jaeger & Schwick, 2014), increase in air pollution and greenhouse gas emissions (Garrido-Cumbrera, 2018; Nazarniaa et al., 2016; Hennig et al., 2015), rise of construction in peripheral areas of cities which leads to the formation of new housing, factories and commercial spaces that have very little occupation rates and are known as “ghost city” (Yue et al., 2016; Hennig et al., 2015), Reduction in the efficiency of infrastructure and transportation (Jaeger & Schwick, 2014; Nazarniaa et al., 2016), Reduced mobility and physical activity of people in sprawled areas (Braçe et al., 2016; cited in Garrido-Cumbrera, 2018), car-dependence (Hamidi & Ewing, 2014; Hennig et al., 2015), reduction in the permeability of Soil (Nazarniaa et al.,
2016; Jaeger & Schwick, 2014), loss of natural habitat and ecosystem services (Nazarniaa et al., 2016; Jaeger & Schwick, 2014), reduction in the efficiency of public infrastructure and transportation, increase in commute time and decline in civic engagement (Nazarniaa et al., 2016).
4- Research Methodology
In order to introduce the research method, the conceptual model of the research is first presented. The conceptual model of the research is in fact the selected framework of researchers for measuring the phenomenon; a framework, which is based on the theoretical and practical foundations of research subject. One of the important elements in building the conceptual model of the research of this paper is the selection of research indicators. These indicators were extracted using the literature review. In theoretical literature and conducted researches, different indicators have been used to measure sprawl and different results have been achieved based on selected indicators. In table 1, some indicators for measuring sprawl and their references are presented.
Table1. measures and indicators of sprawl in various references Galster et al., 2001
Density - concentration - clustering - centrality - nuclearity - proximity Zhang, 2000
Percentage of users of public transportation, number of highways, number of highways, travel time to CBD, percentage of users of private vehicles, percentage of white people, percentage of people of 19-50 years, percentage of educated people, percentage of people with higher education, the percentage of public employers, percentage of private employers, graduation rate from high schools, average lot size, average monthly rent, average monthly cost of a house unit, average value of a housing unit
Cutsinger et al,. 2005
Density, continuity, proximity, employment distribution, nuclearity, mixed-use, centrality of residential units, density of residential units
Ewing et al., 2002
Residential density, mixed-use in neighborhoods, access to street network, power of the centers of activity and city centers Angel, 2007
Non-permeable surface area, Non-permeable surface area+ urbanized open spaces, permeable surfaces in which 50 percent of neighborhoods are built-up, urban footprint=(non-permeable surface area+ urbanized open space+ peripheral
open space), permeable surfaces in 100 meters radius of built-up areas, total urbanized and peripheral open spaces, density of built-up areas, density of urbanized areas without water and steep surfaces, density 1= (non-permeable surface area+ urbanized open spaces+ peripheral open spaces), density 2= (non-permeable surface area+ urbanized open spaces+ peripheral open spaces- water and steep surfaces), continuity, change in city center, the point with least distance from all points of urbanized area, density gradient, new development, infill development, expansion, leapfrog development, openness index, connection and proximity of open spaces, fragmentation of open spaces, point density, limited point density
Frenkel & Ashkenazi, 2008
Gross density, net density, fractal dimension, shape index, gross leapfrog development density, net leapfrog development density, average lot size, residential land use, industrial land use, public land use, mixed land use, recreational land use, special land use
Paulsen, 2014
Changes in density of urban residential units, consumption of land per new urban household, density of residential units in newly urbanized areas, percentage of new housing units located in the previously built areas
Ewing et al., 2006
Net density in square mile, percentage of residents in densities under 1500 ha/mile, percentage of residents in densities over 12500 ha/mile, predicted density in centers, net population density in urban areas, percentage of residents with access to the office centers in their block, percentage of residents with access to primary school in 1 mile distance, percentage of residents with access to shopping centers in 1 mile distance, balance of residents and jobs, balance of residents and services, having a mixture of service providing land uses, population density in the lots, rate of density decrease from centers, percentage of people in 3 miles distance of CBD, percentage of people with over 10 miles distance from CBD, percentage of people covered by statistical blocks of the city, ratio of population density to highest density areas of the city, average block length, average block size in square mile, percentage of small blocks (under 0.01 square mile)
Kahn, 2001 Percentage of jobs with less than 5 or 10 miles distance from the city
Tian et al., 2017 Growth of urban built-up area
Urban facilities: number of hospital beds per 1000 people, number of primary and secondary schools per 100 people Density: proportion of permanent population per square Km, GDP density per square Km
Transit access: the shortest distance between city center and metro stations, sum of the shortest distances between city center and every urban district’s center
Urban form: number of plots of land per square Km, average area of all plots, total area of leapfrogged lands Terzi & Bolen, 2009
Gross density, distance from or access to centers, power of centers Weilenmann et al., 2017
Growth rate of urban population in the last 10 years, federal tax collected per capita, indicator of potential access to city through public or private transportation, the proportion of workers from outside city percentage of housing, percentage of housing owners, percentage of pensioner residents, percentage of single-member families, percentage of service sector workers, percentage of agriculture sector workers, percentage of built constructions before 1919 to all of existing structures.
Hamidi & Ewing, 2014
Density factor: gross population density of urban and suburban blocks, Gross job density of urban and suburban blocks, percentage of population in low-density suburbs, percentage of inhabitants in the suburbs with medium or high density, net population density of urban lands
Mixed land use factor: balance between jobs and population, mixture of jobs
Concentration factor: percentage of population living in CBD or regional centers, percentage of employment in CBD or regional centers, rate of change in population density of urban blocks, rate of change in job density of urban blocks Street factor: percentage of small urban blocks (less than 100 square miles area), average block size, average block size, density of intersections, percentage of four-way (or more) intersections
The important thing about selected indicators for this research is that they are chosen based on criteria of access to data and consistency to local conditions of
Qazvin. In table 2, the selected indicators, the direction of their impact on urban sprawl and their abbreviated title is presented.
Table 2- Selected Indicators for measurement of urban sprawl
Indicator Impact on Sprawl Abbreviated Title
1 Net density )-( GRSDSTY
2 Gross density )-( NETDSTY
3 Average lot size )+( MEANPTCH
4 Percentage of population in density under 40 people per hectare )+( DSTY1500
5 Percentage of population in density over 100 people per hectare )+( DSTY12500
6 Percentage of residential land use )+( PCTRESID
7 Percentage of small lots (under 3000m2) )-( PCTSMAL
8 Percentage of people in 200m radius of commercial land use )+( COMM200
9 Percentage of people in 500m radius of educational land use )-( EDU500
10 Percentage of people in less than 1 km distance of CBD )-( CBD1KM
11 Percentage of people in more than 3 km distance of CBD )-( CBD3KM
12 Shape index )-( SHAPEIDX
13 Fractal dimension )-( FRACTAL
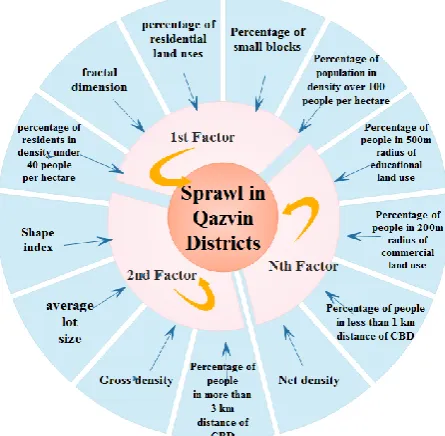
The conceptual model is the visual image of the research stages (Figure 1). As is evident in conceptual model, 13 selected indicators of the research will be analyzed and categorized using factor
analysis. Then, the level each factor explains urban sprawl phenomenon is determined and finally, the distribution maps of urban sprawl and its explaining factors are presented.
Fig1. Conceptual Model of Research
Research Procedure
This study is descriptive-analytical and deductive, which studies the case study of Qazvin city districts. In this study, relevant literature and theoretical
foundations are reviewed, the different indicators of urban sprawl measurement are studied and, relying on available data in the city of Qazvin and altering
international thresholds to suit Iran and Qazvin realities, indicators are selected. Then, using ArcGIS software package, census data and other related documents, the values of every indicator are extracted. After that, by using factor analysis technique, the selected indicators are classified in factors, the explained variance of urban sprawl by each of these factors is identified and the values of each of these factors are determined in different districts of Qazvin city. Finally, the maps of sprawl distribution in Qazvin city districts are presented. Given that in the present study variables are gathered from different sources, there is no precise presumption about their relationship and therefore exploratory factor analysis (using SPSS software) is used (Zebardast, 2011).
Some Explanations about Indicators and How to Calculate Them Based on the Case Study
Some of research indicators are the primary data of any census, and do not have a specific definition or need for secondary extraction. For example, net and gross, concentration of residents in different densities, average lot size, percentage of residential land uses and percentage of small blocks are from those data that can be easily measured by using Geographical Information System (GIS). However, some indicators require definitions or secondary evaluations to extract. For example, two indices related to distance from CBD require determination of an area in the city as Central Business District. The common method for determination of CBD is the use of origin-destination data. In the case of Qazvin city, since there was a lack of origin-destination data, CBD was selected on the basis of the “Qazvin and Spheres of Influence Development Plan” which
was conducted by “Consulting Engineers of City and Plan” in 2006. Given that the CBD area of Qazvin city is located near the old market and city center, and the maximum volume and density of commercial use is in the same area, this selection seems logical and therefore is approved. In fact, the CBD of Qazvin is in the 32nd district from 39 districts, which is located between Molavi, Koorosh, Peighambarie and Imam Khomeini streets. Knowing CBD, two indicators related to distance from CBD can be determined in different districts.
Moreover, due to the different circumstances in Iran and other countries (especially the United States), the threshold values of some indicators have become endemic of Iran by employing values defined by Zebardast & Habibi (2010). These include the size of the small blocks (change from 0.01 square miles to 3000 square meters), distance to CBD (change from 1 & 3 miles to 1 & 3 km respectively), distance to educational and commercial centers (change from 1 mile -for both- to 500 and 200 meters respectively) and changing density threshold values. In case of density values, it is worth saying that according to 2005 data, the maximum density in the city of Qazvin is 175 people per hectare, with the minimum registered at 24 people per hectare. Therefore, instead of the threshold values of 1500 and 12500 people per square mile, the thresholds of 40 and 100 people per hectare were selected. This is because the nature and definition of sprawl in the United States completely differs from Iran. Sprawl in US is called the expansion of the urban areas to countryside, so that sometimes it is necessary to travel more than 30 km to reach to a destination in the city. In
contrast, in Iran, urban areas expand to suburbs and after a while, urban management system is forced to consider these areas as part of the city's service area.
Finally, for measurement of “shape index” and “fractal dimension”, formulas introduced by Frenkel & Ashkenazi (2007) were used:
Where Shi and Fi denote “shape index” and “fractal dimension” respectively. Li and Ai are the periphery and area of districts’ built areas, respectively. Shape index and fractal dimension are two new indicators that are defined to measure the effect of the geometrical shape of the districts on urban sprawl. To our knowledge, these indicators have not been used to measure sprawl in Iran and therefore their effect on sprawl is one aspect of the innovation of this study.
5- Results
In factor analysis, 13 selected indicators were analyzed in SPSS software. In this analysis, eigenvalues of above 1.0 was
the criteria for selection of factors, Varimax method was used for rotation of factors and and principal component analysis method (PCA) was applied.
Table 3 shows the results of the KMO test and the Bartlett’s test of sphericity. According to statistical rules, 0.538 is acceptable value for KMO test and use of factor analysis for analyzing data is allowed. The result of the Bartlett sphericity test is 0.00, which rejects the assumption that the variables are uncorrelated. As a result, the variables are correlated with one another and factor analysis can be used.
The “extracted factors matrix” (table 4), which is one of the most important results of factor analysis, presents the correlation of variables with each factor. According to the definition, the correlations with the absolute value of over 0.4 indicate the causal relation between variable and factors, and in the case of a variable with two or more correlated factors, the factor that has the highest correlation with that variable is chosen as representative of that variable.
Table3. The results of KMO and Bartlett tests
0.538
Kaiser-Meyer-Olkin Measure of Sampling Adequacy.
212.844 Approx. Chi-Square
Bartlett's Test of Sphericity df 78
0.000 Sig.
Table4. Extracted factors matrix (1st factor analysis)
Abbreviated Title
Extracted Factors
1 2 3 4 5
GRSDSTY 0.829 -0.13 0.43 -0.182 -0.024
NETDSTY 0.726 -0.270 -0.146 0.087 0.26
MEANPTCH -0.765 -0.385 -0.130 0.162 -0.024
DSTY1500 -.636 -0.094 0.273 -0.306 -0.403
DSTY12500 0.677 -0.135 -0.162 0.365 -0.134
PCTRESID 0.632 -0.178 .017 -0.322 -0.037
PCTSMAL 0.254 0.487 .479 -0.593 -0.031
COMM200 0.335 -.388 0.329 0.255 0.536
EDU500 0.243 .296 -0.241 0.075 0.747
CBD1KM -0.142 -.597 0.545 0.159 -0.100
CBD3KM -0.244 .412 -0.616 -0.184 0.057
SHAPEIDX 0.027 .852 0.222 0.290 -0.061
FRACTAL -0.022 .800 0.343 0.419 -0.023
As it is clear, in extracted factors matrix, some variables are significantly correlated with over one factor (and in one case with three factors), which makes analysis and naming of factors problematic. The rotation of factors is suggested to solve this problem. As observed in the “Rotated Extracted Factors Matrix” (Table 5), common correlations have become less and at most with just two factors. In fact, rotation of factors simplifies interpretation and naming of factors.
As shown in Table 5, fifth factor explain only one variable, and that variable is “percentage of people in 500m radius of educational land use”. This indicates that this indicator does not show
much correlation with other factors and therefore should be removed from the list of variables and factor analysis should be performed again without this indicator.
Based on the previous results, factor analysis is performed for the second time by removing correlated indices with factor 5. For summarizing, in this section, only rotated extracted factors table is presented for the second factor analysis (Table 6). In second factor analysis, the KMO value calculated 0.543, which is acceptable. The result of Bartlett's sphericity was 0.000, which approves use of factor analysis to analyze data.
Ultimate results of factor analysis are presented in Table 7.
Table5. Rotated extracted factors matrix (1st factor analysis)
Abbreviated Title
Extracted Factors
1 2 3 4 5
GRSDSTY 0.620 -0.108 0.548 0.074 0.143
NETDSTY 0.697 -0.245 0.154 0.132 0.206
MEANPTCH -0.497 -0.244 -0.654 0.066 -0.197
DSTY1500 -0.826 -0.145 -0.006 0.133 0.152
DSTY12500 0.794 0.009 -0.038 0.115 0.093
PCTRESID 0.433 -0.310 0.494 0.078 0.055
PCTSMAL -0.180 0.253 0.884 -0.030 -0.069
COMM200 0.159 -0.118 0.002 0.609 0.559
EDU500 0.056 0.114 0.061 -0.250 0.829
CBD1KM -0.132 -0.184 -0.142 0.769 -0.213
CBD3KM -0.147 0.017 -0.112 -0.779 0.070
SHAPEIDX -0.002 0.897 0.142 -0.192 0.028
FRACTAL -0.038 0.962 0.060 -0.035 0.053
Table6. Rotated extracted factors matrix (2nd factor analysis)
Abbreviated Title Extracted Factors
1 2 3 4
GRSDSTY 0.631 -0.100 0.556 0.095
NETDSTY 0.725 -0.229 0.165 0.159
MEANPTCH -0.506 -0.247 -0.669 0.031
DSTY1500 -0.782 -0.136 0.000 0.117
DSTY12500 0.794 0.018 -0.029 0.140
PCTRESID 0.437 -0.306 0.494 0.087
PCTSMAL -0.203 0.245 0.879 -0.043
COMM200 0.244 -0.080 0.036 0.642
CBD1KM -0.194 -0.188 -0.162 0.752
CBD3KM -0.088 0.018 -0.105 -0.792
SHAPEIDX 0.004 0.897 0.145 -0.209
FRACTAL -0.032 0.965 0.064 -0.052
Table7. Results of factor analysis after naming factors
Factor Indicator Variance
Explained (%)
Density
Net density
27.834 Gross density
Percentage of population in density under 40 people per hectare
Percentage of population in density over 100 people per hectare
Configuration Shape index 21.564
Fractal index
Land use
Percentage of residential land use
11.342 Percentage of small lots (under 3000m2)
Average lot size
Accessibility
Percentage of people in 200m radius of commercial land use
9.482 Percentage of people in less than 1 km distance of CBD
Percentage of people in more than 3 km distance of CBD
Total 70.222
In order to draw maps of urban sprawl distribution in Isfahan, “factor scores” (which SPSS reports) are used. These scores are multiplied by the weight of each of the factors, which is the level of explanation of the variance of the sprawl phenomenon, to obtain weighted scores. The resulting scores for each of 39
districts are then normalized to values ranging between 0 and 1. Then, the scores are categorized in five classes by using “half-sigma” method, and finally the sprawl distribution maps are presented in terms of each factor (Figure 2).
Fig2. Maps of sprawl distribution in Qazvin City districts (Source: Authors)
6- Conclusion and Discussion The urban population is increasing all over the world. United Nations predicts that a major share of this increase will be occurring in the developing world by
2050. Therefore, planning and prediction of changes and impacts of urban sprawl on citizens' lives is one of the necessary issues on the agenda of urban planning especially in developing countries such as
Iran. Accordingly, in this study, the effort was concentrated on analyzing urban sprawl as one of the phenomena that arise from the increase in urbanization. For that, the theoretical foundations encompassing definitions, causes, and impacts and manifestations of sprawl were examined. Accordingly, in this study sprawl was defined as: “unplanned, far from the center and automobile-dependent growth that influences the environment, the economy and the social structure of the city, and can be characterized as having low concentration, segregation of land uses and limited accessibility”. Then, Iranian and international research, which measured this phenomenon by using different methods and indicators, were studied. In the end, 13 indicators were selected for this research and data values attributed to each of them were collected. Finally, by performing two stages of factor analysis and removing one of the indicators (percentage of population within 500-meter distance of educational land use) because of weak correlation with other variables, the remaining indicators were classified into four factors: “density”, “configuration”, “land use” and “accessibility.” The analysis, which has been performed in the case of Qazvin City, shows that these factors explain the variance of sprawl by 27.8, 21.6, 11.3 and 9.5 percent respectively. The explanatory power of “configuration factor” (21.6%) indicates that the “shape index” and “fractal dimension” indicators introduced by Frenkel & Ashkenazi (2007) have a high impact on urban sprawl and should be considered when measuring this phenomenon. The results of this study (Table 7) show that the districts 17, 28, 38 and 39 of Qazvin City have been very dense and districts 4, 5, 7,
11 and 12 are considered highly sprawled. Moreover, southern districts are less sprawled compared to northern districts. This is because the horizontal expansion of the city of Qazvin has been to the north over time and has not yet accommodated enough population loading. This indicates that the northern areas of Qazvin City have more potential for infill development. The results of this research confirm density as the most explaining factor for urban sprawl, like many other researches (Ewing et al., 2002; Galster et al., 2001; Cutsinger et al., 2005; Paulsen, 2014; Hamidi & Ewing, 2014). For example, Ewing et al., (2002) conclude that nearly two-thirds of the variance of sprawl is explained the density factor.
In two key researches, multidimensional indicators were used to measure sprawl and many variables were measured for each districts. Not only Ewing et al. (2002) and Cutsinger et al. (2005) used multidimensional indicators such as the present paper for measurement of sprawl, but also used factor analysis to confirm the structural validity of indicators like this paper. Therefore, comparing the results of these two researches with the present study would shed light on future researches and show the differences related to case studies.
The result of factor analysis in Ewing et al., (2002) led to four factors of “density,” “land use mix in neighborhoods,” “activity concentration” and “access to streets” which respectively explained more variance of urban sprawl. These results are relatively consistent with the results of the present study, since in both cases the density factor has the highest variance explanation. The key difference between the two researches is in the configuration factor, since shape index
and fractal dimension has not been introduced in Ewing et al. (2002). This is in fact the innovation of the present article. The next factor identified in both researches is also consistent. The “land use” factor in the present paper is quite consistent with “land use mix in the neighborhoods” factor in Ewing et al. (2002). In the absence of the configuration factor, both factors were ranked second in terms of the explanation of variance, which makes this consistency even more significant. The fourth factors of two studies are also consistent, because both indicate the importance of accessibility in the explanation of urban sprawl. Therefore, the results of this study show acceptable consistency with Ewing et al. (2002), which is one of the seminal articles in urban sprawl literature.
In another research, which has used multidimensional indicators and factor analysis for measurement of urban sprawl, Cutsinger et al., (2005) have updated the methodology and data of Galster et al. (2001) employed 14 selected variables and factor analysis on these 14 variables resulted in 7 factors: density/ continuity, proximity, job distribution, mixed land use, housing centrality, nucelarity and housing concentration.
In this study, 14 variables were classified into seven factors, the fact that indicates the variance explanation of each factor is less than the present paper, but the common point is that the density is still the most explanative factor of urban sprawl. In Cutsinger et al., (2005) job distribution was among the indicators that were not included in the present paper due to lack of data. Moreover, the final factors of Cutsinger et al., (2005) are somehow smaller fractions of the factors of present research.
Because of the importance of “shape index” and “fractal dimension” and their power in explaining the variance of the sprawl phenomenon (21.564%), the exclusive result of this paper is that paying attention to the shape of districts and urban areas in the process of determining urban districts’ boundaries may have a significant effect on the level of sprawl.
Policy Implications
Although in most cities whether developed or developing, urban land is considered the biggest asset of urban management system, in Iranian cities it has become the most important source of revenue generation for municipalities. This situation encourages municipalities to “sell” more land without thinking about the various impacts (including long-term economic consequences) of this activity. Such a financing mechanism alters the role of municipalities from being “market regulator” (as in the classic mechanism of public sector) into “market actor”, which are interested in supplying more “goods” to earn more money. This leads to giving discounts for applicants of construction permits, incentive policies for construction, even inconsistent with detailed plan of the city (through Clause 5 Commission) and eventually leads to the horizontal expansion of urban lands.
This mechanism of financing is also common in local governments of China. Confronting with the pressures of developers for taking possession of urban lands and enthusiastic to accrue more money, local governments of China have ceded their urban land to accrue more money, which has been reported as one of key causes of urban sprawl in this country (Tian et al., 2017).
One of key ways to deal with this trend is urban planning. Urban planning can prevent excessive expansion of urban areas by encouraging infill development, providing incentives for high-density and levying taxes on low-density areas.
Nevertheless, it is impossible to solve this problem only in urban systems. The central government should also change financing of the municipalities in a way that their need and in fact, their willingness to cede urban land and earn money reduces. One of the solutions in this project is to allocate a portion of income and business taxes to municipalities to reduce their need to sell land rights. The passage of the Value Added Tax Code and make a share for municipalities is one of the measures taken in this regard and has contributed a substantial portion of the municipalities’ incomes over time. However, this share is not still the biggest, and even today, the majority of the municipalities’ incomes are related to land and construction. By devising accurate economic policies from central government and enhancing the efficiency of municipalities’ services, it is hoped that the dependence of the municipalities on unsustainable income sources of land and construction would reduce and the power of urban planning to control urban sprawl would increase.
7. References
Ahmadi, Gh., Azizi, M.M., & Zebardast, E. (2010). comparative study of sprawl in three middle cities of Iran (case study: cities of Ardebil, Sanandaj and Kashan).
Journal of Architecture and Urban Planning, 3(5), 25-43. (In Persian). Angel, S., Parent, J., & Civco, D. (2007,
May). Urban sprawl metrics: an analysis of global urban expansion using GIS. In
Proceedings of ASPRS 2007 Annual
Conference, Tampa, Florida May (Vol. 7, No. 11). Citeseer.
Azizi, M.M., & Arasteh, M. (2011). Urban Sprawl Explication Based on Construction Density Index (Case Study of Yazd City). Urban Identity, 5(8), 5-15. (In Persian).
Bhatta, B., Saraswati, S., & Bandyopadhyay, D. (2010). Urban sprawl measurement from remote sensing data. Applied geography, 30(4), 731-740.
Bogart, W. T. (2006). Don't Call it Sprawl: Metropolitan Structure in the 21st century. Cambridge University Press. Braçe, O. (2016). Study of the Effects of
Urban Morphology on Physical Activity.
Revista De Estudios Andaluces, 33 (1), 24–39.
Cutsinger, J., Galster, G., Wolman, H., Hanson, R., & Towns, D. (2005). Verifying the multi-dimensional nature of metropolitan land use: Advancing the understanding and measurement of sprawl. Journal of Urban Affairs, 27(3), 235-259.
Ehrlich, M. V., Hilber, C. A., & Schöni, O. (2018). Institutional settings and urban sprawl: Evidence from Europe. Journal of Housing Economics, 42, 4-18.
Estiri, H. (2014). Building and household X-factors and energy consumption at the residential sector: A structural equation analysis of the effects of household and building characteristics on the annual energy consumption of US residential buildings. Energy Economics, 43, 178-184.
Ewing, R. H., Pendall, R., & Chen, D. D. (2002). Measuring sprawl and its impact
(Vol. 1, p. 55). Washington, DC: Smart Growth America.
Ewing, R., Brownson, R. C., & Berrigan, D. (2006). Relationship between urban sprawl and weight of United States youth. American journal of preventive medicine, 31(6), 464-474.
Frenkel, A., & Ashkenazi, M. (2008). The integrated sprawl index: measuring the
urban landscape in Israel. The Annals of Regional Science, 42(1), 99-121.
Galster, G., Hanson, R., Ratcliffe, M. R., Wolman, H., Coleman, S., & Freihage, J. (2001). Wrestling sprawl to the ground: defining and measuring an elusive concept. Housing policy debate, 12(4), 681-717.
Garrido-Cumbrera, M., Ruiz, D. G., Braçe, O., & Lara, E. L. (2018). Exploring the association between urban sprawl and mental health. Journal of Transport & Health, 10, 381-390.
Habibi, S., & Asadi, N. (2011). Causes, results and methods of controlling urban sprawl. Procedia Engineering, 21, 133-141.
Hamidi, S., & Ewing, R. (2014). A longitudinal study of changes in urban sprawl between 2000 and 2010 in the United States. Landscape and Urban Planning, 128, 72-82.
Hennig, E. I., Schwick, C., Soukup, T., Orlitová, E., Kienast, F., & Jaeger, J. A. (2015). Multi-scale analysis of urban sprawl in Europe: Towards a European de-sprawling strategy. Land Use Policy,
49, 483-498.
Hosseini, S.H., & Hosseini, M. (2015). Analysis of effective factors on the dispersion of urban areas in Iran.
Journal of Planning and Space Design, 19 (4), 33-66. (In Persian).
Jaeger, J. A., & Schwick, C. (2014). Improving the measurement of urban sprawl: Weighted Urban Proliferation (WUP) and its application to Switzerland.
Ecological indicators, 38, 294-308. Jaeger, J. A., Bertiller, R., Schwick, C.,
Cavens, D., & Kienast, F. (2010). Urban permeation of landscapes and sprawl per capita: New measures of urban sprawl.
Ecological Indicators, 10(2), 427-441. Kahn, M. E. (2001). Does sprawl reduce the
black/white housing consumption gap?.
Housing Policy Debate, 12(1), 77-86. Liu, Z., Liu, S., Qi, W., & Jin, H. (2018).
Urban sprawl among Chinese cities of
different population sizes. Habitat International, 79, 89-98.
Moosavi, M.N., Ahar, h., Manoochehri, A., & Gheysari, H. (2015). Analysis of the effects of urban sprawl growth on social capital (Geographic Weight Regression Approach (GWR) - Case Study: Maragheh City). Journal of Sustainable City, 2(2), 51-66. (In Persian).
Navamuel, E. L., Morollón, F. R., & Cuartas, B. M. (2018). Energy consumption and urban sprawl: Evidence for the Spanish case. Journal of cleaner production, 172, 3479-3486.
Nazarnia, N., Schwick, C., & Jaeger, J. A. (2016). Accelerated urban sprawl in Montreal, Quebec City, and Zurich: Investigating the differences using time series 1951–2011. Ecological indicators,
60, 1229-1251.
Nechyba, T. J., & Walsh, R. P. (2004). Urban sprawl. Journal of economic perspectives,
18(4), 177-200.
Patacchini, E., Zenou, Y., Henderson, J. V., & Epple, D. (2009). Urban sprawl in Europe. Brookings-Wharton Papers on Urban Affairs, 125-149.
Paulsen, K. (2014). Geography, policy or market? New evidence on the measurement and causes of sprawl (and infill) in US metropolitan regions. Urban Studies,
51(12), 2629-2645.
Raeisi, H., & Esfandiyari, M.E. (2013). Explaining the Urban Distributed Development Process Based on the Holdern Model (Case Study: Sari City).
Journal of Environmental Studies Seven Hesar, 2 (5), 21-26. (In Persian).
Sardari, M., & Barati, N. (2009). Urban Strategic Development Program: Strategic Development Plan of Qazvin City by the year 1410 (from theory to practice).
Tehran: Artababa. (In Persian).
Terzi, F., & Bolen, F. (2009). Urban sprawl measurement of Istanbul. European Planning Studies, 17(10), 1559-1570. Tian, L., Li, Y., Yan, Y., & Wang, B. (2017).
Measuring urban sprawl and exploring
the role planning plays: A shanghai case study. Land Use Policy, 67, 426-435. Torrens, P. M. (2006). Simulating sprawl.
Annals of the Association of American Geographers, 96(2), 248-275.
Urban Consulting Engineers and Programs. (2005). Qazvin City Development Project. (In Persian).
Weilenmann, B., Seidl, I., & Schulz, T. (2017). The socio-economic determinants of urban sprawl between 1980 and 2010 in Switzerland. Landscape and Urban Planning, 157, 468-482.
Yue, Wenze., Zhang, Linlin & Liu, Yong. (2016). Measuring sprawl in large Chinese ctities along the Yangtze River via combined single and multidimensional metrics. Habitat International (57), 43-52. Zebardast, E. (2011). Urban and Regional
Planning Methodology 2. Department of Urban Planning, College of Fine Arts, University of Tehran. (In Persian). Zebardast, E., & Habibi, S. (2009). Investigating
the Sparawl Phenomenon and its Causes i n Z a n j a n . J o u r n a l o f F i n e A r t s ,
Architecture and Urban Development, No. 38, 115-124. (In Persian).
Zhang, C., Miao, C., Zhang, W., & Chen, X. (2018). Spatiotemporal patterns of urban sprawl and its relationship with economic development in China during 1990– 2010. Habitat International, 79, 51-60. Zhang, T. (2000). Land market forces and
government's role in sprawl: The case of China. Cities, 17(2), 123-135.