Medical Journal of the Islamic Republic of Iran (MJIRI)
Med J Islam Repub Iran. 2017(16 Dec);31.86. https://doi.org/10.14196/mjiri.31.86
______________________________
Corresponding author: Dr Behzad Raei, raeibehzad@gmail.com
1.Department of Management Sciences and Health Economics, School of Public Health, Tehran University of Medical Sciences, Tehran, Iran.
↑What is “already known” in this topic:
There is a well-established association between the number of inputs, outputs, and DMUs selected and efficiency scores.
→What this article adds:
This study collected a list of key rules (of thumb) on the inter-play of inputs, outputs, and DMUs, which could be considered by most researchers keen to apply DEA technique.
Efficiency measurement of health care organizations: What
models are used?
Ebrahim Jaafaripooyan1, Sara Emamgholipour1, Behzad Raei1*
Received: 10 Jun 2016 Published: 16 Dec 2017
Abstract
Background: Literature abounds with various techniques for efficiency measurement of health care organizations (HCOs), which
should be used cautiously and appropriately. The present study aimed at discovering the rules regulating the interplay among the num-ber of inputs, outputs, and decision- making units (DMUs) and identifying all methods used for the measurement of Iranian HCOs and critically appraising all DEA studies on Iranian HCOs in their application of such rules.
Methods: The present study employed a systematic search of all studies related to efficiency measurement of Iranian HCOs. A
search was conducted in different databases such as PubMed and Scopus between 2001 and 2015 to identify the studies related to the measurement in health care. The retrieved studies passed through a multi-stage (title, abstract, body) filtering process. Data extraction table for each study was completed and included method, number of inputs and outputs, DMUs, and their efficiency score.
Results: Various methods were found for efficiency measurement. Overall, 122 studies were retrieved, of which 73 had exclusively
employed DEA technique for measuring the efficiency of HCOs in Iran, and 23 with hybrid models (including DEA). Only 6 studies had explicitly used the rules of thumb.
Conclusion: The number of inputs, outputs, and DMUs should be cautiously selected in DEA like techniques, as their
proportionali-ty can directly affect the discriminatory power of the technique. The given literature seemed to be, to a large extent, unsuccessful in attending to such proportionality. This study collected a list of key rules (of thumb) on the interplay of inputs, outputs, and DMUs, which could be considered by most researchers keen to apply DEA technique.
Keywords: Healthcare, Efficiency Measurement, Data Envelopment Analysis (DEA), Rule of Thumb, Iran
Copyright© Iran University of Medical Sciences
Cite this article as:Jaafaripooyan E, Emamgholipour S, Raei B. Efficiency measurement of health care organizations: What models are used? Med J
Islam Repub Iran. 2017 (10 Dec);31:86. https://doi.org/10.14196/mjiri.31.86
Introduction
Efficiency simply means how optimal an organization makes use of its inputs to produce outputs (1), that is, the most goods or services out of the least resources. More broadly, it is conceived as the ability to do things right (2). Measuring and comparing the efficiency of decision- mak-ing units (an efficiency related term for organization, DMU hereafter) is useful for cutting costs and improving resource management. Thus, in recent years many studies have addressed efficiency measurements (3).
Efficiency is a broad concept, with varying types in-cluding technical, allocative, economic, scale, and man-agement. Technical (productive) efficiency (TE) is the difference between the actual output/input ratio and the ideal ratio, made up of scale and pure (managerial)
effi-ciency (4). Scale effieffi-ciency implies that the production share of each firm is optimal when the firm produces (good, service) at the minimum point of average cost. Management efficiency refers to using correct and optimal methods for management. Allocative (price) efficiency occurs, where the price equals the marginal cost of the resources used up in the production (5). However, in prac-tice, it is defined as choosing a combination of health care interventions, which besides minimizing the cost of pro-ducing each service, maximizes cost-effectiveness (6). Economic efficiency is technical multiplied by allocative efficiency, broadly pointing towards productivity, perfor-mance, quality, profit, and the reduction of total workforce employed and costs (7).
The Rule of thumb in improving discriminatory power of DEA- related techniques
Efficiency could be measured easily by dividing its out-puts by inout-puts. However, given the complexity of DMUs resulted from their numerous, and often various, objec-tives and multiple inputs and outputs, the measurement is complicated and challenging. Similar to the diversity of efficiency concept, there are fairly various approaches for measuring efficiency. Generally, efficiency assessment can be done by various methods including ratio analysis, least-squares regression (LSR), total factor productivity (TFP), stochastic frontier analysis (SFA), and Envelop-ment Analysis (DEA) (8-10). Specifically, they could be classified into parametric and nonparametric methods. Data (DEA) is a known nonparametric method for the analysis of technical efficiency. Using a set of data, an empirical efficiency frontier as a best practice frontier is created, which envelopes all other observations of DMUs. It is a linear programming technique that has no parameter to estimate. There is no restriction on the number of DMUs addressed as well as on the output and input varia-bles (11).
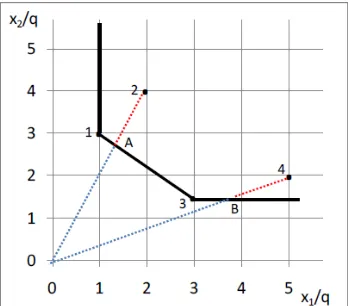
A firm using 2 inputs of X1, X2 and producing output Y, uses a production function to determine how much output Y should be produced (Fig. 1). The production function represents the maximum output that an organiza-tion can attain with the given combinaorganiza-tions of X1and X2. As displayed in the figure, Points 1 and 3, which are near-est to the origin and X1 and X2 axes would technically be efficient points because they could produce a unit of out-put by lesser inout-puts. A straight line between the 2 given points shows the efficiency frontier. A line parallel to X2 axis and another line parallel to the X1 axis can generate efficient frontiers (Fig. 1). Technical efficiency of x1 and x2 combination is as follows:
= ℎ ℎ
ℎ ℎ
Technical efficiency ranges from 0 to 1. A DMU on the efficiency frontier will receive a score of 1 and those not on the efficiency frontier line will be between 1 and 0. The frontier has been static, but it can be dynamic, and its status may change over time by technology improve-ments.
DMUs produce outputs using inputs in a given process. A limitation of DEA technique is that the result highly relies on the numbers of the inputs and outputs and their relationships, which should be selected cautiously, as any change in the number of those variables could affect the efficiency scores. This is a challenge for users of this technique because when the proposed rules regarding the numbers of inputs and outputs in proportion to the number of DMUs are not followed, some inefficient units may be wrongly considered efficient. Additional number of inputs and outputs or a strong correlation between the inputs or output themselves might also decrease DEA discriminato-ry power. Therefore, these issues should be in a way ad-dressed before DEA analysis (12). For example, in the case of preexisting correlation, the variables with the low-est co-correlation and the stronglow-est relationship with the commensurate inputs or outputs should be selected. As to the excessive number of inputs and outputs, some rule of thumbs, discussed in details later, should be followed, even though these have always been challenging for the researchers. DEA is also a common method used in esti-mating the efficiency of health care organizations such as hospitals.
Many studies have been conducted to investigate the productivity and efficiency of health care services (13-15). Given the abovementioned challenges, the results of these studies should be cautiously applied, particularly in devel-oping countries. In DEA, the setting, assumptions, type, and the number of variables could affect the results. How-ever, there is no universally accepted criterion or gold standard to compare the studies that measure the cy of health care units. Most of the studies on the efficien-cy measurement of Iranian health care organizations (HCOs) have not pointed to any clear rule on the propor-tion between the number of inputs, outputs, and DMUs. For example, in a systematic review of relevant literature, Jahangiri (16) argues that the theoretical aspects of DEA and its applicability should be considered for valid deci-sions. In addition, large numbers of inputs and outputs in proportion with the number of DMUs may diminish the discriminatory power of DEA (17).
The current study is of threefold objectives; firstly, to identify all models and methods used for the efficiency measurement of HCOs; secondly, to discover the rules regulating the relationship between the numbers of inputs and outputs in relation to the numbers of DMUs; and fi-nally, to critically appraise all the Iranian context related DEA studied with respect to their application of the rules corresponding to the number of inputs and outputs and DMUs.
Methods
This review study has employed a systematic search of all studies related to efficiency measurement of HCOs in Iran. The term of ‘efficiency’ was the only keyword used for searching efficiency measurement literature, and other similar words such as productivity, performance, and effi-cacy were not included. Inclusion criteria for selecting the articles of study are as follow:
1.Studies related to Iranian context
Fig. 1:Efficiency frontier in input-output map
2.Studies related to efficiency measurement in health care
3.Indication of any model or method of efficiency measurement by the articles
4.Articles in both English and Persian Languages 5.Time period between 2001 and 2015
Search strategy was built using Boolean operators (AND, OR, NOT), in which the title and abstract of arti-cles were searched separately in 2 languages. The search strategy and databases are illustrated in Table 1.
Data extraction
Study identification: A 3-step filter was employed to se-lect the final articles based on their title, abstract, and whole body considering preset inclusion criteria. One in-vestigator (BR) screened the title and abstract of the arti-cles identified. A small percentage of the artiarti-cles (25%) were randomly rechecked by a second reviewer (EJ) and a third reviewer became involved in case of any
disagree-ment (SE). Given the large percentage of the final articles using DEA for efficiency measurement, this study focused on identifying the rules related to the relationship among inputs, outputs, and DMUs in such a method. Therefore, the articles were critically appraised mostly with respect to addressing the rules regarding the relationship among inputs, outputs, and DMUs. These rules were identified drawing on the existing referral books in health care effi-ciency measurement by DEA (11, 18-21).
Data extraction table for each study was completed in-cluding the title of study, year, method, number of inputs and outputs, DMUs, and their efficiency score. Finally, the findings were reported in a descriptive way.
Results
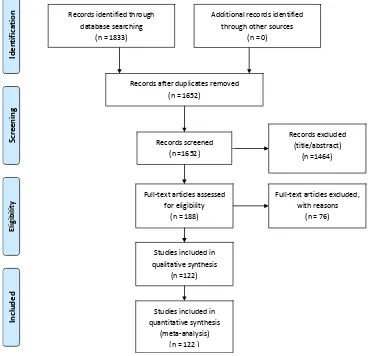
1.Efficiency measurement techniques/models In the initial search, we retrieved 1833 studies. As Dia-gram 1 exhibits, 181 studies were excluded because of duplication. Title and abstract screening led to the
exclu-Table 1. Search strategy and databases searched
General search strategy Iranian databases International databases
*((((health*[Title/Abstract]) OR hospi-tal[Title/Abstract])) AND Iran[Title/Abstract])
AND efficiency[Title/Abstract]
SID, Magiran, Iranmedex Scopus, Web of Science, Pubmed,
Springer, Science Direct
Fig. 2.Studies included in the systematic search Records identified through
database searching (n = 1833)
Scr
e
en
in
g
Incl
uded
El
ig
ib
ilit
y
Ide
nti
fica
tion Additional records identified through other sources
(n = 0)
Records after duplicates removed (n = 1652)
Records screened (n =1652)
Records excluded (title/abstract)
(n =1464)
Full-text articles assessed for eligibility
(n = 188)
Full-text articles excluded, with reasons
(n = 76)
Studies included in qualitative synthesis
(n =122)
Studies included in quantitative synthesis
(meta-analysis) (n = 122 )
The Rule of thumb in improving discriminatory power of DEA- related techniques
sion of 1493 articles, collectively, most of which were in Persian. Out of 188 articles, 36 were removed considering the main inclusion criteria, especially any use of efficien-cy measurement method or model for HCOs. One study was also excluded due to lack of access to its full text. A total of 122 papers reached to final stage of paper identifi-cation and assessment (Fig. 2), of which 32 were in Eng-lish and 90 in Persian. Overall, 73 studies exclusively used DEA, 17 applied Pabon Lasso, 5 used stochastic frontier analysis, 1 employed Malmquist index, and 1 study used a researcher-built model. The remaining 25 papers had adopted hybrid approaches (Table 2).
There have been a large number of studies on the
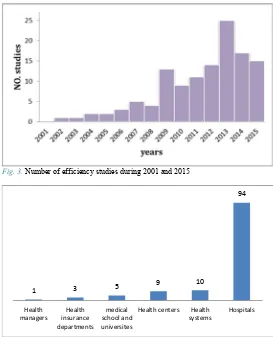
effi-ciency of the public and private sector organizations worldwide. In Iran, more than 120 studies were published on the efficiency of HCOs during 2001 and 2015, most of which had applied DEA. As demonstrated in Fig. 3, most of these researches were published during 2008 and 2012. Various organizations were under study in these papers (Fig. 4). Most of the papers (76%) assessed efficiency in hospitals, 9% compared efficiency in health units and health system between Iran and other countries and also among the province; 8% measured efficiency in health centers; 4% in medical universities, schools, and depart-ments; 2% assessed the efficiency of the health insurance organizations; and finally, 1% assessed the performance of health managers (Fig. 4).
2.Rules on the relationships among the number of in-puts, outin-puts, and corresponding DMUs
In DEA, the appropriateness of inputs, outputs, and DMUs number is a key determinant, which directly influ-ences the validity of the results. There are several rules of thumbs in the literature regulating such a relationship. Our review found 5 main rules regarding the number of inputs and outputs in relation to the number of DMUs in health care organizations including (M is the number of inputs and S the number of outputs).
R1: The number of DMU ≥ max {(m × s) or 3 (m + s)} R2: The number of DMU ≥ 3 (m + s)
R3: The number of fully efficient DMUs (FEDMUs) ≤ 1/3 DMUs
Table 2.Number of studies in each model
No. of studies Efficiency measurement methods
Type
73 DEA
Single
m
odel Pabon lasso 17
5 Stochastic frontier analysis (SFA)
1 Malmquist index
1 Researcher-built model
6 DEA and SFA
M
ixed
m
odels
6 DEA and Malmquist index
4 DEA and AHP
2 DEA and Pabon Lasso
2 DEA, Pabon Lasso, Malmquist index
1 DEA, Balanced Scorecard and Servqual
1 DEA and Goal Programming
1 DEA and Bargaining game
1 SFA and Balanced Scorecard
1 Ratio Method and multi-criteria
deci-sion-making method
Fig.3.Number of efficiency studies during 2001 and 2015
Fig. 4.Numbers of studies related to various organizations in the health sector
1 3 5 9
10
94
Health managers
Health insurance departments
medical school and universites
Health centers Health systems
Hospitals
R4: The number of DMUs ≥ 2(s + m) R5: The number of DMUs ≥ (m×s)
3.Appraisal of the studies with respect to the rules compliance
Overall, 96 studies had employed DEA technique to measure the efficiency of HCOs in Iran during 2001 and 2015, of which, 23 had hybrid models (Table 2). Only 6 studies had explicitly used the aforementioned rules out of 96, among which, 4 observed the R2, 1 study complied with R4, and finally 1 study applied R5. However, further analysis revealed that out of 96 studies, 44 had ignored the R2 completely and 48 had not clearly R2 indicated but followed it accidentally.
Discussion
The number of studies on efficiency measurement of HCOs in Iran has increased remarkably from 2001 to 2015, and the majority used the frontier approaches such as DEA and SFA. Almost 60% of studies applied DEA model given its clear advantages (22-27). Contrary to oth-er similar techniques, DEA is able to considoth-er multi-output and input processes, which are inherent in health care (28-30). Moreover, as DEA does not mostly address profit maximization or cost minimization (31, 32), it is more applicable in not-for-profit organizations such as public hospitals. It is also able to combine inputs and out-puts with various natures to generate efficiency score (31). Hospitals were at the forefront of efficiency measurement studies (94% of studies) because of their massive financial transactions in health sector and their large share of over-all health care costs (33), requiring strict efficiency en-hancement and cost containment. Not need to mention the fact that they are multiproduct organizations.
From 1978 that Charnes et al. (34) introduced DEA, the number of studies in this area have increased considera-bly. Despite these benefits, DEA suffers from some disad-vantages (35-38). For instance, it chooses the frontier from given DMUs and the comparison is made inside the reference set. Thus, if the frontier is not of a high efficien-cy, all results might be invalid, without rendering a real picture of the efficiency status. Therefore, the in-put/output-oriented approaches present different efficien-cy results. In response, the mixed methods of efficienefficien-cy measurement are introduced, moving towards combining DEA with SFA or Malmquist index. As each model has its own advantages and disadvantages, using hybrid models may overcome the disadvantages and strengthen the ad-vantages in making a comprehensive model with more robustness.
In addition, 5 main rules were found influencing the va-lidity of DEA results, which can allegedly enhance the discriminatory power of DEA models and improve the quality of results (39). Overall, the more the variety of inputs and outputs, the more comprehensive efficiency measurement results could be achieved. However, the discriminatory power of DEA increases if the number of DMUs rises in line with the number and variety of inputs and outputs (40). On the other hand, along with a growth
in the number and variety of inputs and outputs and result-ing heterogeneity, correspondresult-ing exogenous effects might appear and affect the results (12). In fact, a larger data set requires more accurate and complicated calculations.
Some studies have suggested that the small number of DMUs in DEA compared to that of inputs and outputs could lead to bias, while the high number of DMUs, if it is in proportion with the number of inputs and outputs, could shift the efficiency frontier towards a production (a real) frontier (41-44). Therefore, drawing on rules of thumb, the selection of inputs, outputs, and DMUs should be done cautiously, in a way that less important variables could be ignored or merged. As in the other measurement tech-niques such as regression, there is a degree of freedom for selecting variables; DEA is not an exception and its appli-cants are advised to use these rules. These rules are highly cited in the literature (11, 45-47). Especially, R2 is a commonly suggested rule on the interplay of inputs, out-puts, and DMUs (called ‘gold standard’ hereafter) in most studies measuring the efficiency of HCOs (17, 48-50).
A tiny percentage of the studies were found to be ob-serving the rules on the interplay of inputs, outputs, and DMUs, specifically the ‘gold standard’. It seems either there is no overall consensus in the usefulness of these rules for generating accurate efficiency measurement re-sults or they are ignorant of the rules. As most of the relat-ed literature publishrelat-ed especially, in developrelat-ed countries, have in a way implied to these rules, the latter appears more likely, though not certain.
This review also revealed that most of the studies meas-ure the technical efficiency and very few looked at other types such as allocative, economic, scale, or management efficiency. The reason is that these types of efficiencies require price of inputs, which are hardly accessible, or valid in HCOs.
Conclusion
HCOs are complicated systems, thus, efficiency meas-urement should be conducted based on transparent princi-ples. The number of inputs, outputs, and DMUs should be cautiously selected as their proportionality can directly affect the discriminatory power of DEA technique. No attention to the rules regulating such proportionality might lead to many efficient DMUs in DEA analysis, when they are not de facto. Despite a strong tendency of many re-searchers to DEA, it appeared not to be used correctly in most of the literature investigated, conveying a wrong message to the managers and policymakers of their HCOs’ performance status.
This study mainly investigated that whether a right number of inputs and outputs was considered in propor-tion to sample size (the number of DMUs), and vis-à-vis by Iranian DEA related literature published during 2001 and 2015. It has further identified, as a key contribution, a list of rules on the interplay of inputs, outputs, and DMUs, which could be considered by most researchers keen to apply DEA technique. Another study could be initiated to systematically appraise all related literature worldwide.
The Rule of thumb in improving discriminatory power of DEA- related techniques
Conflict of Interests
The authors declare that they have no competing interests.
References
References
1. Aday LA. Evaluating the healthcare system: effectiveness, efficiency, and equity: Health administration press; 2004. 2. Robbins L. The nature and significance of economic
science. The Philosophy of Economics: An Anthology. 1932:73-99.
3. Afzali HHA, Moss JR, Mahmood MA. A conceptual framework for selecting the most appropriate variables for measuring hospital efficiency with a focus on Iranian
public hospitals. Health Serv Manage Res.
2009;22(2):81-91.
4. Aigner D, Lovell CK, Schmidt P. Formulation and estimation of stochastic frontier production function
models. J Econom. 1977;6(1):21-37.
5. Palmer S, Torgerson DJ. Economics notes: Definitions of
efficiency. BMJ. 1999;318(7191):1136.
6. Liu X. Policy tools for allocative efficiency of health services: World Health Organization; 2003.
7. Barros CP, Mascarenhas MJ. Technical and allocative
efficiency in a chain of small hotels. Int J Hosp Manag.
2005;24(3):415-36.
8. Ozcan YA. Health care benchmarking and performance evaluation. An assessment using data envelopment analysis (DEA). 2008.
9. Banker RD, Charnes A, Cooper WW. Some models for estimating technical and scale inefficiencies in data
envelopment analysis. Manage Sci. 1984;30(9):1078-92.
10. Coelli TJ, Rao DSP, O'Donnell CJ, Battese GE. An introduction to efficiency and productivity analysis: Springer Science & Business Media; 2005.
11. Cooper WW, Seiford LM, Zhu J. Data envelopment analysis: Springer; 2004.
12. Sarkis J. Preparing your data for DEA. Modeling data irregularities and structural complexities in data envelopment analysis: Springer; 2007. p. 305-20.
13. Sepehrdust H, Rajabi E. Technical Efficiency Measurement of Social Security Hospitals. J School Pub Health Instit Pub Health Res. 2013;10(3):91-9.
14. Goudarzi R, RjabiGilan N, Ghasemi SR, Reshadat S, Askari R, Ahmadian M. Efficiency measurement using econometric stochastic frontier analysis (SFA) method, Case study: hospitals of Kermanshah University of Medical Sciences. J Kermanshah Univ Med Sci. 2014;17(10):666-72.
15. Matin BK, Rezaei S, Soofi M, Karyani AK. Assessing the performance of hospitals at Kermanshah University of Medical Sciences by Pabon Lasso Model (2006-2011). J Kermanshah Univ Med Sci. 2014;18(1):53-61.
16. Jahangiri A. Application of Data Envelopment Analysis Technique in Iranian hospitals (A Systematic Review). Journal of Hospital. 2016;15(3):103-24.
17. Cook WD, Tone K, Zhu J. Data envelopment analysis: Prior to choosing a model. Omega. 2014;44:1-4.
18. Zhu J. Quantitative models for performance evaluation and benchmarking: data envelopment analysis with spreadsheets: Springer; 2014.
19. Osman IH. Handbook of Research on Strategic Performance Management and Measurement Using Data Envelopment Analysis: IGI global; 2013.
20. Cooper WW, Seiford LM, Zhu J. Handbook on data
envelopment analysis: Springer Science & Business Media; 2011.
21. Hollingsworth B, Peacock SJ. Efficiency measurement in health and health care: Routledge; 2008.
22. Goudarzi R, Pourreza A, Shokoohi M, Askari R, Mahdavi M, Moghri J. Technical efficiency of teaching hospitals in Iran: the use of Stochastic Frontier Analysis, 1999–2011.
Int J Health Policy Manag. 2014;3(2):91.
23. Hatam N. The role of Data Envelopment Analysis (DEA) pattern in the efficiency of social security hospitals in Iran.
Iran Red Crescent Med J 2008;2008(3):211-7.
24. Hajialiafzali H, Moss J, Mahmood M. Efficiency measurement for hospitals owned by the Iranian social
security organisation. J Med Syst. 2007;31(3):166-72.
25. Pourreza A, Goudarzi G, Azadi H. Determination of technical efficiency of hospitals affiliated with Tehran University of Medical Science by the data envelopment analysis method: 1996-2006. Journal of School of Public Health & Institute of Public Health Research. 2010;7(4). 26. Shahhoseini R, Tofighi S, Jaafaripooyan E, Safiaryan R.
Efficiency measurement in developing countries: application of data envelopment analysis for Iranian
hospitals. Health Serv Manage Res. 2011;24(2):75-80.
27. Sheikhzadeh Y, Roudsari AV, Vahidi RG, Emrouznejad A, Dastgiri S. Public and private hospital services reform using data envelopment analysis to measure technical, scale, allocative, and cost efficiencies. Health Promot Perspect. 2012;2(1):28-41.
28. Collier T, Johnson AL, Ruggiero J. Technical efficiency estimation with multiple inputs and multiple outputs
using regression analysis. Eur J Oper Res.
2011;208(2):153-60.
29. Mantri JK. Research Methodology on Data Envelopment Analysis (DEA): Universal-Publishers; 2008.
30. Amirteimoori A, Toloie-Eshlaghi A, Homayoonfar M. Efficiency measurement in Two-Stage network structures
considering undesirable outputs. IJIM. 2014;6(1):65-71.
31. Haq M, Skully M, Pathan S. Efficiency of microfinance institutions: A data envelopment analysis. Asia-Pacific Financial Markets. 2010;17(1):63-97.
32. Berger AN, Humphrey DB. Efficiency of financial institutions: International survey and directions for future
research. Eur J Oper Res. 1997;98(2):175-212.
33. Mills A. The economics of hospitals in developing
countries. Part I: expenditure patterns. Health Policy Plan.
1990;5(2):107-17.
34. Charnes A, Cooper WW, Golany B, Seiford L, Stutz J. Foundations of data envelopment analysis for Pareto-Koopmans efficient empirical production functions. J Econom. 1985;30(1):91-107.
35. Ali AI, Lerme CS. Comparative advantage and
disadvantage in DEA. Ann Oper Res. 1997;73:215-32.
36. Wang EC, Huang W. Relative efficiency of R&D activities: A cross-country study accounting for environmental
factors in the DEA approach. Res Policy.
2007;36(2):260-73.
37. Hu JL, Chiu CN, Shieh HS, Huang CH. A stochastic cost efficiency analysis of international tourist hotels in
Taiwan. Int J Hosp Manag. 2010;29(1):99-107.
38. Donthu N, Hershberger EK, Osmonbekov T. Benchmarking marketing productivity using data
envelopment analysis. J Bus Res. 2005;58(11):1474-82.
39. Samoilenko S, Osei-Bryson KM. Increasing the discriminatory power of DEA in the presence of the sample heterogeneity with cluster analysis and decision trees.
Expert Syst Appl. 2008;34(2):1568-81.
40. Adler N, Yazhemsky E. Improving discrimination in data
envelopment analysis: PCA–DEA or variable reduction. Eur
J Oper Res. 2010;202(1):273-84.
41. Premachandra I. A note on DEA vs principal component
analysis: An improvement to Joe Zhu's approach. Eur J
Oper Res. 2001;132(3):553-60.
42. Andersen P, Petersen NC. A procedure for ranking
efficient units in data envelopment analysis. Manage Sci.
1993;39(10):1261-4.
43. Zhang Y, Bartels R. The effect of sample size on the mean efficiency in DEA with an application to electricity
distribution in Australia, Sweden and New Zealand. J Prod
Anal. 1998;9(3):187-204.
44. Li XB, Reeves GR. A multiple criteria approach to data
envelopment analysis. Eur J Oper Res. 1999;115(3):507-17.
45. Golany B, Roll Y. An application procedure for DEA. Omega. 1989;17(3):237-50.
46. Zervopoulos P. Dealing with small samples and dimensionality issues in data envelopment analysis. University Library of Munich, Germany, 2012.
47. Boussofiane A, Dyson RG, Thanassoulis E. Applied data
envelopment analysis. Eur J Oper Res. 1991;52(1):1-15.
48. Salinas-Jiménez J, Smith P. Data envelopment analysis
applied to quality in primary health care. Ann Oper Res.
1996;67(1):141-61.
49. Tone K, Tsutsui M. Network DEA: a slacks-based
measure approach. Eur J Oper Res. 2009;197(1):243-52.
50. Haksever C. Service management and operations: Pearson College Division; 2000.