Iran University of Medical Sciences
____________________________________________________________________________________________________________________
1. D, Specialist in Community Medicine, Child Growth and Development Research Center, Research Institute for Primordial Prevention of
Non-communicable Disease, Isfahan University of Medical Sciences, Isfahan, Iran. mirmoghtadaee@gmail.com
2. PhD, Associate Professor, Chronic Diseases Research Center, Endocrinology and Metabolism Population Sciences Institute, Tehran University of
Medical Sciences, Tehran, Iran. rheshmat@tums.ac.ir
3. PhD, Non-communicable Diseases Research Center, Endocrinology and Metabolism Population Sciences Institute, Tehran University of Medical
Sci-ences, Tehran, Iran & Development of Research & Technology Center, Deputy of Research and Technology, Ministry of Health and Medical Education, Tehran, Iran. shdjalalinia@gmail.com
4. MD, Chronic Diseases Research Center, Endocrinology and Metabolism Population Sciences Institute, Tehran University of Medical Sciences, Tehran,
Iran. nmgorji@yahoo.com
5. MD, Professor, Department of Pediatrics, Ahvaz Jundishapur University of Medical Sciences, Ahvaz, Iran. mohammad-motlagh1389@yahoo.com 6. MD, Pediatrician, Department of School Health, Bureau of Population, Family and School Health, Ministry of Health and Medical Education, Tehran,
Iran. ardalan_gelayol@yahoo.com
7. PhD, Assistant Professor, Managerial Epidemiology Research Center, Department of Public Health, School of Nursing and Midwifery, Maragheh
Uni-versity of Medical Sciences, Maragheh, Iran. saeidsafiri@gmail.com
8. MSc, Chronic Diseases Research Center, Endocrinology and Metabolism Population Sciences Institute, Tehran University of Medical Sciences,
Teh-ran, Iran. ahadi.ze@gmail.com
9. PhD Candidate, Chronic Diseases Research Center, Endocrinology and Metabolism Population Sciences Institute, Tehran University of Medical
Sci-ences, Tehran, Iran. gshafiee.endocrine@gmail.com, m.khoramdad@yahoo.com
10. MSc, Instructor, Department of Medical Emergency, Qom University of Medical Sciences, Qom, Iran. asayeshpsy@gmail.com
11. (Corresponding author) PhD, Assistant Professor, Department of Community Medicine, School of Medicine, Alborz University of Medical
es, Karaj, Iran & Chronic Diseases Research Center, Endocrinology and Metabolism Population Sciences Institute, Tehran University of Medical Scienc-es, Tehran, Iran. Mqorbani1379@yahoo.com
12. (Corresponding author) MD, Assistant Professor, Department of Pediatrics, Child Growth and Development Research Center, Research Institute for
The association of socioeconomic status of family and living
region with self-rated health and life satisfaction in children and
adolescents: The CASPIAN-IV study
Parisa Mirmoghtadaee1, Ramin Heshmat2, Shirin Djalalinia3, Nazgol Motamed-Gorji4
Mohammad Esmaeil Motlagh5, Gelayol Ardalan6, Saeid Safiri7, Zeinab Ahadi8, Gita Shafiee9
Hamid Asayesh10, Mostafa Qorbani*11, Omid Yaghini*12, Roya Kelishadi13
Received:27 September 2015 Accepted:8 September 2016 Published:15 October 2016
Abstract
Background:Socioeconomic status (SES) is a major determinant of health inequality in children and adoles-cents. The aim of this study was to evaluate the association of SES of family and living region with self-rated health (SRH) and life satisfaction (LS) among children and adolescents.
Methods:This study was a part of the fourth survey of a national surveillance program, which was conducted in 30 provinces of Iran in 2011-2012. LS and SRH were assessed by a questionnaire based on the World Health Organization-Global School-based student Health Survey (WHO-GSHS). Family SES was estimated using principal component analysis (PCA) and based on family assets, parental education and occupation, and type of school. Region SES was calculated using PCA and some variables including literacy rate, family assets and em-ployment rate.
Results: Out of 14,880 invited students, 13,486 (participation rate: 90.6%) completed the survey; of whom, 49.2% were girls, and 75.6% were from urban areas with the mean ± SD age of 12.47±3.36 years. In the multi-variate model, SES of family and living region was associated with LS and good SRH. In the full models, in addition to all potential confounders, family and living region SES were included simultaneously. However, only the association of family SES with LS, and good SRH remained statistically significant.
Conclusion:The effect of families’ SES on SRH and LS is more important than regional SES. The presented patterns of SRH and LS may be useful in developing better health policies and conducting complementary stud-ies in this field.
Keywords:Life Satisfaction, General Health, Socioeconomic Status, Children, Adolescents.
Cite this article as:Mirmoghtadaee P, Heshmat R, Djalalinia Sh, Motamed-Gorji N, Motlagh ME, Ardalan G, Safiri S, Ahadi Z, Shafiee G, Asayesh H, Qorbani M, Yaghini O, Kelishadi R. The association of socioeconomic status of family and living region with self-rated health and life satisfaction in children and adolescents: The CASPIAN-IV study.Med J Islam Repub Iran2016 (15 October). Vol. 30:423.
Introduction
Numerous studies have emphasized on a complex set of direct and indirect impacts of self-rated health (SRH) and life satisfac-tion (LS) on health issues, including mor-bidity and mortality (1-3). SRH is the indi-vidual’s perception of health status and can represent the impact of non-biomedical fac-tors as life style, psychosocial and socio-demographic conditions. LS is a subjective feeling of health that indicates general well-being. The association of LS and SRH has been documented in some previous studies (3,4).
Some studies showed that socioeconomic status (SES), which is extracted from par-ents’ education, family income etc., might be associated with SRH (5-8). The same association was found between SES and LS (9,10). Recently, it has been documented that geographical and environmental factors could affect LS (11-13).
SES as a major determinant of health ine-quality in children and adolescents might lead to progressive inequities in different aspects of physical, mental and social health (14,15). In this respect, the compara-tive effects of SES at individual or commu-nity levels remain controversial (15-18). We could not find any research comparing the association of SES of the living area and familial SES with LS and SRH in the literature. Most studies have been conduct-ed on adult populations and in high-income countries, and limited knowledge exists on the pediatric age groups and on low- and middle-income countries (7,8,19,20). Fur-thermore, we could not find any study on the mentioned subject in the Middle East and North Africa (MENA) region.
This study aimed to evaluate the associa-tion of family and living region SES with LS and SRH in a nationally representative sample of a pediatric population in Iran.
Methods
This study was a part of the fourth survey of a national surveillance program, entitled: Childhood and Adolescence Surveillance
and Prevention of Adult
Non-communicable Diseases (CASPIAN-IV) study, which was conducted in 30 provinc-es in Iran in 2011-2012.
The study methodology was published in detail (21), so we present it in brief in this study. Ethical committees of Tehran Uni-versity of Medical Sciences and Isfahan University of Medical Sciences reviewed and approved the study protocols. After thoroughly explaining the procedure, we obtained written informed consent from the parents and oral agreement from the stu-dents.
The study participants were students from elementary, middle and high schools of ur-ban and rural areas. They were selected by multistage cluster sampling method. Strati-fication was performed according to school grade and living area (urban, rural). The total sample size was calculated as 14,880 students (48 clusters of 10 students in each province).
The students’ questionnaire was prepared in Farsi and based on the World Health Or-ganization- Global School-based student Health Survey (WHO-GSHS). Another questionnaire was developed for the par-ents. The reliability and validity of the questionnaire have been confirmed previ-ously (22). LS and SRH of students were assessed by the following questions:
SRH was assessed by the following item: “How would you describe your general state of health?” The categories of response were “perfect,” “good,” “moderate,” and “bad”. LS was measured by a single item as well; the participants were asked to indicate their degree of life satisfaction using a tenth-point scale from 1= very dissatisfied to 10 = very satisfied. Scores below 6 sig-nified dissatisfaction and those equal to or more than 6 denoted satisfactions. The LS score was calculated according to this cate-gory.
To compare the SES of the living area, we categorized Iran into four subnational regions according to a previous study, which had used principal component analy-sis (PCA) based on geography and SES (23). Some variables from the 2006
al census including literacy rate, family as-sets and employment rate were used to cal-culate SES. According to this classification, the Southeast and Central regions had the lowest and highest SES, respectively.
The method and variables used for calcu-lating family SES were approved previous-ly in the International Reading Literacy Study (PIRLS) (24). Using PCA, some var-iables including family assets (including house, car and computer), parental educa-tion and occupaeduca-tion, as well as the school type (private/public) were summarized in one main component for constructing fami-ly SES. Students were classified in low, moderate and high SES based on this com-ponent.
We reported the frequency of LS and good SRH with 95% confidence interval (CI). LS score (range: 1-10) was also con-sidered as a continuous variable and report-ed as mean and 95% CI. The frequency of LS and good SRH across family SES was assessed using Chi-square test. The mean comparison of LS score across family SES was tested using ANOVA test. To adjust the potential confounders, logistic regres-sion analysis was utilized to evaluate the association between SES of family and re-gion with LS and SRH in different models. Model I was a crude model (without ad-justment). In Model II, the association was adjusted for age, sex and living place; and in Model III, family size, physical activity, screen time activity, smoking status, birth order and living with parents were also ad-justed. In Model IV, in addition to Model III variables’, SES of family and regions were entered simultaneously in the model. Using survey analysis method, all analyses were performed at national, regional and individual levels. Data were analyzed using survey data analysis methods in the STATA Corp. 2011 (Stata Statistical Soft-ware: Release 12. College Station, TX: Stata Corp LP. Package).
Results
In this survey, 13,486 out of 14,880 invit-ed students completinvit-ed the study
(participa-tion rate: 90.6%). Their mean ± SD age was 12.47±3.36 years, with no significant dif-ference between girls and boys. Students included 6,640 (49.2%) girls and 6,846 (50.8%) boys; of them, 75.6% were from urban and 24.4% were from rural areas. The number of participants in Southeast (lowest SES rank), North-Northeast (sec-ond low SES rank), West (sec(sec-ond high SES rank) and Central (highest SES rank) re-gions were 1,181 (8.76%), 2,359 (17.49%), 6,119 (45.37%) and 3,827 (28.38%), re-spectively.
The mean of LS score, frequency of LS and good SRH according to SES of the liv-ing area are presented in Table 1, which displays that participants from the second low SES region had the highest mean of LS score (8.26), highest frequency of LS (82.05%) and good SRH (81.44%).
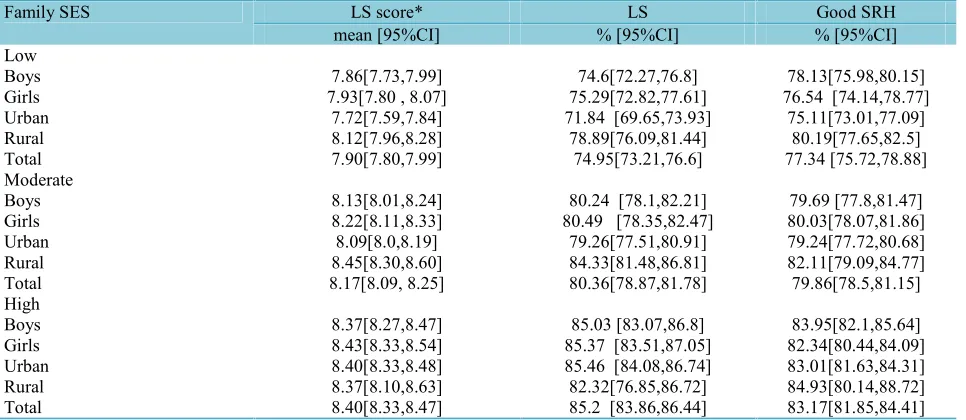
Table 2 demonstrates the same associa-tion between LS and SRH with family SES. The abovementioned variables were signif-icantly associated with family SES, as the highest mean LS score (8.4), frequency of LS (85.2%) and good SRH (83.17%) were observed in the high family SES (p<0.01).
Table 3 describes OR of higher LS and SRH in different regional and familial SES levels in multiple logistic regression mod-els. Regional SES showed a significant as-sociation with LS in the second low and the highest categories (OR: 1.36 and 1.27, re-spectively) and with good SRH in the sec-ond-low and the second-high categories (OR: 1.30 and 1.28, respectively) of the third model. In model III, high and moder-ate family SES, compared to low family SES, increased the OR of LS and good SRH. In the fourth model, in addition to all potential confounders, family and regions’ SES were adjusted although a significant association was found in the third model in regions’ SES with LS, and good SRH was not present. However, the association of family SES with LS and good SRH re-mained statistically significant. In this model (fourth model), moderate family SES, compared to low family SES, in-creased the OR of LS (OR: 1.42, 95% CI:
1.25-1.60) and good SRH (OR: 1.21, 95% CI: 1.07-1.36). Moreover, high family SES, compared to low family SES, increased the OR of LS (OR: 2.09, 95% CI: 1.81-2.41)
and good SRH (OR: 1.57, 95% CI: 1.36-1.81).
Table 1. The association between life satisfaction and self-rated health with socioeconomic status of the living region: The CASPI-AN-IV study Good SRH LS LS score* Regions’ SES % [95%CI] % [95%CI] Mean [95%CI] Lowest SES (Southeast)
78.55[74.34,82.23] 72.81[66.68,78.18] 7.87[7.56,8.19] Boys 74.96[69.86,79.45] 78.82 [74.66,82.46] 8.17[7.95,8.39] Girls 75.39[70.88,79.4] 76.63[72.05,80.65] 8.0[7.75,8.26] Urban 78.18 [72.93,82.65] 75.28[69.2,80.51] 8.06[7.75,8.37] Rural 76.64[73.27,79.7] 76.02[72.42,79.29] 8.03[7.83,8.22] Total
Second Low SES (North-Northeast)
83.18[80.34,85.68] 82.06[79.02,84.74] 8.28[8.1,8.46] Boys 79.66[76.68,82.34] 82.05[79.17,84.61] 8.25[8.08,8.42] Girls 80.76[78.37,82.95] 81.87[79.5,84.03] 8.21[8.06,8.36] Urban 83.23[79.02,86.74] 82.53[78.03,86.28] 8.41[8.15,8.67] Rural 81.44[79.38,83.33] 82.05 [79.97,83.96]
8.26 [8.13,8.39] Total
Second High SES (West)
80.74[78.93,82.44] 78.89 [76.81,80.82] 8.01[7.89,8.13] Boys 80.43[78.48,82.24] 79.67[77.53,81.65] 8.2[8.07,8.32] Girls 80.21[78.71,81.62] 78.86[77.13,80.49] 8.07[7.97,8.17] Urban 81.75[78.91,84.29] 80.54[77.35,83.37] 8.2[8.02,8.39] Rural 80.59[79.27,81.84] 79.27 [77.77,80.7] 8.10 [8.01,8.19] Total
Highest SES (Central)
79.11[76.9,81.16] 81.03[78.6,83.24] 8.17[8.04,8.31] Boys 79.06[76.83,81.12] 80.57[77.92,82.96] 8.15[8.01,8.29] Girls 78.94 [77.31,80.48] 80.42[78.46,82.25] 8.14[8.04,8.25] Urban 79.87 [75.03,83.97] 82.89[78.54,86.5] 8.26[8.01,8.5] Rural 79.08[77.53,80.56] 80.81 [79.03,82.47]
8.16 [8.06,8.25] Total National 80.51[79.33,81.64] 79.58 [78.22,80.88] 8.09[8.01,8.17] Boys 79.4[78.13,80.61] 80.25 [78.91,81.53] 8.18[8.11,8.26] Girls 79.59[78.62,80.53] 79.72 [78.62,80.78] 8.11[8.05,8.17] Urban 81.12[79.21,82.89] 80.51 [78.44,82.42] 8.23[8.11,8.35] Rural 80.13 [79.25,80.99] 80.17 [79.18,81.13] 8.14 [8.08,8.2] Total
LS: life satisfaction; SRH: Self-rated health; SES: Socio-economic status, *The range of this score is 1-10
Table 2. The association between life satisfaction and self-rated health with family socioeconomic status: The CASPIAN-IV study Good SRH LS LS score* Family SES % [95%CI] % [95%CI] mean [95%CI] Low 78.13[75.98,80.15] 74.6[72.27,76.8] 7.86[7.73,7.99] Boys
76.54 [74.14,78.77] 75.29[72.82,77.61]
7.93[7.80 , 8.07] Girls
75.11[73.01,77.09] 71.84 [69.65,73.93]
7.72[7.59,7.84] Urban 80.19[77.65,82.5] 78.89[76.09,81.44] 8.12[7.96,8.28] Rural 77.34 [75.72,78.88] 74.95[73.21,76.6] 7.90[7.80,7.99] Total Moderate 79.69 [77.8,81.47] 80.24 [78.1,82.21]
8.13[8.01,8.24] Boys
80.03[78.07,81.86] 80.49 [78.35,82.47]
8.22[8.11,8.33] Girls 79.24[77.72,80.68] 79.26[77.51,80.91] 8.09[8.0,8.19] Urban 82.11[79.09,84.77] 84.33[81.48,86.81] 8.45[8.30,8.60] Rural 79.86[78.5,81.15] 80.36[78.87,81.78] 8.17[8.09, 8.25] Total High 83.95[82.1,85.64] 85.03 [83.07,86.8] 8.37[8.27,8.47] Boys 82.34[80.44,84.09] 85.37 [83.51,87.05]
8.43[8.33,8.54] Girls
83.01[81.63,84.31] 85.46 [84.08,86.74]
8.40[8.33,8.48] Urban 84.93[80.14,88.72] 82.32[76.85,86.72] 8.37[8.10,8.63] Rural 83.17[81.85,84.41] 85.2 [83.86,86.44]
8.40[8.33,8.47] Total
LS: life satisfaction; SRH: Self-rated health; SES: Socio-economic status, *The range of this score is 1-10
Discussion
To the best of our knowledge, this was the first national study in the MENA region to examine the association of family and living region SES on LS and SRH in a large population-based sample of children and adolescents.
Our finding revealed that the effect of families’ SES on SRH and LS was more important compared to regional SES. A large body of evidence underscores the role of family structure on LS (15,16,25,26). SRH in a complex set of different determi-nants is influenced by different familial fac-tors that most of the time might have more important roles than social and national fac-tors (27,28). Recent extensive related anal-ysis has revealed that higher national in-come inequality is related to more psycho-logical and physical symptoms. Higher na-tional income inequality is also related to
larger SES differences in psychological and physical symptoms and life satisfaction (29).
Our study showed that participants living in the region with lowest SES had the low-est LS score compared to other three re-gions, and this might be attributed to differ-ent geographical, environmdiffer-ental, socio-economical and even personal factors. From them, very hot climate of this region and SES had been more emphasized in pre-vious studies (30,31).
Although the central region of Iran had the highest SES, children and adolescents of this region did not report the highest LS or good SRH. The highest LS score and LS and good SRH were reported from North and northeast of Iran. In addition to the studied factors such as ethnic differences and cultural behaviors, humid climate with the highest levels of rain in this region
Table 3. Odds Ratios (95% CI) for Life Satisfaction and Self-rated Health with Region and Family Socioeconomic Status in Iranian Adolescents and Children : The CASPIAN-IV study
Variables LS Good SRH
Model I1 Regions’ SES Lowest Reference Reference
Second low SES 1.44 [1.14,1.83]* 1.33[1.07,1.67]*
Second high SES 1.21[0.98,1.49] 1.27[1.04,1.54]*
Highest 1.33[1.06,1.66]* 1.15[0.94,1.41]
Family SES Low Reference Reference
Moderate 1.36[1.21-1.53]* 1.16[1.03-1.3]*
High 1.92[1.68-2.19]* 1.44[1.27-1.64]*
Model II2 Regions’ SES Lowest Reference Reference
Second low SES 1.43[1.15,1.79]* 1.33[1.08,1.65]*
Second high SES 1.2 [0.98,1.46] 1.26[1.05,1.53]*
Highest 1.30[1.05,1.60] * 1.14[0.93,1.38]
Family SES Low Reference Reference
Moderate 1.40[1.25-1.58]* 1.18[1.05-1.32]*
High 2.10[1.83-2.40]* 1.54[1.35-1.75]*
Model III3 Regions’ SES Lowest Reference Reference
Second low SES 1.36[1.09,1.71]* 1.30[1.05,1.62] *
Second high SES 1.17[0.95,1.43] 1.28[1.05,1.56]*
Highest 1.27[1.02,1.57]* 1.16[0.94,1.41]
Family SES Low Reference Reference
Moderate 1.41[1.25-1.60]* 1.19[1.06-1.34]*
High 2.05[1.77-2.37]* 1.51[1.31-1.74]*
Model IV4 Regions’ SES Lowest Reference Reference
Second low SES 1.27[0.98 , 1.61] 1.24[0.99,1.56]
Second high SES 1.13[0.91,1.41] 1.25[0.99,1.54]
Highest 1.15[0.91,1.45] 1.08[0.87,1.34]
Family SES Low Reference Reference
Moderate 1.42[1.25-1.60]* 1.21[1.07-1.36]*
High 2.09[1.81-2.41]* 1.57[1.36-1.81]*
LS: life satisfaction; SRH: Self-rated health; SES: Socio-economic status 1Without adjustment [crude models)
2Adjusted for age and sex, living place
3Additionally adjusted for family size, physical activity, screen time activity, smoking status, birth order, living with parents 4In this model, in addition to Model III variables’, family SES and regions SES were simultaneously considered in the model *Statistically significant
might have led to the differences in the par-ticipants’ self-assessment of quality of life (32-35). In this respect, the role of individ-ual factors was more highlighted than re-gional determinants. In the fourth model, simultaneous evaluation of all possible in-fluencing factors revealed the impact of the association of family SES with LS and good SRH.
Based on our findings, children and ado-lescents living in rural areas had better LS score and SRH. An industrialized type of living and higher rate of air pollution in ur-ban areas might be responsible for these differences (35,36). Our findings are in line with a previous study showing a negative relationship between local environmental problems and life satisfaction (35,37,38). In some studies, ambient ozone, SO2 and NO2 levels were negatively associated with LS (11,12). Poor air quality might decrease lung function, aggravate asthma, cause chronic bronchitis and premature death in people with heart and lung diseases (36). However, some controversies exist about the air pollution and LS relationship. Alt-hough some studies have found limited im-pact of pollution on LS, some evidences revealed inverse associations between them (11).
The main noteworthy strength of this study was its comprehensive approach, benefitting from a large national repre-sentative sample of Iranian children and adolescents. Moreover, this study was de-signed and conducted based on the World Health Organization- Global School-based student Health Survey (WHO-GSHS) standardized protocol. The main limitation of this study was its cross-sectional nature, and its other limitation was the recall bias of the participants in recollecting some of the information.
Conclusion
Our finding revealed that the effect of families’ SES on SRH and LS is more im-portant, compared to regional SES. The complex discussed patterns of SRH and LS could be useful for different stakeholders
with diverse views in developing better health policies and conducting more target-ed studies in relattarget-ed fields.
Acknowledgments
This nationwide survey was conducted in Iran with the cooperation of the Ministry of Health and Medical Education, Ministry of Education and Training, Child Growth and Development Research Center, Isfahan University of Medical Sciences, and Endo-crinology and Metabolism Research center of Tehran University of Medical Sciences.
Conflict of interest
The authors declare that they have no conflict of interest.
Funding
This study was conducted as part of a na-tional school-based survey.
Ethical Standard
A comprehensive verbal description of the nature and purpose of the study was provided to the students, their parents and teachers. Written informed consent was ob-tained from parents. Ethical committees of Tehran University of Medical Sciences and Isfahan University of Medical Sciences re-viewed and approved study protocols.
References
1. Idler EL, Benyamini Y. Self-rated health and mortality: a review of twenty-seven community studies. Journal of health and social behavior 1997:21-37.
2. Herman KM, Hopman WM, Rosenberg MW. Self-rated health and life satisfaction among Canadian adults: associations of perceived weight status versus BMI. Quality of Life Research 2013;22(10):2693-705.
3. Koivumaa-Honkanen H, Honkanen R, Viinamäki H, Heikkilä K, Kaprio J, Koskenvuo M. Self-reported life satisfaction and 20-year mortality in healthy Finnish adults. American Journal of Epidemiology 2000;152(10):983-91.
4. Eriksson I, Undén A-L, Elofsson S. Self-rated health. Comparisons between three different measures. Results from a population study. International journal of epidemiology 2001; 30(2):326-33.
5. Lim WY, Ma S, Heng D, Bhalla V, Chew SK. Gender, ethnicity, health behaviour & self-rated health in Singapore. BMC Public Health 2007; 7(1):184.
6. Kim M, Chung W, Lim S, Yoon S, Lee J, Kim E, et al. [Socioeconomic inequity in self-rated health status and contribution of health behavioral factors in Korea]. Yebang Uihakhoe chi 2010;43(1):50-61.
7. Bauer GF, Huber CA, Jenny GJ, Müller F, Hämmig O. Socioeconomic status, working conditions and self-rated health in Switzerland: explaining the gradient in men and women. International journal of public health 2009;54(1):23-30.
8. Månsson NO, Merlo J. The relation between self-rated health, socioeconomic status, body mass index and disability pension among middle-aged men. European journal of epidemiology 2001; 17(1):65-9.
9. Daraei M, Mohajery A. The impact of socioeconomic status on life satisfaction. Social indicators research 2013;112(1):69-81.
10. Gitmez AS, Morcöl G. Socio-economic status and life satisfaction in Turkey. Social indicators research 1994;31(1):77-98.
11. Luechinger S. Valuing Air Quality Using the Life Satisfaction Approach. The Economic Journal 2009;119(536):482-515.
12. Welsch H. Environment and happiness: Valuation of air pollution using life satisfaction data. Ecological Economics 2006;58(4):801-13.
13. Currie C, Zanotti C, Morgan A, Currie D. Social determinants of health and well-being among young people 2012.
14. Viner RM, Ozer EM, Denny S, Marmot M, Resnick M, Fatusi A, et al. Adolescence and the social determinants of health. The Lancet 2012; 379(9826):1641-52.
15. Currie C. Social determinants of health and well-being among young people: World Health Organization Regional Office for Europe Copenhagen, Denmark; 2012.
16. Huebner ES. Research on assessment of life satisfaction of children and adolescents. Social indicators research 2004;66(1-2):3-33.
17. Veenstra G. Social capital, SES and health: an individual-level analysis. Social science & medicine 2000;50(5):619-29.
18. Pinquart M, Sörensen S. Influences of socioeconomic status, social network, and competence on subjective well-being in later life: a meta-analysis. Psychology and aging 2000; 15(2):187.
19. Dowd JB, Zajacova A. Does the predictive power of self-rated health for subsequent mortality risk vary by socioeconomic status in the US? International journal of epidemiology 2007; 36(6):1214-21.
20. Riva M, Gauvin L, Barnett TA. Toward the next generation of research into small area effects
on health: a synthesis of multilevel investigations published since July 1998. Journal of epidemiology and community health 2007;61(10):853-61.
21. Kelishadi R, Ardalan G, Qorbani M, Ataie-Jafari A, Bahreynian M, Taslimi M, et al. Methodology and early findings of the fourth survey of childhood and adolescence surveillance and prevention of adult non-communicable disease in Iran: The CASPIAN-IV study. International journal of preventive medicine 2013;4(12):1451.
22. Kelishadi R, Majdzadeh R, Motlagh ME, Heshmat R, Aminaee T, Ardalan G, et al. Development and evaluation of a questionnaire for assessment of determinants of weight disorders among children and adolescents: The Caspian-IV study. International journal of preventive medicine 2012;3(10):699.
23. Farzadfar F, Danaei G, Namdaritabar H, Rajaratnam JK, Marcus JR, Khosravi A, et al. National and subnational mortality effects of metabolic risk factors and smoking in Iran: a comparative risk assessment. Popul Health Metr 2011;9(1):55.
24. Caro DH, Cortés D. Measuring family socioeconomic status: An illustration using data from PIRLS 2006. IERI Monograph Series Issues and Methodologies in Large-Scale Assessments 2012;5:9-33.
25. Zullig KJ, Valois RF, Huebner ES, Drane JW. Associations among family structure, demographics, and adolescent perceived life satisfaction. Journal of child and Family studies 2005;14(2):195-206.
26. Gilman R, Huebner S. A review of life satisfaction research with children and adolescents. School Psychology Quarterly 2003;18(2):192.
27. Bradley RH, Corwyn RF. Socioeconomic status and child development. Annual review of psychology 2002;53(1):371-99.
28. Zullig KJ, White RJ. Physical activity, life satisfaction, and self-rated health of middle school students. Applied Research in Quality of Life 2011;6(3):277-89.
29. Elgar FJ, Pförtner T-K, Moor I, De Clercq B, Stevens GW, Currie C. Socioeconomic inequalities in adolescent health 2002–2010: a time-series analysis of 34 countries participating in the Health Behaviour in School-aged Children study. The Lancet 2015;385(9982):2088-95.
30. Zullig KJ, Valois RF, Huebner ES, Drane JW. Adolescent health-related quality of life and perceived satisfaction with life. Quality of Life Research 2005;14(6):1573-84.
31. Strine TW, Chapman DP, Balluz LS, Moriarty DG, Mokdad AH. The associations between life satisfaction and health-related quality of life, chronic illness, and health behaviors among US community-dwelling adults. Journal of community health 2008;33(1):40-50.
32. Spein AR, Pedersen CP, Silviken AC, Melhus M, Kvernmo SE, Bjerregaard P. Self-rated health
among Greenlandic Inuit and Norwegian Sami adolescents: associated risk and protective correlates. International journal of circumpolar health 2013;72.
33. Taylor RM, Gibson F, Franck LS. A concept analysis of health‐related quality of life in young people with chronic illness. Journal of clinical nursing 2008;17(14):1823-33.
34. Ostrove JM, Adler NE, Kuppermann M, Washington AE. Objective and subjective assessments of socioeconomic status and their relationship to self-rated health in an ethnically diverse sample of pregnant women. Health Psychology 2000;19(6):613.
35. Di Tella R, MacCulloch RJ, Oswald AJ. The macroeconomics of happiness. Review of Economics and Statistics 2003;85(4):809-27.
36. Haseli-Mashhadi N, Pan A, Ye X, Wang J, Qi Q, Liu Y, et al. Self-Rated Health in middle-aged and elderly Chinese: distribution, determinants and associations with cardio-metabolic risk factors. BMC Public Health 2009;9(1):368.
37. Ferrer-i-Carbonell A, Gowdy JM. Environmental degradation and happiness. Ecological Economics 2007;60(3):509-16.
38. Silva J, de Keulenaer F, Johnstone N. Environmental quality and life satisfaction 2012.