Improving SUMO's Signal Control Programs
by Introducing Route Information
Yun-Pang Flötteröd
1and Michael Behrisch
11 Institute of Transportation Systems,
Germany Aerospace Center, Germany
[email protected], [email protected]
Abstract
To overcome the data insufficiency and achieve reasonable simulation results this paper has proposed to use the Webster’s delay model, together with given route information, to optimize traffic signal programs generated by SUMO. The pre-timed traffic signal cycle length and the green time allocation will be optimized for each given traffic signal program accordingly. The proposed approach takes also signal sharing among intersections into account. Two cases studies, i.e. one single intersection and one traffic signal controlled area, are conducted to evaluate the performance of the proposed approach. The simulation results show that there are apparent reductions in average trip duration, waiting time, time loss and departure delay with use of the proposed approach. The traffic efficiency can be improved consequently. In addition, some issues are pointed out as future works for extending the proposed approach.
1
Introduction
Traffic signals at intersections control the available green time for each traffic movement and therefore have a dominant influence on intersection capacity and network performance. Traffic signal control can be generally classified as pre-timed, semi-actuated, and fully actuated control. The latter two control methods comply with the concept of adaptive signal control and need a certain amount of detectors and respective control algorithms, which decide the green time durations for traffic movements according to pre-designed signal phase diagrams. The green times can therefore be dynamically allocated to different traffic movement groups for reducing/minimizing vehicular delay. Instead of that, pre-timed traffic signals are not dynamically demand-responsive and controlled by fixed timing plans, which are normally optimized for different periods according to historical traffic volumes. Generally speaking, adaptive signal control performs better than pre-timed signal control during off-peak periods, since traffic volumes may vary quite widely due to travelers’ various activities. Traffic during peak hours is however mainly commuter traffic and its amount and pattern are quite stable. Therefore, the performances of these three control methods are quite similar during
Engineering
Volume 2, 2018, Pages 162–172
peak hours. Many methods have been proposed and applied for optimizing traffic signal phases and timings, such as genetic algorithm, Webster's method and its enhanced variants. Different signal optimization tools have also been developed and applied in practice, such as TRANSYT, VISSIM, CMEM, VISGAOST and JUNCTION. General reviews can be found exemplary in (Sood & Deepanshu, 2017; Yu, Ma, & Zhang, 2018).
Nowadays, traffic signal program data are difficult to obtain in practice and their qualities are, sometimes, questionable due to missing updates. Such insufficiency in data amount and quality affects the accuracy of microscopic traffic simulation, which requires data at a very fine level, such as lane allocations for different traffic movements, lengths of specific right- and left-turn lanes at intersections and traffic control mechanisms both at road sections and at intersections. This problem becomes much more serious when simulating a whole city area. During the simulation, unrealistic traffic collisions may happen at intersections where signal-timing plans are not available, since vehicles have the same right of way on all approaches at intersections. In order to avoid such collisions the microscopic traffic simulation package SUMO (Simulation of Urban Mobility) automatically generates traffic signal programs for intersections without signal timing plans when building a network. At the same time, the generation algorithm of signal programs also aims at delivering reasonable traffic signal programs, which comply with the reality, e.g. road priority and allowed traffic movements. Traffic demand at intersections is however not considered in the above mentioned generation algorithm, since it is often not available before traffic assignment or traffic counting is carried out. Therefore, the green times generated by SUMO may not be proper and traffic congestions may occur at some intersections when the corresponding traffic demand reaches a certain amount.
With regard to the increasing availability of detailed mobility data, the main idea of this paper is to improve the cycle length and the green time allocation of the pre-timed signal timings generated by SUMO with use of route information. Such data can be obtained from traffic counting, sensor data, simulation or other sources. With the improvement on traffic signal timings, the network efficiency can be increased accordingly.
In the following, the current generation algorithm of traffic signal programs will be firstly introduced in Section 2. After that, the proposed method to improve the green time allocation will be explained in Section 3. Section 4 will evaluate the performance of the proposed method with one single intersection in Brunswick, Germany and a signalized area in Berlin respectively. The conclusion and the perspectives are drawn in Section 5.
2
Current Generation Algorithm of Traffic Signal Programs in
SUMO
The automatic generation of traffic signal timings is executed when building a network with SUMO’s NETCONVERT or NETGENERATE. The resultant signal timings are stored in the respective network file. SUMO estimates pre-timed traffic signal plans according to the following rules:
Cycle length is fixed and equals to 90 seconds.
The number of phases depends on the number of conflicted movements.
Left-turn green phase is provided with 6 seconds when left-turning behavior is allowed. Yellow time phases always follow green time phases. With the safety concern, they are
No red phase will be set for intersections without vehicular conflicts, e.g. pedestrian crossings.
A green time phase will be set for each additional arm for intersections with more than four arms.
Green time phase for all traffic movements on each approach will be generated when the roads have the highest priority on a turning movement.
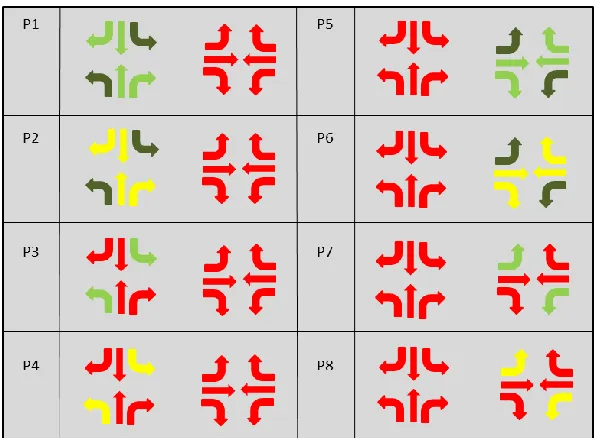
With these default settings, 8 phases will be generated for a conventional 4-arm intersection where there are two protected left-turn green phases, two permitted left-turn phases and four yellow/red phases (see Figure 1). In Phase 2 (P2) and Phase 6 (P6), the respective left-turns are permitted during the yellow time phases. Given a maximum travelling speed with 50 km/h the durations for green time and yellow time will be 31 sec and 4 sec accordingly. With such supplementary signal timings, traffic simulation can be executed with collisions due to right of way. All the above-mentioned rules can be modified by setting the respective options when generating a network with NETCONVERT or NETGENERATE. In addition, it is also possible to set intersections with actuated-based traffic control, i.e. either delay-based or gap-based, which is however not the focus in this paper. A detailed description about SUMO and the traffic light setting in SUMO can be found in (Krajzewicz, Erdmann, Behrisch, & Bieker, 2012; SUMO, 2018).
3
Proposed Approach
With the technology innovation, more and more detailed data can be collected through different devices. Information about traffic movements and routes can be available. The proposed approach is based on route information and the signal optimization method proposed by Webster (Webster, 1958).
*: light green: protected green time phase (major priority); dark green: permitted green time phase (minor priority)
The basic concept of Webster’s formula is to firstly optimize the cycle length by minimizing vehicle delay for a given intersection and then to allocate effective green times to the given green time phases accordingly.
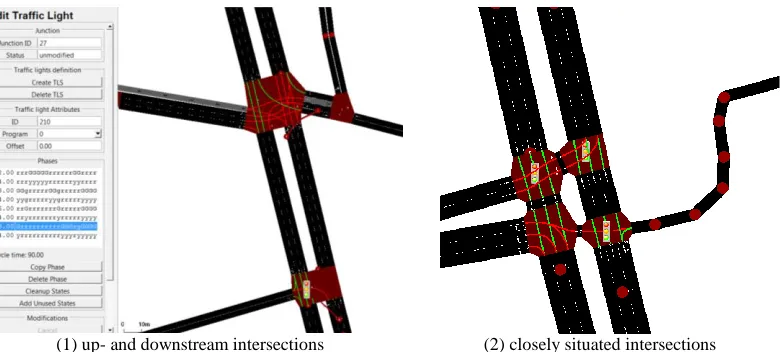
When developing the process of the traffic signal adaptation it is necessary to consider the interpretation format of the current traffic light programs in SUMO. Principally, each traffic light program in SUMO is referred by a certain intersection. However, a traffic light program can also be referred by more intersections, which share the same traffic signal (see the examples in Figure 2). Under such circumstance, all traffic movements at the related intersections are regulated in each signal phase in SUMO, i.e. either with g, G, y or r, where they mean minor green, major green, yellow and red respectively. An example is indicated in the table in Figure 2 (1). According to the phase information in SUMO, the critical flow ratio for each phase is calculated. As seen in Figure 2 (1) and (2), some traffic flows, indicated in green, are correlated when signal sharing exists. Such correlation should be eliminated before adapting cycle lengths and green splits. Otherwise, the approach with correlated flows will be overweighed and receive more green time.
With the above-mentioned consideration, the proposed traffic light adaption process is based on traffic light programs instead of intersections. A function to eliminate redundant flows is included in the process. Furthermore, the basic conditions, such as minimum green time, mini- and maximum cycle lengths, are considered to avoid unreasonable signal timings. In order to comply with the Webster’s formula, hourly traffic volumes are used in the flow calculation. With regard to different vehicle types, Passenger Car Equivalent (PCE) is used as unit for traffic volume where a truck, a bus, or a coach is equivalent to 3.5 passenger cars, a bicycle equals to 0.2 passenger car and a motorcycle equals to 0.5 passenger car. The proposed approach is implemented in Python and the corresponding process is illustrated in Figure 3.
In the first step of the process, the given route data and network data in SUMO format are read. The traffic movement flows (PCE) for each traffic signal program will then be calculated. In the next step, the redundant movement flows due to signal sharing will be removed for applying Webster’s formula. In order to identifying critical flow groups, the same directional flows with green light are summed up in each phase and defined as a flow group. In each phase, the flow group with the highest
(1) up- and downstream intersections (2) closely situated intersections
traffic flow ratio is the critical flow group. After that, the cycle length and green splits of each traffic signal program will be examined and, if necessary, optimized.
As default in the implemented script, cycle length for each traffic signal program will be optimized. The cycle length is calculated mainly with the consideration of the flow ratios of critical lane groups and the lost times. According to the equations (1), (2) and (3), the optimal cycle length can be determined.
𝐶𝑜𝑝𝑡= 1.5𝐿+5 1−∑𝑛𝑌𝑐
0 (1)
𝑌𝑐= ∑ (𝑛𝑖 𝑓𝑠)𝑐𝑖 (2)
𝐿 = ∑ (𝑡𝐿)𝑐𝑖𝑛
𝑖 (3)
no
using the existing cycle length? (defined by users)
yes Start
Read data - route file / network file
Calculate the optimal cycle length
Allocate effective green times Eliminate double traffic counting due
to signal sharing
End Generate the output file - Set the green times to the
minimum value - Recalculate the cycle length
green times < the minimum value?
Traffic light program i
the last traffic light program?
no, i= i+1
yes yes
no
Calculation of hourly PCE
the minimum value < cycle length > the maximum value?
Allocate effective green times - Set the cycle length to the mini-/
maximum values accordingly no
yes
, where 𝐶𝑜𝑝𝑡 : optimal cycle length (sec); 𝐿: total lost time (sec); (𝑡𝐿)𝑐𝑖: total lost time for critical lane group 𝑐𝑖; 𝑌𝑐: sum of the flow ratios for critical lane groups; (𝑓𝑠)𝑐𝑖: flow ratio for critical lane group 𝑐𝑖; 𝑛: number of critical lane groups. Once the optimal cycle length is determined, the effective green time 𝑔𝑒𝑓𝑓 for all phases can be computed, i.e. 𝑔𝑒𝑓𝑓= 𝐶𝑜𝑝𝑡− 𝐿. The effective green time for each phase (𝑔𝑖) is proportional to the flow ratio of the critical lane group 𝑐𝑖 and can be calculated with equation (4). Lane groups are decided according to the given signal plan phases. Given the same protected green time phase, traffic movements on the same approach are classified as a lane group. If some traffic movements have no protected time phases, they will be integrated into the lane groups, having the protected green time phase, on the same approach. For example, if there is a protected left-turn green phase and a protected green phase for through and right-left-turn traffic on a approach of an intersection, two lane groups will be formed on the respective approach. The one with the highest flow ratio, i.e. the ratio of flow to capacity, is the critical lane group on the respective approach. If users choose to remain the existing cycle length, only effective green times will be calculated and allocated.
𝑔𝑖= 𝑔𝑒𝑓𝑓× (( 𝑓 𝑠)𝑐𝑖
𝑌𝑐
⁄ ) (4)
When no route information is available at certain intersections, the respective signal plans will not optimized. If a critical flow ratio or the sum of the critical flow ratios is larger than one (over-saturated flow situation), the optimal cycle length will be set to the pre-defined maximum cycle length, i.e. 120 sec. The respective control parameters, such as vehicular headway, lost time per phase, minimum green time, yellow time, red time, mini- und maximum cycle length can be modified by setting the corresponding options.
4
Case Studies
Two cases studies are conducted for evaluating the performance of the proposed approach and illustrated bellow.
4.1
Single Signal Control
The investigated intersection is DLR's research intersection, located in the City Brunswick, Germany. This intersection is a part of the Application Platform for Intelligent Mobility (AIM) established by DLR. Different methods and equipment related to signal control, video monitoring and sensor systems (radar, mono and stereo cameras) are tested at this intersection for traffic situation analysis, traffic safety studies and better understanding of road users' behaviors.
Table 1 shows the simulated intersection performance with the current signal control mechanism. The average trip duration for vehicles is around 90 seconds. The average time spent standing and the average time lost due to driving slower than the desired speeds are around 38 and 50 seconds respectively. The departure delay due to the shortage of road space is 1.6 seconds. Regarding the pedestrians, their average trip duration is around 365 seconds and is 4 times more than what the vehicles have. The average lost time (96 seconds) is almost doubled when comparing with the vehicular lost time.
As mentioned before, signal phases are input data in the proposed approach. They play a decisive role in intersection performance when calculating the cycle length and green times with the Webster's formula. The number of the current signal phases is 44, which is apparently too many for a pre-timed signal control. Therefore, the signal phases and lane groups need to be redesigned before applying the proposed approach. The design principle is to set lane groups and signal phases as less as possible with the consideration of traffic movement flows. More lane groups results in more phases for avoiding movement conflicts. This will however increase start-up delay and the time for yellow phases. According to the traffic movement flows it is found that the hourly northbound left-turn traffic is quite high (319 PCE) and the amount of the hourly southbound through traffic is 382.5 PCE. The
Figure 4: Layout of the simulated single intersection
Type Indicator Avg time (sec)
Vehicle-based Duration 90.4
Waiting time 38.0
Time loss 50.3
Departure delay 1.6
Duration 364.7
Pedestrian-based Time loss 96.4
northbound left-turn vehicles may then have the difficulty to find a gap to cross the intersection. A protected left-turn phase for northbound traffic is therefore necessary. The amount of the left-turn traffic on the other approaches is low (less than 75 PCE). No exclusive left-turn phase is needed. Furthermore, the hourly pedestrian volumes on the four approaches are low (between 23 and 58). Thus, pedestrians and right-turn traffic will share the same green phases. With regard to pedestrians’ priority and safety, right-turn traffic will have minor priority on all approaches. The designed signal phases are illustrated in Figure 5.
Based on the designed signal phases the cycle length and green split is optimized with the proposed approach. The intersection performance is then evaluated with SUMO. According to Table 2, all performance indicators indicate that the intersection performances for both vehicles and pedestrians are improved with the proposed approach. The vehicular waiting time is significantly reduced with 52% improvement degree. Moreover, the average time loss is reduced by 40% for both vehicles and pedestrians. The average trip durations for vehicles and pedestrians are reduced by 22% and 11% respectively. In addition, the vehicle departure delay has also a reduction in 7%.
*: dash lines: pedestrian signal plans
**: dark green: permitted green time (minor priority); light green: protected green time (major priority)
Figure 5: Proposed signal phases at the studied intersection
Type Indicator Avg time (sec) Improvement rate (%)
Vehicle-based Duration 70.4 22
Waiting time 18.3 52
Time loss 30.3 40
Departure delay 1.5 7
Duration 325.9 11
Pedestrian-based Time loss 57.7 40
4.2
Area-wide Signal control
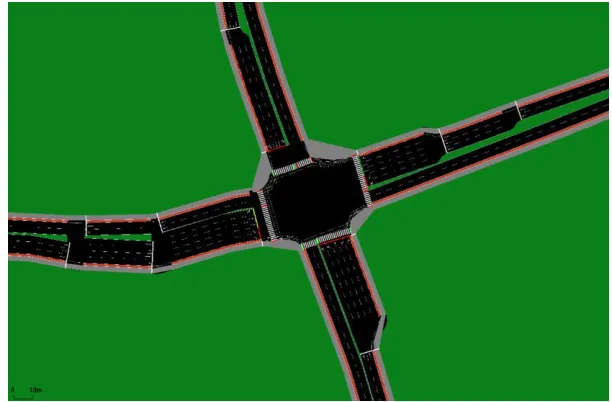
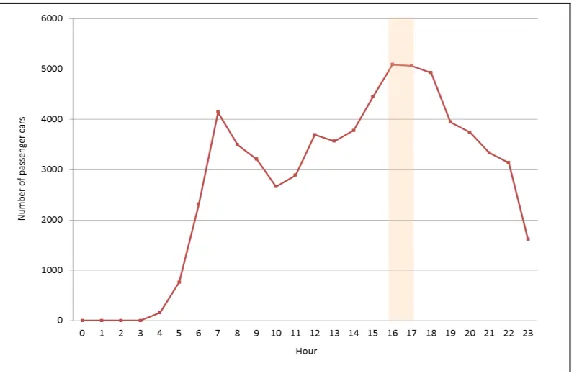
With the positive application result for a single intersection, the WISTA Science and Technology Park (WISTA area) in Berlin-Adlershof, Germany is used for further analysis. The simulation network is based on OpenStreetMap. There are 13 signalized intersections where three of them are for pedestrian crossing and two of them share the same signal program due to close adjacency. The network layout is shown in Figure 6. The used traffic demand is based on the result from the mobility behavior model (TAPAS) (Varschen & Wagner, 2006). With the limited data availability, only the traffic demand of passenger cars is considered here. According to the time series of traffic demand, shown in Figure 7, the peak period occurs in the evening from 16 to 18 o'clock. The highest hourly demand (5125 passenger cars) occurs from 17:30 to 18:30, which will be used for analysis.
Figure 6: Layout of the WISTA simulation network
Regarding the signal phasing design, the existing signal programs in the simulation network were developed according to SUMO’s automatic generation algorithm, described in Section 2. Following the same principle mentioned in Section 4.1 all signal programs are firstly examined and partially modified for ensuring that protected left turn phases will be set only when exclusive left turn lanes and high left-turn demand exist. Otherwise, permitted left turn phases will be adopted accordingly. After that, the proposed approach is applied to optimize the cycle length and the green time allocation for each traffic light program.
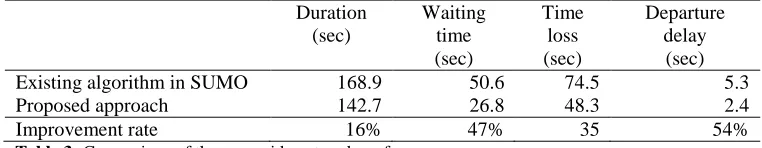
Table 3 shows the network performances with and without the use of the proposed approach. The result indicates that reduction occurs not only in travel duration, waiting time and time loss but also in departure delay when applying the proposed approach. It means that the overall network capacity is increased and more vehicles which should run within the given simulation period can be observed.
5
Conclusions and perspectives
The premise to obtain reasonable results from microscopic traffic simulation is good data availability and quality. It is however not easy to achieve, especially when simulating a whole city area, since such simulation technique requires data at a very fine level. One of the most often unavailable data are traffic signal timing plans which have the dominant influence on intersection capacity and network performance. Currently, SUMO provides an algorithm for automatically generating signal-timing plans for intersections where signal plans are not available. This algorithm mainly concerns if all allowed traffic movements are served and the respective safety for road crossing with a given cycle length with 90 seconds. In addition to permitted left turn phases, protected left turn phases are additionally set when the respective movements are allowed.
This paper proposes to improve the network performance by modifying the signal programs, generated by SUMO, with use of the basic Webster's formula and route information, which can be obtained from sensors, traffic counting, simulations or other sources. The cycle length and the green time allocation can then be optimized for each intersection with given basic conditions, such as minimum green time, min- and maximum cycle lengths and saturation headway. Upon users’ choice, it is also possible to only optimize green time allocation with a given cycle length. The influence of signal sharing on green time allocation is considered as well. The results of two case studies show that the proposed approach with redesigned signal phases has an apparent contribution on the improvement in traffic efficiency. These two case studies also implicate the importance of signal phase design. Improper signal phase design may result in unnecessary time loss due to time spent for yellow time phases and start-up. Furthermore, inappropriate lane allocation will also affect the capacity for each lane group. These two issues will be further addressed when extending the proposed approach. It is also planned to take exclusive narrow lanes for bicycles or motorcycles into consideration and, if necessary, extend the current applied Webster's formula. In addition, overlap
Duration (sec)
Waiting time (sec)
Time loss (sec)
Departure delay
(sec)
Existing algorithm in SUMO 168.9 50.6 74.5 5.3
Proposed approach 142.7 26.8 48.3 2.4
Improvement rate 16% 47% 35 54%
phasing, e.g. a lane group has protected green times in more than one phase, will be taken into account in the future as well.
References
Carlisle, D. (2010, April). graphicx: Enhanced support for graphics. Retrieved from http://www.ctan.org/tex-archive/ help/Catalogue/entries/graphicx.html
Kesur, K. B. (2014). Optimization of Mixed Cycle Length Traffic Signals. Journal of Advanced
Transportation, 48, pp. 431-442.
Krajzewicz, D., Erdmann, J., Behrisch, M., & Bieker, L. (2012, December). Recent Development and Applications of SUMO - Simulation of Urban MObility. International Journal On Advances
in Systems and Measurements, 5, pp. 128-138.
Rabia, A. Y. (2016). Estimating the Minimum Delay Optimal Cycle Length Based on a Time-Dependent Delay Formula. Alexandria Engineering Journal, 55, pp. 2509-2514.
Sood, S., & Deepanshu. (2017). Signal Optimization of a Road Network Using Software- A Review Paper. International Journal of Engineering Technology, Management and Applied Sciences, 5(6), pp. 437-440.
SUMO. (2018). SUMO: Simulation/Traffic Lights. Retrieved 02 14, 2018, from http://sumo.dlr.de/wiki/Simulation/Traffic_Lights
Tavares, C. V. (2014). Real-time Traffic Signal Settings at an Isolated Signal Control Intersection.
Transportation Research Procedia, 3, pp. 1021-1030.
Varschen, C., & Wagner, P. (2006). Mikroskopische Modellierung der Personenverkehrsnachfrage auf Basis von Zeitverwendungstagebüchern. Stadt Region Land - Heft 81 - Tagungsband
AMUS 2006, (pp. 63-69). Aachen, Germany.
Vilarinho, C., & Tavares, J. (2014). Real-time Traffic Signal Settings at an Isolated Signal Control Intersection. Transportation Research Procedia, 3, pp. 1021-1030.
Voronkov, A. (2004). EasyChair conference system. Retrieved from easychair.org
Voronkov, A. (2014). Keynote talk: EasyChair. In Proceeedings of the 29th ACM/IEEE International
Conference on Automated Software Engineering (pp. 3-4). ACM.
Voronkov, A., & Hoder, K. (n.d.). Templates. Retrieved from Templates for proceedings: https://easychair.org/proceedings/template.cgi?a=12732737
Webster, F. (1958). Traffic signal settings. In Road Research Technical Paper 39. London, England: Her Majestys Stationery Office.
Wikipedia. (n.d.). EasyChair. Retrieved from Wikipedia: https://en.wikipedia.org/wiki/EasyChair Yu, H., Ma, R., & Zhang, H. M. (2018, February 13). Optimal Traffic Signal Control under Dynamic
User Equilibrium and Link Constraints in a General Network. Transportation Research Part B, pp. 302-325.