www.ann-geophys.net/26/3669/2008/ © European Geosciences Union 2008
Annales
Geophysicae
Formation of current density profile in tilted current sheets
A. A. Petrukovich1, W. Baumjohann2, R. Nakamura2, and A. Runov2,* 1Space Research Institute, 84/32 Profsoyuznaya st., Moscow, 117997, Russia
2Space Research Institute, Austrian Academy of Sciences, Schmiedlstr. 6, 8042 Graz, Austria *now at: Institute of Geophysics and Planetary Physics, UCLA, Los Angeles, CA-90095, USA
Received: 2 April 2008 – Revised: 7 October 2008 – Accepted: 7 October 2008 – Published: 20 November 2008
Abstract. We investigate Cluster observations of strongly tilted sheets (flapping events) in the magnetotail. In accor-dance with the simple model of slip deformation (vertical differential displacement of neighboring flux tubes), theJy
current density component in the tilted sheet remains con-stant and equal to that in the horizontal undisturbed sheet. However, a substantialJzcomponent appears proportional to
the local sheet tilt. Slip-type variations, having smaller scale than the full crossing, locally change the tilt andJzand may
thus create a variety of non-classical (bifurcated, asymmetric etc) current density profiles.
Keywords. Magnetospheric physics (Magnetotail; Plasma sheet)
1 Introduction
In the magnetotail relatively fast (some hundreds of sec-onds) large-amplitude (tens of nT) variations ofBxare easily
noticeable and are usually attributed to flapping sheet mo-tions. They also provide a convenient instrument for current sheet investigations. The first four years of Cluster observa-tions revealed structural complexity of the plasma sheet (e.g. Sergeev et al., 2003, 2004; Runov et al., 2005a). In partic-ular, significantly inclined current sheets are abundant and alternating tilts are often observed within minutes, suggest-ing a meso-scale structure rather than large-scale flappsuggest-ing. The current sheet thickness during flappings was often from several hundreds to a few thousands km, even when an ex-panded sheet was nominally expected (e.g., associated with northward IMF and near-flank crossings with largeBz).
Besides current sheet tilts, Cluster can determine current density and, assuming some stationarity, its spatial profile along the normal. A variety of embedded, bifurcated and Correspondence to: A. A. Petrukovich
asymmetric sheet shapes were discovered, while the classical Harris profile was in a minority (Asano et al., 2005; Runov et al., 2006, 2003; Sergeev et al., 2003; Petrukovich et al., 2007).
Interpretation of such events may differ depending on the observed magnetic field geometry, the local plasma condi-tions, as well as the magnetospheric configuration. In sev-eral targeted investigations, some such events were inter-preted as a wavy displacement of the main cross-tail cur-rent sheet plane, propagating flankwards (Zhang et al., 2002), or as a quasi-stationary structure of vertically shifted flux tubes, flapping azimuthally around the spacecraft location (Petrukovich et al., 2003). Some observations of bifurcated sheets were associated with x-line geometry (Runov et al., 2003; Thompson et al., 2006).
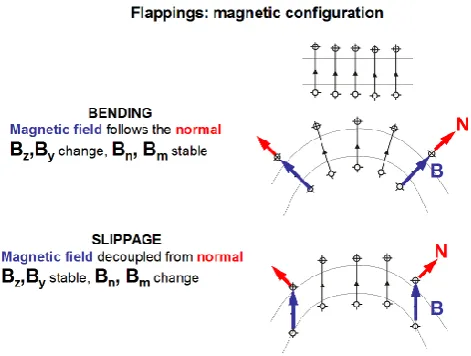
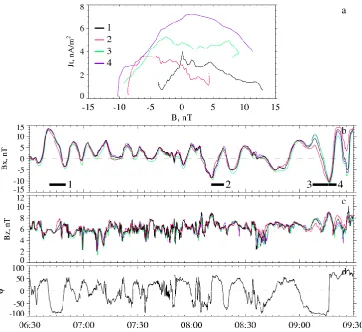
Petrukovich et al. (2006) considered the cross-tail cur-rent sheet formed by curved magnetic flux tubes as a three-dimensional object, in which two types of meso-scale formations may take place (Fig. 1). During a bend-type de-formation the flux tubes rotate and follow the sheet normal direction. Alternatively, during a slip-type deformation, the flux tubes shift vertically relative to their neighbors, but the magnetic field orientation remains the same, irrespective of the normal direction and the sheet tilt. Quiet-time strongly-tilted sheets, forming a significant subset of Cluster flapping events, were consistent with a slip-type displacement (see also Sharma et al., 2008). A good example is the 3 August 2004 event (Fig. 2, adapted after Petrukovich et al., 2006). Even rather small∼5 nT variations in the Bx curve (panel
b) have leading and trailing edges with different tilts (panel d). HoweverBz (panel c) is large and almost constant. By
is much smaller than Bz (not shown here, see Petrukovich
3670 A. A. Petrukovich et al.: Current sheet profiles
Fig. 1. Two variants of the cross-tail current sheet deformation, shown in a sunward view inY ZGSM plane, withBy=0. See text
for details. Modified from Petrukovich et al. (2006).
While Petrukovich et al. (2006) analyzed tilts and the mag-netic configuration of the sheets, in this investigation we fur-ther model current density profiles during slip-type deforma-tions, and compare them with observational data. We also describe relevant data processing approaches, since interpre-tation of current density profiles turns to be rather sensitive to proper selection of coordinate frames.
2 Techniques of current sheet description
Cluster magnetic data were used in our experimental analysis (Balogh et al., 2001). Hereafter componentsx, y, zare in the GSM frame of reference.l, m, nare in the proper frame of an idealized planar sheet: maximum variance direction, electric current direction, normal direction. The anglesφ, θ (of the normal direction) are in a polar coordinate system, withX
GSM as the polar axis. The polar angleθ (latitude) is mea-sured from theY Z plane, positive – Earthward (it will not be used in this investigation). The azimuthal angleφ(in the
Y Zplane) is measured from theZaxis (positive for normals with positiveYcomponent). In such a frame zero angles cor-respond to a horizontal sheet with the normal alongZGSM, while the azimuthal angle describes the most commonly ob-served tilts within theY Zplane (Sergeev et al., 2004).
In the magnetotail plasma sheet 4-point magnetic gradi-ents are usually interpreted in the approximation of a uni-form planar current sheet. In the idealized sheet the normal is equivalent to theBx gradient direction. However, if the
actual magnetic maximum variance direction is orthogonal toX, it might be necessary to use gradient of the maximum variance componentBl. Another method is to determine
nor-mals, analyzing inter-spacecraft time delays within the cross-ing (equivalent to computation of “time” gradient1t /1rat some fixed magnetic field value (Runov et al., 2005b)).
Gra-dients are assumed to be constant on the scale of spacecraft separation, otherwise errors in the normal determination will appear. In particular, if the current sheet thickness is compa-rable with the spacecraft separation, the computed gradients will be smaller than the real ones (Runov et al., 2005b).
Other sheet characteristics are the maximum variance di-rection, defining the main sheet magnetic componentBl, and
the electric current direction (computed as∇×B). For many flapping events the timing and magnetic gradient normals were coincident and orthogonal to the maximum variance and the current directions with an accuracy of about 10◦–20◦. Therefore the planar sheet approximation appears to be gen-erally acceptable. Since the angles between the experimen-tally determined normal, maximum variance and shear direc-tions are not exactly 90◦, a similar orthogonal proper frame
of reference is usually established. In our investigations the algorithm was:l– along maximal variance,m=n∗×l(n∗is magnetic or time normal),n=l×m. Note that, since the fi-nallmnsystem is established once for a single crossing, any variations overlaying the overall structure are averaged out. Magnetic gradient normal and electric current density vec-tors are available with the time resolution of magnetic field measurements.
Establishment of the proper frame of reference is a key step towards analysis of the sheet structure (in particular, identification of the Harris-type current density profile or any deviations from it). A single 4-point measurement is suffi-cient to determine the linear change (gradient vector) only. Still, some estimates can be done, involving extra physical arguments. For a given normal (gradient) direction, one can estimate the degree of non-linearity, e.g. comparing differ-ences in pairs of satellites. Asano et al. (2005) thus suggested that a majority of sheets are embedded, while Harris sheets are a clear minority.
When the current sheet moves past the spacecraft, a time sequence of measurementsB(t )andJ (t )can be converted to spatial profiles (Runov et al., 2005a). This method as-sumes stationarity (in particular, fixing a single lmn coor-dinate frame). Variations of current density along the nor-mal are then interpreted as a true profile of a sheet. Results are more confident in fortuitous occasions when the space-craft is moving back and forth several times across a cur-rent sheet, revealing the same structure relative to the local magnetic field (e.g. Runov et al., 2003; Sergeev et al., 2003; Petrukovich et al., 2007).
3 The model
We describe a slip-type deformation (see Sect. 1 for the definition) of a planar horizontal thick current sheet with the following simple model. The sheet mag-netic field originally depends only on the Z coordinate
B=Bx=Bl=B0tanh((z+z0)/Hz), By=0, Bz=const, the
Fig. 2. The event of 3 August 2004: (a) Current density profiles across the sheet. Magnetic fieldBx(b),Bz(c) in GSM frame of reference
and normal direction angle (d) relative toZ GSM (see Sect. 2 for details). C1,C2,C3,C4 spacecraft are denoted by standard colors – black,red,green,blue, respectively. Thick horizontal black lines in panel (b) denote the intervals of the profiles in (a). Modified from Petrukovich et al. (2006).
is characterized by its position y. Then the flux tubes are shifted vertically so thatz0=z0(y).
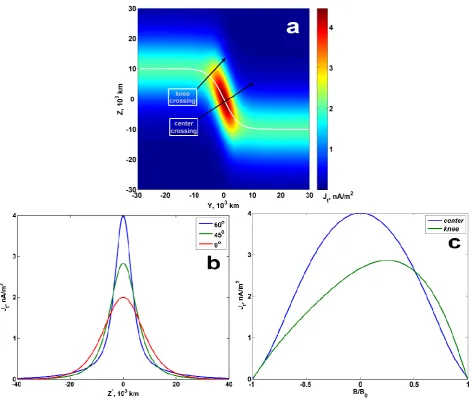
For a clearer understanding we start with a sin-gle step-like function with B0=25 nT, Hz=10 000 km,
z0=Aztanh(y/Hy),Hy=5780 km,Az=10 000 km (Fig. 3a).
The maximum tilt at the origin is tan(φmax)=Az/Hy
(60◦ in Fig. 3a). Then Jy=dB/dz=cosh−2((z+z0)/Hz),
Jz=dB/dy=cosh−2((z+z0)/Hz)(Az/Hy)cosh−2(y/Hy).
Jy remains constant and equal to its original Harris value in
each moving flux tube irrespective to the tilt, but an addi-tional non-HarrisJzappears. When crossed by a spacecraft
at the “center” of the step, such a configuration exhibits a higher and narrower total current density peak, than the initial horizontal (Harris) profile. Therefore a thin tilted sheet, embedded in the thicker original horizontal sheet, forms. Cases with larger tilts have larger Jt=
q J2
x+Jy2
(Fig. 3b). If a crossing is at the “knee” of the kink (Fig. 3a), the maximum of the current density does not coincide with the minimum of the magnetic field (Fig. 3c), and
asymmetric profiles appear (basically due to non-planarity of the configuration).
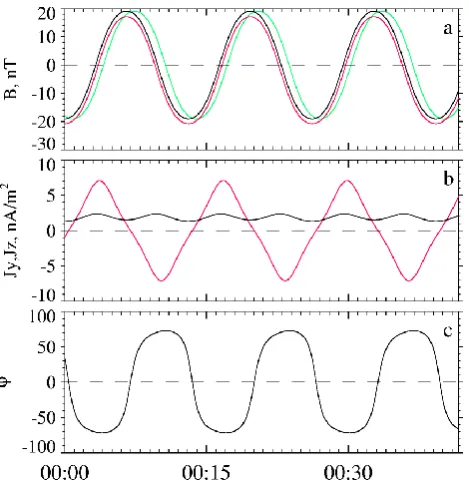
A more developed model is shown in Fig. 4. With three virtual spacecraft we observe a sheet with the wavy mod-ificationz0=Azcos(y/Hy). There is no dependence on X
and three spacecraft are enough for a gradient determination. One spacecraft is shifted from the base level by 1000 km inY
(green curve), another by 1000 km inZ (red curve). We se-lectB0=30 nT, Az=7500 km, Hz=10 000 km, Hy=2500 km,
and the maximum vertical velocity is 60 kms−1. The spatial sequence is converted to a temporal sequence, assuming that the structure propagates alongYwith a velocity of 20 kms−1, so that the period is of the order of 13 min. The length of this simulation interval is 50 000 km (45 min). The maxi-mum sheet tilt isφmax=arctan(Az/Hy)∼72◦. In agreement
with the previous example, Jz changes sign and oscillates
±6 nAm−2following the tilt, whileJy∼2 nAm−2is almost
3672 A. A. Petrukovich et al.: Current sheet profiles
Fig. 3. The model kinked current sheet (see text for details). (a) Total current density map and the neutral sheet plane (white curve). Two trajectories of a virtual spacecraft denote a “center crossing” and a “knee crossing”. (b) Total current density profiles relative to distance along the normal for a “center crossing” for different tilts of the sheet. (c) Nonsymmetric total current density profile relative to the local magnetic field during the “knee crossing” , compared with the “center crossing” for the 60◦tilt model.
In the last example (Fig. 5) we add a second harmonic with a scale shorter by the factor of 3.62 (which was se-lected almost arbitrarily to keep the two periods substantially different), a maximum vertical velocity of 10 kms−1and an amplitude of 340 km. The vertical amplitude of the main wave is reduced to 5000 km (maximum velocity 40 kms−1). This addition results in a more realistic irregularity of the instantaneous tilt (Fig. 5d). Current density profiles taken at four major crossings (or flapping events in observational terms) are visually rather different, with asymmetric and bi-furcated forms, because the second harmonic locally changes the tilt andJz. The maximum current differs by a factor of
1.5 (Fig. 5a). Therefore, while the “complete” major cross-ings are well defined, being determined by the larger-scale
wave, their inner structure varies substantially due to a lo-cal non-stationarity and inhomogeneity, caused by the sec-ond smaller-scale harmonic.
Finally we summarize the signatures of a model slip-type deformation in a thick Harris sheet: (1) theJy current
den-sity remains almost constant and equal to the nominal (Har-ris) value in the undisturbed sheet; (2) theJzcurrent density
varies substantially, following the tilt and may be substan-tially larger thanJy, the addition ofJzcreates a thin
intensi-fied embedded current sheet; (3) depending on the structure of the deformations (knees, multi-harmonic oscillations, etc) variations ofJzmay create complicated current density
Fig. 4. Model current sheet with one monochromatic wave. (a) Magnetic fieldBx. Colors denote three virtual satellites (see text
for positions). (b)Jy(black) andJz(red) current density. (c)φ, tilt
of the normal in the Y-Z plane. The time axis is in hh:mm format (arbitrary time).
4 Comparison with observations
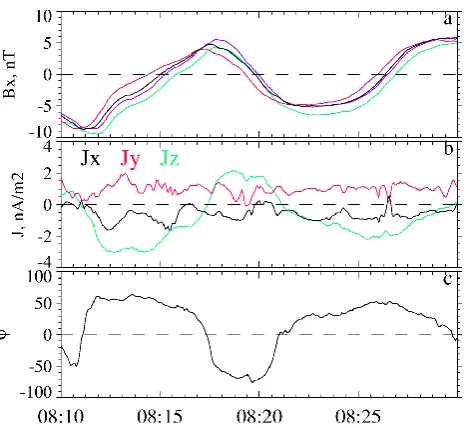
We use events from several published earlier investigations to perform comparisons with our models. Figure 6 contains three crossings from the event of 3 August 2004 in the format of Fig. 4. In accordance with the modelJyis about 1 nAm−2
andJzvaries through±2 nAm−2following the tilt. Smaller
negativeJx is likely a part (together withJy) of the
nomi-nal cross-tail current, flowing more azimuthally. Its sign is consistent with the Cluster spacecraft location in the morn-ing sector. Therefore the observed current density variations support the proposed slip deformation scheme.
The full set of individual crossings in the 3 August 2004 event have a wide range of tilt angles, and it is convenient to test theJz dependence on tilt in a more statistical way.
Jxy=
q J2
x+Jy2 andJz values were averaged over the
mid-dle of each crossing (Fig. 7). IndeedJxy is always stable
and rather small (∼1–2 nAm−2) in agreement with relatively thick background plasma sheet with largeBz. There is some
regular increase of Jxy towards positive tilts, probably
re-lated with small non-horizontality of the background sheet, not taken into account here. The sign and magnitude ofJz
depend on the tilt angle in agreement with the model. The current density profiles taken at four observed cross-ings with the larger magnetic field span (Fig. 2a) exhibit fac-tor of two changes of maximal total current density from case to case as well as asymmetric and bifurcated shapes
Fig. 5. Model current sheet with two monochromatic waves. (a) Current density profiles for three individual crossings. (b) Mag-netic fieldBx. Colors denote three virtual satellites (see text for
positions). (c)Jy(black) andJz(red) current density. (d)φ, tilt
of the normal in theY Zplane. The time axis is in hh:mm format (arbitrary time). Thick horizontal black lines in panel (b) denote the intervals of the profiles in (a).
with maxima at 5–10 nT. Similar shapes were reproduced also with our model (Fig. 5a). Especially noteworthy is con-sistency between the bifurcated profiles (#3 in both figures), which was achieved without any special tuning of the model parameters. Although there is no close correspondence be-tween Figs. 2a and 5a in all profiles, we used only two pe-riodic oscillations, and with a more tuned model one could obtain almost any required profile.
Since the 3 August 2004 event is just a case study, it is reasonable to check predicted differences between Jy and
Jz on a broader set of observations. Profiles of 16
non-horizontal sheets (with Ny>Nz) taken from the set
assem-bled by Runov et al. (2006) are averaged in Fig. 8. TheJz
[image:5.595.52.287.61.304.2]3674 A. A. Petrukovich et al.: Current sheet profiles
Fig. 6. Three crossings from the 3 August 2004 event in the format of Fig. 4. (a)Bxmagnetic field, (b) Components of current density,
(c)φ, tilt of the normal in the Y-Z plane.
Fig. 7.Jxy=
q
Jx2+Jy2andJzcurrent density components relative
to tilts for all individual crossings in Fig. 2.
is almost constant (close to Harris within the given range of relative magnetic field). Therefore this result also does not contradict our model. However, the difference between com-ponents is not so vivid, probably because not all crossings from this data set were individually identified with the slip-page deformation.
5 Discussion and conclusions
[image:6.595.311.545.61.245.2]The diversity of current sheet crossings observed by the Clus-ter spacecraft in the Earth’s magnetotail, suggests variety of
Fig. 8. Average current density profiles for 16 sheets from the Runov et al. (2006) dataset (see text for details).
physical driving mechanisms. We concentrate on a specific subset of flapping events: wavy crossings with alternating directions in the quiet plasma sheet with largeBz. The
previ-ously introduced by Petrukovich et al. (2006) slip deforma-tion scheme supposes that the observed thin tilted sheets ac-tually are the inner dynamic layer formed by relative (in the
Y coordinate) up-and-down motions of magnetic flux tubes (Fig. 1). This interpretation was mainly supported by the stability of theBzmagnetic field component in neighboring
crossings with almost opposite tilts. TheBycomponent
(af-ter extraction of the flaring contribution coupled with Bx)
remained small, so that flux tubes lie (almost) in a vertical plane in agreement with the proposed model geometry.
In this report we introduced a simple model of vertically moving flux tubes in an originally horizontal plasma sheet with a Harris profile. In the frame of this model tilting and thinning of the observed current sheet is strictly related to the appearance of aJzcurrent density component, whileJy
remains equal to its nominal Harris value. In the data exam-ples similar variability ofJz was detected. The small
rela-tively constantJx is most likely a part of the cross-tail
cur-rent and is not in contradiction with this scheme. We thus conclude that the proposed slippage model of plasma sheet deformation is consistent with the current density observed within crossings. Thus many fast flapping events, being visu-ally ideal objects for studying the current sheet, are actuvisu-ally dynamical deformations, rather than caused by fast coherent motion. Therefore some observed sheet profiles may be ir-relevant to the quiet sheet structure.
[image:6.595.50.288.332.523.2]of current density profiles is reduced to a proper selection of (irregular) slip deformations in each particular case. Since the required bulk plasma velocities are of the order of 10– 50 kms−1, the presence of such fluctuations in the plasma sheet is not improbable. A similar idea about origins of bifur-cated profiles was earlier suggested by Hoshino et al. (1996). Essentially a slip deformation (as well as any differential motion) is a violation of the sheet one-dimensionality and stationarity conditions, which are necessary for the interpre-tation of magnetic gradient measurements. In the case of a “nice-looking” flapping event with more or less coherent change ofBx, it seems reasonable to assume that the sheet
is stationary and one-dimensional at least locally, and indeed the proper frame of reference is usually well defined. How-ever, as is shown in our examples, even order of magnitude smaller and shorter-scale variations, visually preserving the integrity of a crossing, can substantially varyJz(and the
lo-cal tilt). Since each flapping event is characterized by a sin-gle (averaged or fitted) normal, all these smaller-scale cur-rent density variations will be understood as the extrema on the current density profile. Of course, beyond our simple model, similar sources may act onJy andJx, and an initial
non-Harris structure of the sheet (e.g. Zelenyi et al., 2006) may also contribute. Summarizing, the approximation of a single normal for the whole crossing may work quite well as a general characteristic, but may be not sufficient to interpret the cross-sheet current density profiles.
Unfortunately, unambiguous differentiation between tilt variations and profile variations (non-linearity) is impossible with four spacecraft and three-dimensional space. Therefore to interpret the observed profiles as signatures of the real cur-rent sheet structure one has to use extra arguments, e.g. sta-tistical analysis or placing limitations on the sheet tilt.
In conclusion, the slippage model of the formation of strongly tilted sheets in the magnetotail plasma sheet is fur-ther substantiated by comparison of the model and observed current density profiles. More measurement points than Cluster has now, are necessary to reliably distinguish be-tween non-linear current sheet profiles and variations of the geometry of the sheet or its non-stationarity. This goal may be achieved by proper planning of the spacecraft separation in the Cross-Scale mission.
Acknowledgements. The work was supported in part by the RFBR grant 06-05-90631. A. A. P. would like to acknowledge the aca-demic exchange program and hospitality of IWF.
Editor-in-Chief W. Kofman thanks S. Cowley and another anonymous referee for their help in evaluating this paper.
References
Asano, Y., Nakamura, R., Baumjohann, W., Runov, A., V¨or¨os, Z., Volwerk, M., Zhang, T. L., Balogh, A., Klecker, B., and R`eme, H.: How typical are atypical current sheets?, Geophys. Res. Lett, 32, L03108, doi:10.1029/2004GL021834, 2005.
Balogh, A., Carr, C. M., Acu˜na, M. H., et al.: The Cluster magnetic field investigation: overview of in-flight performance and initial results, Ann. Geophys., 19, 1207–1217, 2001,
http://www.ann-geophys.net/19/1207/2001/.
Hoshino, M., Nishida, A., Mukai, T., Saito, Y., Yamamoto, T., and Kokubun, S.: Structure of plasma sheet in magnetotail: Double-peaked electric current sheet, J. Geophys. Res., 101, 24 775– 24 786, 1996.
Lui, A. T. Y., Meng, C.-I., and Akasofu, S.-I.: Wavy nature of the magnetotail neutral sheet, Geophys. Res. Lett., 5, 279–282, 1978.
Petrukovich, A. A., Baumjohann, W., Nakamura, R., Balogh, A., Mukai, T., Glassmeier, K.-H., R`eme, H., and Klecker, B.: Plasma sheet structure during strongly northward IMF, J. Geophys. Res., 108, 1258, doi:10.1029/2002JA009738, 2003.
Petrukovich, A. A., Baumjohann, W., Nakamura, R., Runov, A., and Balogh, A.: Cluster vision of the magnetotail current sheet on a macro-scale, J. Geophys. Res., 110, A06204, doi:10.1029/2004JA010825, 2005.
Petrukovich, A. A., Zhang, T. L., Baumjohann, W., Nakamura, R., Runov, A., Balogh, A., and Carr, C.: Oscillatory magnetic flux tube slippage in the plasma sheet, Ann. Geophys., 24, 1695-1704, 2006,
http://www.ann-geophys.net/24/1695/2006/.
Petrukovich, A. A., Baumjohann, W., Nakamura, R., Runov, A., Balogh, A., and Reme, H.: Thinning and stretching of the plasma sheet, J. Geophys. Res., 112, A10213, doi:10.1029/2007JA012349, 2007.
Runov, A., Nakamura, R., Baumjohann, W., Zhang, T. L., Volw-erk, M., Eichelberger, H.-U., and Balogh, A.: Cluster observa-tion of a bifurcated current sheet, Geophys. Res. Lett., 30, 1036, doi:10.1029/2002GL016136, 2003.
Runov, A., Sergeev, V., Nakamura, R., Baumjohann, W., V¨or¨os, Z., Volwerk, M., Asano, Y., Klecker, B., R`eme, H., and Balogh, A., Properties of a bifurcated current sheet observed on 29 August 2001, Ann. Geophys., 22, 2535–2540, 2004,
http://www.ann-geophys.net/22/2535/2004/.
Runov, A., Sergeev, V.A., Baumjohann, W., Nakamura, R., Ap-atenkov, S., Asano, Y., Volwerk, M., V¨or¨os, Z., Zhang, T. L., Petrukovich, A., Balogh, A., Sauvaud, J.-A., Klecker, B., and R`eme, H.: Electric current and magnetic geometry in flap-ping magnetotail current sheets, Ann. Geophys., 23, 1391–1403, 2005a,
http://www.ann-geophys.net/23/1391/2005/.
Runov, A., Sergeev, V. A., Nakamura, R., Baumjohann, W., Zhang, T. L., Asano, Y., Volwerk, M., V¨or¨os, Z., Balogh, A., Sauvaud, J.-A., and R`eme, H.: Reconstruction of the magnetotail current sheet structure using multi-point Cluster measurements, Planetary Space Sci., 53, 237–243, 2005b.
Runov, A., Sergeev, V. A., Nakamura, R., Baumjohann, W., Ap-atenkov, S., Asano, Y., Takada, T., Volwerk, M., V¨or¨os, Z., Zhang, T. L., Sauvaud, J.-A., R`eme, H., and Balogh, A.: Local structure of the magnetotail current sheet:(2001 Cluster observa-tions, Ann. Geophys, 24, 247–262, 2006.
Sharma, A. S., Nakamura, R., Runov, A., et al: Transient and local-ized processes in the magnetotail: A review, Ann. Geophys., 26, 955–1006, 2008,
http://www.ann-geophys.net/26/955/2008/.
3676 A. A. Petrukovich et al.: Current sheet profiles
L., Volwerk, M., Balogh, A., R`eme, H., Sauvaud, J.-A., An-dre, M., and Klecker, B.: Current sheet flapping motion and structure observed by Cluster, Geophys. Res. Lett., 30, 1327, doi:10.1029/2002GL016500, 2003.
Sergeev, V., Runov, A., Baumjohann, W., Nakamura, R., Zhang, T. L., Balogh, A., Louarn, P., Sauvaud, J.-A., and R`eme, H.: Ori-entation and propagation of current sheet oscillations, Geophys. Res. Lett., 31, L05807, doi:10.1029/2003GL019346, 2004. Thompson, S. M., Kivelson, M. G., El-Alaoui, M., Balogh, A.,
R`eme, H., and Kistler, L. M.: Bifurcated current sheets: Statis-tics from Cluster magnetometer measurements, J. Geophys. Res., 111, A03212, doi:10.1029/2005JA011009, 2006.
Zelenyi, L. M., Malova, H. V., Popov, V. Y., Delcourt, D. C., Ganushkina, N. Y., and Sharma, A. S.: “Matreshka” model of multilayered current sheet, Geophys. Res. Lett., 33, L05105, doi:10.1029/2005GL025117, 2006.