InTrans Project Reports Institute for Transportation
2-2015
A Smartphone-Based Prototype System for
Incident/Work Zone Management Driven by
Crowd-Sourced Data
Yue Liu
University of Wisconsin - Milwaukee, [email protected]
Yi Hu
University of Wisconsin - Milwaukee, [email protected]
Xin Li
University of Wisconsin - Milwaukee, [email protected]
Follow this and additional works at:http://lib.dr.iastate.edu/intrans_reports Part of theCivil Engineering Commons
This Report is brought to you for free and open access by the Institute for Transportation at Iowa State University Digital Repository. It has been accepted for inclusion in InTrans Project Reports by an authorized administrator of Iowa State University Digital Repository. For more information, please [email protected].
Recommended Citation
Liu, Yue; Hu, Yi; and Li, Xin, "A Smartphone-Based Prototype System for Incident/Work Zone Management Driven by Crowd-Sourced Data" (2015).InTrans Project Reports. 111.
A Smartphone-Based Prototype System for Incident/Work Zone
Management Driven by Crowd-Sourced Data
Abstract
This project develops a smartphone-based prototype system that supplements the 511 system to improve its dynamic traffic routing service to state highway users under non-recurrent congestion. This system will save considerable time to provide crucial traffic information and en-route assistance to travelers for them to avoid being trapped in traffic congestion due to accidents, work zones, hazards, or special events. It also creates a feedback loop between travelers and responsible agencies that enable the state to effectively collect, fuse, and analyze crowd-sourced data for next-gen transportation planning and management. This project can result in substantial economic savings (e.g. less traffic congestion, reduced fuel wastage and emissions) and safety benefits for the freight industry and society due to better dissemination of real-time traffic information by highway users. Such benefits will increase significantly in future with the expected increase in freight traffic on the network. The proposed system also has the flexibility to be integrated with various transportation
management modules to assist state agencies to improve transportation services and daily operations.
Keywords
Applications, Field tests, Real time information, Smartphones, Traffic data, Traveler information and communication systems, Work zone safety, Work zone traffic control, incident management, smartphone, traveler information, work zone
Disciplines
Civil Engineering
Comments
A Smartphone-Based Prototype
System for Incident/Work Zone
Management Driven by
Crowd-Sourced Data
Final Report
February 2015
About SWZDI
Iowa, Kansas, Missouri, and Nebraska created the Midwest States Smart Work Zone Deployment Initiative (SWZDI) in 1999 and Wisconsin joined in 2001. Through this pooled-fund study, researchers investigate better ways of controlling traffic through work zones. Their goal is to improve the safety and efficiency of traffic operations and highway work.
ISU Non-Discrimination Statement
Iowa State University does not discriminate on the basis of race, color, age, ethnicity, religion, national origin, pregnancy, sexual orientation, gender identity, genetic information, sex, marital status, disability, or status as a U.S. veteran. Inquiries regarding non-discrimination policies may be directed to Office of Equal Opportunity, Title IX/ADA Coordinator, and Affirmative Action Officer, 3350 Beardshear Hall, Ames, Iowa 50011, 515-294-7612, email [email protected].
Notice
The contents of this report reflect the views of the authors, who are responsible for the facts and the accuracy of the information presented herein. The opinions, findings and conclusions expressed in this publication are those of the authors and not necessarily those of the sponsors.
This document is disseminated under the sponsorship of the U.S. DOT in the interest of
information exchange. The sponsors assume no liability for the contents or use of the information contained in this document. This report does not constitute a standard, specification, or
regulation.
The sponsors do not endorse products or manufacturers. Trademarks or manufacturers’ names appear in this report only because they are considered essential to the objective of the document.
Quality Assurance Statement
The Federal Highway Administration (FHWA) provides high-quality information to serve Government, industry, and the public in a manner that promotes public understanding. Standards and policies are used to ensure and maximize the quality, objectivity, utility, and integrity of its information. The FHWA periodically reviews quality issues and adjusts its programs and processes to ensure continuous quality improvement.
Iowa DOT Statements
Federal and state laws prohibit employment and/or public accommodation discrimination on the basis of age, color, creed, disability, gender identity, national origin, pregnancy, race, religion, sex, sexual orientation or veteran’s status. If you believe you have been discriminated against, please contact the Iowa Civil Rights Commission at 800-457-4416 or the Iowa Department of Transportation affirmative action officer. If you need accommodations because of a disability to access the Iowa Department of Transportation’s services, contact the agency’s affirmative action officer at 800-262-0003.
The preparation of this report was financed in part through funds provided by the Iowa Department of Transportation through its “Second Revised Agreement for the Management of Research Conducted by Iowa State University for the Iowa Department of Transportation” and its amendments.
Technical Report Documentation Page
1. Report No. 2. Government Accession No. 3. Recipient’s Catalog No.
InTrans Project 06-277 No. CFDA 20.701
4. Title 5. Report Date
A Smartphone-Based Prototype System for Incident/Work Zone Management Driven by Crowd-Sourced Data
February 2015
6. Performing Organization Code
7. Author(s) 8. Performing Organization Report No.
Yue Liu, Xin Li, and Yi Hu InTrans Project 06-277
9. Performing Organization Name and Address 10. Work Unit No. (TRAIS)
University of Wisconsin-Milwaukee 3200 N Cramer St.
Milwaukee, WI 53211
11. Contract or Grant No.
# RT15100
12. Sponsoring Organization Name and Address 13. Type of Report and Period Covered
Midwest Smart Work Zone Deployment Initiative
Iowa Department of Transportation 800 Lincoln Way
Ames, Iowa 50010
Federal Highway Administration U.S. Department of Transportation 1200 New Jersey Avenue SE Washington, DC 20590
Final Report (06/17/2013-12/31/2014)
14. Sponsoring Agency Code
TPF-5(081)
15. Supplementary Notes
Visit www.intrans.iastate.edu/smartwz/ for color pdfs of this and other Midwest Smart Work Zone Deployment Initiative research reports.
16. Abstract
This project develops a smartphone-based prototype system that supplements the 511 system to improve its dynamic traffic routing service to state highway users under non-recurrent congestion. This system will save considerable time to provide crucial traffic information and en-route assistance to travelers for them to avoid being trapped in traffic congestion due to accidents, work zones, hazards, or special events. It also creates a feedback loop between travelers and responsible agencies that enable the state to effectively collect, fuse, and analyze crowd-sourced data for next-gen transportation planning and management. This project can result in substantial economic savings (e.g. less traffic congestion, reduced fuel wastage and emissions) and safety benefits for the freight industry and society due to better dissemination of real-time traffic information by highway users. Such benefits will increase significantly in future with the expected increase in freight traffic on the network. The proposed system also has the flexibility to be integrated with various transportation management modules to assist state agencies to improve
transportation services and daily operations.
17. Key Words 18. Distribution Statement
incident management—smartphone—traveler information—work zone No restrictions.
19. Security Classification (of this report)
20. Security Classification (of this page)
21. No. of Pages 22. Price
Unclassified. Unclassified. 135 NA
A
S
MARTPHONE
-B
ASED
P
ROTOTYPE
S
YSTEM
FOR
I
NCIDENT
/W
ORK
Z
ONE
M
ANAGEMENT
D
RIVEN BY
C
ROWD
-S
OURCED
D
ATA
Final Report February 2015
Principal Investigator Yue Liu, Associate Professor University of Wisconsin at Milwaukee
Co-Principal Investigator Yi Hu, Assistant Professor University of Wisconsin at Milwaukee
Research Assistant Xin Li
Authors
Yue Liu, Xin Li, and Yi Hu University of Wisconsin at Milwaukee
Sponsored by the Midwest Smart Work Zone Deployment Initiative and
Federal Highway Administration (FHWA) Pooled Fund Study TPF-5(081):
Iowa (lead state), Kansas, Missouri, Nebraska, Wisconsin
Preparation of this report was financed in part
through funds provided by the Iowa Department of Transportation through its Research Management Agreement
TABLE OF CONTENTS
ACKNOWLEDGMENTS ... ix
EXECUTIVE SUMMARY ... xi
CHAPTER 1: INTRODUCTION ...1
1.1 Research Background ...1
1.2 Research Objectives ...3
1.3 Report Organization ...4
CHAPTER 2: LITERATURE REVIEW ...5
2.1 Smartphone-Based Traveler Information Systems ...5
2.2 The 511 Systems ...6
2.3 Crowd-Source Data ...7
CHAPTER 3: SYSTEM DATA FEEDS ...9
3.1 Parsing the “511.xml” File ...10
3.2 Parsing the “511LCS.xml”...15
CHAPTER 4: ALTERNATIVE ROUTE DECISION MODEL ...18
4.1 Data Collection and Extraction ...18
4.2 Division of Freeway Segments ...22
4.3 Experimental Design ...33
4.4 Model Development and Validation ...40
CHAPTER 5: SYSTEM DEVELOPMENT ...58
5.1 XML-doc Retrieving Module ...58
5.2 The SQL Database ...64
5.3 The Web Service Module ...68
5.4 The Android App ...69
5.5 The App Showcase ...72
CHAPTER 6: FIELD TESTS AND BENEFIT ANALYSES ...76
6.1 Scenario Selection ...76
6.2 Field Tests ...78
6.3 System Benefit Analysis ...81
CHAPTER 7: CONCLUSIONS ...85
REFERENCES ...87
APPENDIX A: SOURCE CODES OF THE APP ...89
A.1 Code-511File Reader ...89
A.2 Route Service ...92
LIST OF FIGURES
Figure 1.1. Resources for travelers to obtain traffic information during I94 East-West corridor
construction ...2
Figure 1.2. Missing feedback loop from travelers to public agencies ...3
Figure 2.1. Wisconsin 511 ...7
Figure 3.1. The proposed system framework...9
Figure 4.1. Retriever tool ...19
Figure 4.2. InterCAD Data Retrieval Facility ...20
Figure 4.3. A screenshot of the databases combined into one spreadsheet ...21
Figure 4.4. Segment 1 ...22
Figure 4.5. Segment 2 ...23
Figure 4.6. Segment 3 ...23
Figure 4.7. Segment 4 ...24
Figure 4.8. Segment 5 ...24
Figure 4.9. Segment 6 ...25
Figure 4.10. Segment 7 ...25
Figure 4.11. Segment 8 ...26
Figure 4.12. Segment 9 ...26
Figure 4.13. Segment 10 ...27
Figure 4.14. Segment 11 ...28
Figure 4.15. Segment 12 ...28
Figure 4.16. Segments 13 and 14 ...29
Figure 4.17. Segment 15A ...30
Figure 4.18. Segment 15B ...30
Figure 4.19. Segment 16 ...31
Figure 4.20. Segment 17 ...32
Figure 4.21. Segment 18 ...32
Figure 4.22. Conceptual experimental design and key contributing factors...33
Figure 4.23. An example freeway corridor segment in the simulation test bed ...34
Figure 4.24. A close-in view of an interchange ...35
Figure 4.25. A typical intersection layout ...36
Figure 4.26. Demonstration of using Distance Measure tool ...37
Figure 4.27. A screen shot of Street View ...38
Figure 4.28. Connection of detour optimization model and CORSIM ...41
Figure 4.29. Macroscopic network flow modeling in the integrated diversion control model ...42
Figure 4.30. The procedure to determine the alternative route decision ...49
Figure 5.1. Database construction ...67
Figure 5.2. Data sample in table ...67
Figure 5.3. The Internet web service ...68
Figure 5.4. The connection protocol ...68
Figure 5.5. Snapshot of the App interface ...70
Figure 5.6. Layout of Main View ...71
Figure 5.7. The App developed using the Android platform ...73
Figure 5.8. The route planner in the developed App ...73
Figure 5.10. Warning messages of incident events customized to the selected route ...74
Figure 5.11. Alternative route guidance ...75
Figure 6.1. Selected scenarios for field tests and benefit analyses ...77
Figure 6.2. Scenario I ...78
Figure 6.3. Scenario II ...79
Figure 6.4. Scenario III ...80
Figure 6.5. Scenario IV ...81
LIST OF TABLES Table 4.1. Key variables and range of values for the experimental design ...39
Table 4.2. Estimation results for linear regression model ...48
Table 4.3. Calibrated logistic decision-model with the minimum threshold of 5% ...52
Table 4.4. The overall prediction accuracy of each tree ...53
Table 4.5. Calibrated logistic decision-model ...54
Table 4.6. Re-calibrated logistic decision models with excluded interaction terms ...56
Table 6.1. Alternative route decision for the selected scenarios ...78
Table 6.2. Descriptions of scenarios for benefit analysis illustrations ...83
ACKNOWLEDGMENTS
This research was conducted under the Midwest Smart Work Zone Deployment Initiative (SWZDI) and Federal Highway Administration (FHWA) Pooled Fund Study TPF-5(295), involving the following state departments of transportation:
Iowa (lead state)
Kansas
Missouri
Nebraska
Wisconsin
EXECUTIVE SUMMARY
CHAPTER 1: INTRODUCTION
1.1 Research Background
Highway infrastructure and related transportation elements comprise a crucial lifeline for the United States, as the operations of such systems affect our nation’s economic vitality and
citizens’ way of life. Better information can influence transportation decisions and route choices of travelers in some very clear ways and result in more efficient utilization of highway
infrastructure capacity. For example, with better ways to learn how work zones and other incidents affect travel times, commuters can start for work and return home at times more responsive to actual traffic patterns than a fixed schedule. As the effects of congestion become clearer to people, they are more able to consider alternate paths to their destination.
Reduced capacity caused by work zones coupled with overwhelming traffic demand has resulted in significant traffic congestion in the highway system. In such conditions, if proper traffic re-routing strategies could be implemented in time, motorists could circumvent the congested segments by detouring through alternative routes, resulting in significant economic savings by reducing delays, fuel consumption, and vehicle emissions, and by increasing traffic safety
Traveler information has exploded over the past decade with the development and use of advanced technologies able to detect, analyze, and disseminate traffic conditions. The 511, a decision support system that enables the traveling public to make informed decisions and manage their trip details, automates the integration of law enforcement incident data, freeway traffic conditions, roadway construction and detour information, and multimodal bus, rail, and airport conditions. It is capable of providing accurate information to the traveling public, and allows transportation system providers and emergency responders to manage the transportation infrastructure in real time.
The 511 regular/mobile websites and phone service, as the major sources for travelers to access most of the popular 511 services, have not been fully utilized by most of state highway travelers to get real-time detour information when they are experiencing work zone constructions on their way. A very recent study by University of Wisconsin-Milwaukee on travelers’ opinions of the I-94 East-West corridor repaving project indicates that although 84% of the 1,556 surveyed drivers have a computer available to get traffic information, most of them are still getting their traffic information from a local radio station (73%) and local television station (66%). Other forms of technology, like 511, are far behind (see Figure 1). Most motorists don't have the numbers on their cell phone's speed dial. As one of the survey respondents noted, "I don't have the time to search on-line or call the number to check traffic congestion ahead in my trip."
Figure 1.1. Resources for travelers to obtain traffic information during I94 East-West corridor construction
With hundreds of millions of automobiles and over a billion mobile phone-equipped people in the world, cars and humans may turn out to be the carriers of the world’s largest and most
dynamic sensor networks in the coming years. Such mobile sensor networks have the potential to sense large expanses of the world at much finer fidelity and scale than possibly by static
deployments (roadside sensors, cameras, and message signs).
According to recent survey data, 85% of Americans own an Internet-enabled handheld device, and most adults (as high as 93%), ages 18 to 64 years, commonly access the Internet on mobile devices. These survey data indicate that mobile-Internet access is becoming more important in people’s daily lives compared to the traditional media (e.g. TV, radio stations, and PC-based web application). The recent survey of I-94 travelers also shows that drivers are showing new trends with more drivers owning smart cell phones than regular cell phones, which can create
opportunities of creating smartphone-based tools to supplement and improve the real-time traffic detouring service of 511 system during work zone construction.
Smartphones usually have a full-functional operating system (Android, Apple iOS, Windows Mobile, etc.), and can be thought as a portable computer with regular phone capabilities. With a functional operating system and programming platforms, developers are able to create
Smartphone applications for different purposes including entertainment, work, travels, etc. The use of mobile phone applications for a variety of purposes has helped turn Smartphone’s into a vital piece of technology at home and in the workplace. The design of a Smartphone application can simplify and complete the same tasks as a typical computer. Most Smartphone applications offer simple interfaces to make it easy for consumers to use and get their information quickly and conveniently.
Detailed and up-to-the-minute information is changing when, where, and how we travel. At the same time, traffic management are experiencing revolution and becoming more data driven. Data
0 10 20 30 40 50 60 70 80
%
of
D
river
analysis on newly fused datasets is enhancing our understanding of how to improve
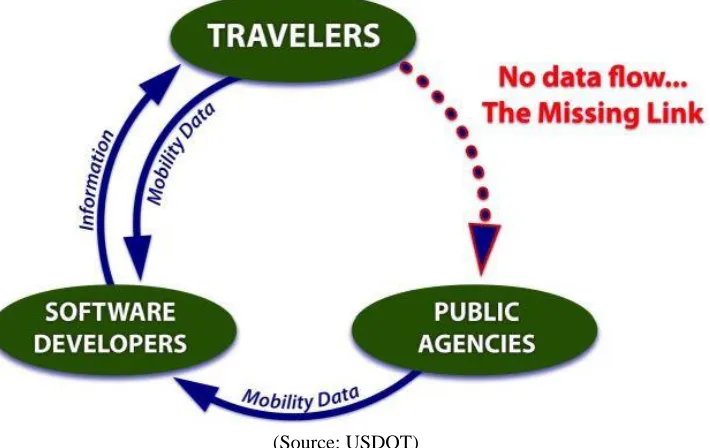
transportation services. The surge of the number of smartphone users brings both opportunities and challenges for public agencies to use mobile sensing for next-gen work zone planning and traffic management. For example, mobile sensing data can be easily collected and mined to analyze traveler diversion behaviors and origin-destination changes due to a major highway construction project. Compared with the traditional survey method of sending questionnaires, it collects much more number of samples at much lower lost and with much better accuracy. According to statistics by USDOT, a small population of users (2,200) can produce high fidelity information in a major metropolitan area. Two-thirds of the smartphone users trust their privacy is protected for traffic management purposes, and high proportion of them (88%) indicates repeated use in the future.
[image:19.612.133.488.248.472.2](Source: USDOT)
Figure 1.2. Missing feedback loop from travelers to public agencies
In this light, software vendors have started to develop mobile applications and use mobility data from travelers to provide traffic information, which has comprised key components of the transportation mobility data ecosystem illustrated in Figure 2. Notable examples include Waze, Roadify, Beat the Traffic, and etc. However, in such a system, the public agencies have not played an important role as they are supposed to due to the missing data flow from travelers to agencies. How to create the feedback loop to apply crowd-sourced data in next-gen traffic management has become a major challenge to many public agencies.
1.2 Research Objectives
investment in the current 511 system; the maintenance and further improvements of the Smartphone application could be done through software upgrades, which would make the application reusable for future developments. Finally, the application would provide a critical piece of the long-term push toward enabling the advanced data communication capabilities of the 511 system.
1.3 Report Organization
Based on the research objectives, this study has organized all primary system development work and results into six subsequent chapters. A brief description of the information contained in each chapter is presented next.
Chapter 2 performs a comprehensive review of available literature associated with mobile
traveler information provision. Chapter 3 mainly presents the description and processing of the
system data feeds. Chapter 4 develops the alternative route decision model based on a
well-calibrated corridor simulation network and a comprehensive set of experimental scenarios according to the key factors that may affect the system’s decision whether or not to implement
alternative recommendation. Chapter 5 reports the development process of the system and the
App. Chapter 6 presents the field test results of the system and benefit analysis results. Chapter 7
CHAPTER 2: LITERATURE REVIEW
2.1 Smartphone-Based Traveler Information Systems
Campolo et al. (2012) designed a smartphone-based platform to exploit low-cost dedicated hardware that interacts with sensors on board and in the vehicle surroundings. In their study, a prototype is also developed to assess the technological feasibility of their conceived platform. Similarly, Briante et al. (2014) proposed SmartCar (Smartphone-based floating car data collection) platform as an intelligent use of smartphones to collect “augmented” FCD from in-vehicle telematics and external sensors (e.g., pollution detectors for urban sensing), and (ii) the adoption of an offloading strategy that leverages Wi-Fi hotspots to alleviate the burden on the cellular network due to the massive generation of “augmented” data.
Abdulazim et al. (2013) presented a data collection framework and its prototype application for personal activity–travel surveys through the use of smartphone sensors. The core components of the framework run on smartphones backed by cloud-based (online) services for data storage, information dissemination, and decision support. The framework employs machine-learning techniques to infer automatically activity types and travel modes with minimum interruption for the respondents. In 2014 TRB meeting, Wang et al. discussed the potential of mobile phone positioning data as an alternative data source for travel behavior studies. The study is particularly interested in its potential for analyses in travel behavior dynamics. The authors discussed the relative advantages of mobile positioning over travel diary/GPS tracking as an alternative data collection technique. Eventually, they concluded that mobile phone positioning data is a promising data source for travel behavior study.
Aleyadeh et al. (2012) presented a framework developed for both Android and iOS platforms, to enable fine grained sensing and monitoring of road conditions in a ubiquitous fashion. The study employed crowd sensing approaches that are fine-tuned with back-end data analytics, to
empower both active and passive sensing schemes. The application, named Smartphone-based Road Monitoring (SRoM), has been tested in real-life scenarios and its accuracy and fidelity have been validated in physical implementations. Current implementations are being
communicated with the Ministry of Transportation in Canada for testing on their fleets. Nawaz et al. (2013) developed a smartphone based sensing system, ParkSense, which detects if a driver has vacated a parking spot.
Manolopoulos et al. (2012) has successfully implemented a Smartphone-based Traffic
2.2 The 511 Systems
On March 8, 1999, the U.S. Department of Transportation (USDOT) petitioned the Federal Communications Commission (FCC) to designate a nationwide three-digit telephone number for travel information. On July 21, 2000 the Federal Communications Commission (FCC)
designated 511 as the single travel information telephone number to be made available to states & local jurisdictions across the country. The FCC ruling leaves nearly all implementation issues & schedules to state & local agencies & telecommunications carriers.
Mindful of both the opportunity & challenge 511 presents, the American Association of State Highway & Transportation Officials (AASHTO), in conjunction with many other organizations including the American Public Transportation Association (APTA) and the Intelligent
Transportation Society of America (ITS America), with support from the U.S. Department of Transportation, established the 511 Deployment Coalition. The goal of the 511 Deployment Coalition is "the timely establishment of a national 511 traveler information service that is sustainable and provides value to users."
After considering a full range of consumer, business, technical and policy issues associated
with 511, the Coalition established a national vision for 511 which states that:
“511 will be a customer-driven, multi-modal travel information service, available across the United States, accessed via telephones, and other personal communications devices, realized through locally deployed interoperable systems, enabling a safer, more reliable and efficient transportation system.”
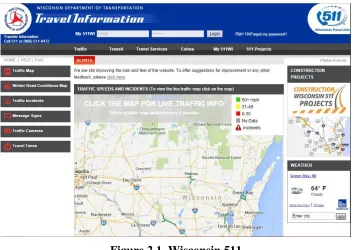
Wisconsin 511 has been initialized to offer a wide variety of traffic and transit information for traffic participants. The users are expected to collect or query information link with traffic map, winter road condition map, traffic incidents, road closures, transit map and etc. It aims to build a decision support system that enables the traveling public to make informed decisions and
Figure 2.1. Wisconsin 511
2.3 Crowd-Source Data
As its conception explained by Misra (2014), crowdsourcing is an example in which an organizer or an organization is able to use the network of collaborators to solve a problem that would otherwise be cost- or labor-intensive, or in which within a defined organization the expertise is unavailable or insufficient.
So far, crowdsourcing is particularly available and successfully applied into transportation domain because it voluntarily functions in bringing together a large group of people on the same platform to address common issues that affect its members. Crowdsourcing is widely founded to work successfully for local purposes through localized knowledge and acquired experiences because people in a region tend to identify themselves with the region where they live, work, and socialize, and are generally more interested in the systems that affect them.
CHAPTER 3: SYSTEM DATA FEEDS
[image:25.612.83.528.141.522.2]The proposed system framework
Figure 3.1. The proposed system framework
The project builds a linkage between our proposed smart-phone based prototype system and the Wisconsin 511 system via real-time streaming live traffic information from the 511.xml and 511CS.xml data feeds files. This research seeks to develop a smartphone-based prototype system that supplements the Wisconsin 511 system to improve its real-time traffic routing service to state highway users under non-recurrent traffic congestion. Figure 4 shows the proposed system operational framework that uses mobile-internet to manage the communication between a smartphone app and a web server hosting the database and traffic routing models.
are used). Most importantly, in addition to displaying the information on the map, the app will “read” the user-specific information to motorists with a synthesized voice to minimize motorist distraction while driving.
This chapter will detail the explanation of parsing and extracting data from the 511.xml and 511CS.xml data files.
3.1 Parsing the “511.xml” File
511.xml consists of four sub-parts, namely, “linkeData”, “fullEventUpdate”, “routeData”, and “dMSDeviceStatus”, respectively. Each part functions in storing corresponding information.
3.1.1 “linkData” Module
The “linkdata” module includes the following data records:
• network-id: Values indicate organization that link IDs belong to.
o STOC-MILWAUKEE
o STOC-MADISON
o STN (State Trunk Highway)
• organization-id: set to WisDOT • organization-name: set to WisDOT
• center-id: Milwaukee or Madison, whichever center contributed the data • link-id: an unique numerical designation for the Link within the network. • link-data-stored:
o 1 – link volume
o 2 – current occupancy
o 3 – current average speed
o 4 – current delay time
o 5 – roadway status
o 6 – daily peak volume and hour of peak volume
• detection-method: source of information
o 22 – video processing monitoring station
o other values may be used by other agencies, however, WisDOT appears to utilize
only this type. • link-data-type:
o 1 – actual
o 2 – reconstructed
o 3 – historical
o 4 – predicted
o 5 – smoothed
3.1.2 “routeData” Module
In 511.xml, the “routedata” module includes the following data records:
• route-id: identifier up to 32 alphanumeric characters • route-status: Traffic condition:
o TravelTimeValid = 0x00000001
o OverMaxSpeed = 0x00000002
o UnderMinSpeed = 0x00000004
o NoLinkData = 0x00000008
o NotEnoughData = 0x00000010
o FaxTravelTime = 0x00010000
o SignTravelTime = 0x00020000
• operational-link-count: number of links on its corresponding route considered to be operational
• total-distance: total length of route in meters
• display-travel-time: travel time to display on or web in seconds. -1 means unavailable, -2 means invalid.
• calculated-travel-time: actual calculated travel time in seconds. -1 means unavailable, -2 means invalid.
• minimum-travel-time: minimum travel time through route using each link’s speed limit in seconds. -1 means unavailable, -2 means invalid.
• nominal-travel-time: travel time calculated using each link’s travel time in seconds. -1 means unavailable, -2 means invalid.
• maximum-travel-time: maximum realistic travel time through the route in seconds. -1 means unavailable, -2 means invalid.
• delay: difference between the calculated (actual) travel time and the nominal travel time when traffic is flowing less than the speed limit (seconds)
• organization-information
o organization-id; will be set to WisDOT
o organization-name; will be set to WisDOT
o center-id; Milwaukee or Madison, whichever center contributed the data
• last-event-update
o date; Date given in YYYYMMDD
o time; Time given in HHMMSSssss where ssss is decimal seconds up to 4 places.
o offset; valid time offset using 24 hour notation. Given in HHMM format.
3.1.3 “fullEventUpdate” Module
This module includes the following data records:
Message-header
• message-type-id: identifies the type of event being sent
o BEU – Basic event update
• Message-type-version: identifies the version of the message structure being used, e.g. Version 1 of the Event Report Message.
• Message-number: a unique identifier of a specific message instance.
Organization-sending
• organization-id: will be set to WisDOT • organization-name: will be set to WisDOT
• center-id: Milwaukee or Madison, whichever center contributed the data
Contact Details
• contact-id: string type data with maximum of 32 characters. • person-name: string type data with maximum of 32 characters.
Message-time-stamp
• date: date given in YYYYMMDD
• time: time given in HHMMSSssss where ssss is decimal seconds up to 4 places. • offset: valid time offset using 24 hour notation. Given in HHMM format.
Event-reference
• event-id: Incident ID in database or LCS, will be a string with 32 characters maximum. • event-update: the number of times the log has been modified for a specific roadway event.
Event-indicators
• Event-indicator
o Status: Populated from STOC's IMS comment fields. For LCS: corresponds to
Facility Comment
Event-headline
• Headline
o Accidents-and-incidents: The ITIS codes used to classify and categorize types of
events:
513 = “accident"
514 = “serious accident" 515 = “injury accident" 516 = “minor accident"
517 = “multi vehicle accident" 518 = “numerous accidents"
519 = “accident involving a bicycle" 520 = “accident involving a bus"
527 = “medical emergency" 528 = “secondary accident"
529 = “rescue and recovery work REMOVED" 530 = “accident investigation work"
531 = “incident" 532 = “stalled vehicle" 533 = “abandoned vehicle" 534 = “disabled vehicle" 535 = “disabled truck" 536 = “disabled semi trailer" 537 = “disabled bus"
538 = “disabled train" 539 = “vehicle spun out" 540 = “vehicle on fire" 541 = “vehicle in water"
542 = “vehicles slowing to look at accident" 543 = “jackknifed semi trailer"
544 = “jackknifed trailer home" 545 = “jackknifed trailer"
546 = “spillage occurring from moving vehicle" 547 = “acid spill"
548 = “chemical spill" 549 = “fuel spill"
550 = “hazardous materials spill" 551 = “oil spill"
552 = “spilled load" 553 = “toxic spill"
554 = “overturned vehicle" 555 = “overturned truck" 556 = “overturned semi trailer" 557 = “overturned bus"
558 = “derailed train" 559 = “stuck vehicle"
560 = “truck stuck under bridge" 561 = “bus stuck under bridge" 638 = “accident cleared" 639 = “incident cleared" 640 = “unspecified severity" 641 = “on shoulder or median"
Event-element-details
• event-element-detail
• element-descriptions
• element-description
o phrase: will be free text
• element-lanes
o lanes-total-effected: total number of lanes affected.
• element-locations
• element-location
• location-on-link
o ink-ownership: name of designated owner of link. Any combination of up to 256
ASCII characters
• link-designator: set to STDNAME for main roadway.
• Link-id: a unique numerical designation for the Link within the network. • Link-direction: string value
Primary-location
• Link-name; set to HWYLST
• Point-name; name of a point along a roadway, a string of up to 256 characters.
Geo-location
• Latitude; latitude in integer micro degrees • Longitude; longitude in integer micro degrees
Landmark-location
• Landmark-type; string, locally defined • Landmark-name; landmark name from STN
• Landmark-point-name; Set to STN "RDWY_LINK_ID:LINK_OFFSET", where LINK_OFFSET is in thousandths of a mile (variable length)
Upward-area-reference • Area-id: FIPS county code • Area-name: county name
Update-time
Date; Date given in YYYYMMDD
Time; Time given in HHMMSSssss where ssss is decimal seconds up to 4 places.
Offset; valid time offset using 24 hour notation. Given in HHMM format.
Valid-period
3.1.4 “dMSDeviceStatus” Module
The “dMSDeviceStatus” module consists of the following data records:
Organization-information
Operator-id: unique operator ID consisting of up to 32 characters.
Device-id: unique device id consisting of up to 32 characters.
Dms-device-status: device operational status.
o on (1)
o off (2)
o in service (3)
o out of service (4)
o unavailable (5)
o unknown (6)
dms-current-message: string data type.
Message-source-code: string data type.
Organization-Information
organization-id: will be set to WisDOT
organization-name: will be set to WisDOT
center-id: Milwaukee or Madison, whichever center contributed the data last-comm-time
Date: Date given in YYYYMMDD
Time: Time given in HHMMSSssss where ssss is decimal seconds up to 4 places.
Offset: valid time offset using 24 hour notation. Given in HHMM format.
3.2 Parsing the “511LCS.xml”
511LCS.xml provides the associated information of the lane closures events. The information is classified into four types: general closure information, location information, scheduling
information, and comments and detour information. Furthermore, the generation information contains organization, project description, event headline and etc. The location information contains primary location, secondary location information and etc. Scheduling information contains all the time information related with lane closures. Comments and detour information includes some additional information. In order to track all the lane closure events and locate them in our proposed system and App, this system designs the following parsing algorithms to extract all relevant information:
Algorithm I: tracking the time and location information
Location:
Location is represented by following attributes in 511LCS.XML
<latitude> </latitude> <longitude> </longitude>
<secondary-location> The end landmark of the closure <geo-location>
<latitude> </latitude> <longitude> </longitude>
In 511LCS.XML, it uses both detailed coordination data and description to show the location information. See the following for an example:
<primary-location> <geo-location>
<latitude>44012731</latitude> <longitude>-88582343</longitude> </geo-location>
<link-name>US 41 NB</link-name>
<point-name>ON RAMP FROM 9TH AVE</point-name>
Here is a closure event caused by construction and it will begin at a point with lat 44.012731 and long -88.582343, where is ON RAMP FROM 9TH AVE in US 41NB. All the link name and point-name are listed in the LCS-landmarks-2010-8-6 database. Noticeably, if we combine the link-name and point-name and search the combination in the above mentioned database, detailed coordinates will be returned, which is exactly Lat 44.012731 and Long -88.582343. All the combined link-name and point-name are connected with unique coordinates, which means just track the Latitude and Longitude in 511LCS.XML and then we can accurately locate a closure event.
Time:
Our proposed system reports the start time and end time of the lane closure to travelers. A timer set is designed in this study to install as a time reminder that activate in the beginning and end of the event.
In 511LCS.XML, time is reacted by the following attributes: <start-time>
<date> </date> <time> </time> <expected-end-time> <date> </date> <time> </time>
For example: <start-time>
<date>20130614</date> <time>050000</time>
The above closure event will start at 2012/3/23 07:00 and will end at 2013/6/14 05:00 (It is a construction event).
Algorithm II: additional description and direction information
The Algorithm II will parse the additional description of the lane closure and the direction of the lane closure from XML and add it into the developed system. For example,
Report the closure reason: <event-headline>
<headline>
<roadwork>construction</roadwork>
Add direction into program: <link-direction>n</link-direction> N means “North”.
CHAPTER 4: ALTERNATIVE ROUTE DECISION MODEL
After parsing the 511 data feeds files, the developed system needs to analyze the impact of the events and decide whether or not to issue alternative route recommendation to travelers via the App either prior to the trip or when they are on their route. This study has performed extensive analyses of the past five-year major incident data in the stretch of interstate highway 94
(Madison - Milwaukee) using the Wisconsin Lane Closure System and the InterCAD Traffic Incident Data Exchange System to obtain a comprehensive incident scenario dataset. Alternative route will be recommended for those real-world incident/work zone scenarios in a
well-calibrated simulated environment with varying traffic demand levels, driving behavior patterns, geometric configurations, and traffic control parameters.
Alternative route decisions will be evaluated and ranked for each experimental scenario by the developed decision model. A reliable and convenient statistical model will be developed to allow the system to make the best alternative route recommendations to travelers prior to their trip or when they are on the way.
4.1 Data Collection and Extraction
4.1.1 Description of Data Collection Network
The area of study for alternative route decision model development consists of the IH-94 corridor between the city of Madison where IH-94 connects with IH-39/90 and the city of Milwaukee where it connects to IH-43. The segment covers approximately seventy miles of mostly rural highway from IH-39/90 until reaching Milwaukee County, at which point it continues on as an urban highway.
4.1.2 Data Sources
All data collected for the initial dataset came from the Wisconsin TOPS Laboratory operated by the University of Wisconsin–Madison. There are multiple databases containing crash and incident information maintained by the TOPS Lab. This study chose two, the MV4000 Crash Data database and the InterCAD to complete the preliminary data set. While it would have been preferable to query and use only one database, neither of these databases was complete, and therefore needed to supplement each other. It is for this reason that the dataset is comprised of only two years of data rather than the originally intended five years. While the MV4000 database now covers over eighteen years of incidents, the InterCAD database contains only two years and limits the scope of the data set accordingly.
4.1.2.1 Source 1: MV4000
of information used to build the preliminary data set. The MV4000 database uses standardized data fields to describe each incident. A sample of what the retriever tool looks like is shown in Figure 4.1. Data were retrieved for the years 2010 and 2011 to match the time period that was available from other sources.
Figure 4.1. Retriever tool
4.1.2.2 Source II: InterCAD Traffic Incident Data
The second database used for the study was the InterCAD Traffic Incident Data database
(InterCAD). This database, while it contains much less data than the MV4000 database, contains the detection and end time for each incident, which is absolutely necessary for a complete
database. In rare cases the InterCAD database was able to act as a supplement to MV4000 due to missing or insufficient data. While InterCAD does contain a free text field, these data are not standardized in any way and cannot be compared consistently with other data points. Figure 4.2 shows the user interface for the InterCAD Data Retrieval Facility.
Figure 4.2. InterCAD Data Retrieval Facility
InterCAD, like MV4000, provides users with both a web-based interface as well as an option to download the data in a comma-separated values format.
4.1.3 Data Compilation
4.1.3.1 Database Merging
Figure 4.3 shows a screenshot of the databases after being combined by the data team.
Figure 4.3. A screenshot of the databases combined into one spreadsheet
4.1.3.2 Final Data Set
The merging of the database was not the final step in developing the dataset. The final data set consists of a new layout in the most advantageous manner for this study. Data fields that were deemed useful by the author were included in the final database, as well as fields generated by the author. Examples of fields generated include time parameters that were generated from existing fields in the data, some data that required a conversion from text to numeric form in cases where the author found that it would be more useful, and cases where it was necessary to generate a field that depended on multiple other fields. To create a field that tells the user
whether or not trucks were involved in a given incident, that field must be dependent on all fields describing vehicle type.
4.2 Division of Freeway Segments
To ensure that the proposed decision model is effective under a wide range of work zone and incident scenarios and roadway geometric and traffic conditions, the research team has divided the interstate highway 94 (Madison - Milwaukee) into eighteen segments. The purpose of the division is to make sure each segment includes the freeway mainline experiencing an
incident/work zone construction, on-ramps, off ramps, upstream and downstream of the incident location, and the connecting parallel detour route. All divided segments are described as follows:
Figure 4.4 shows the configuration of the first segment that starts at County Highway N in Dane County and ends at State Highway 73. Figure 4.4 indicates that the eastbound path and the westbound path both use the same highway segments in reverse. Also noted in Figure 4.4 as well as in the subsequent segment figures is the location of traffic control devices, stop signs, and traffic signals.
Image: ©2014 Google
Figure 4.5 shows the configuration of the second segment. This segment also uses the same route in both directions. Segment 2 traverses from Dane County to Jefferson County from west to east.
Image: ©2014 Google
Figure 4.5. Segment 2
The third segment is shown in Figure 4.6. Segment 3, located in Jefferson County, uses the same route in both directions.
Image: ©2014 Google
Figure 4.6. Segment 3
Image: ©2014 Google
Figure 4.7. Segment 4
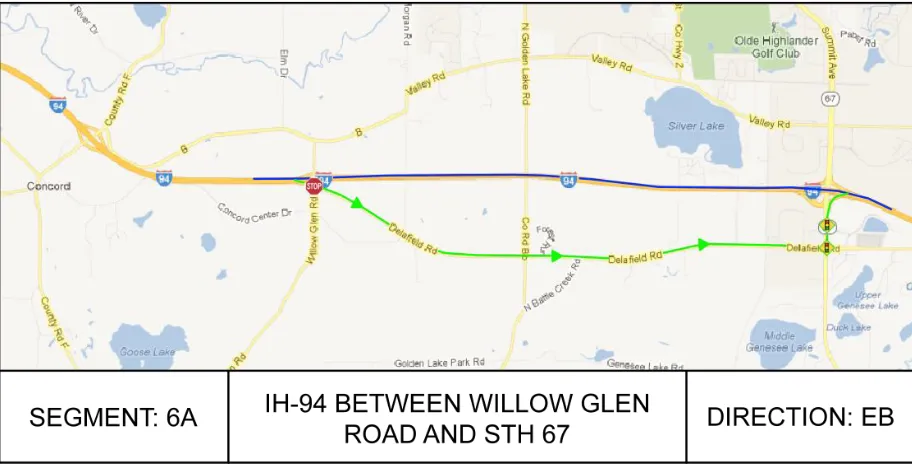
Segment 5 is the only segment in which traffic must be diverted to another segment in order to form a full diversion route. The reason that traffic cannot be contained in segment 5 is the lack of an eastbound on-ramp and a westbound off-ramp at the interchange with Willow Glen Road. Because segment 6 has two viable diversion paths, Segment 5 does also, because traffic must be diverted into Segment 6. Segment 5 is also in Jefferson County.
Image: ©2014 Google
Figure 4.8. Segment 5
affected by the nonstandard interchange configuration at Willow Glen Road when incidents occur within Segment 6.
[image:41.612.76.532.119.353.2]Image: ©2014 Google
Figure 4.9. Segment 6
Figure 4.10 shows Segment 7 located entirely in Waukesha County. Segment 7 uses the same route for traffic diverting in both directions.
Image: ©2014 Google
Segment 8 is shown in Figure 4.11. Segment 8 is also located in Waukesha County and uses the same route in both directions.
Image: ©2014 Google
Figure 4.11. Segment 8
Segment 9 is shown in Figure 4.12. Segment 9 is located in Waukesha County and uses the same routes for diversion traffic in both directions.
Image: ©2014 Google
Figure 4.13 shows the configuration of Segment 10. Segment 10 is located in Waukesha County and diversion traffic can travel in either direction using either the road to the north of the freeway segment, Golf Road, or the road to the south of the freeway segment, Silvernail Road. All
possible routes were identified in order to find the optimal diversion route for any segment in which multiple routes were available for diversion traffic.
Image: ©2014 Google
Figure 4.13. Segment 10
Image: ©2014 Google
Figure 4.14. Segment 11
Figure 4.15 shows Segment 12. Again, Segment 12 is located in Waukesha County and allows diversion traffic to travel in two different routes, Golf Road located to the north of the freeway segment, and Silvernail Road located to the south of the freeway segment.
Image: ©2014 Google
Figure 4.15. Segment 12
form any part of any diversion route. Segment 13-14 utilizes only one diversion path that
accommodated diversion traffic in both directions. Segments 13 and 14 are located in Waukesha County.
Image: ©2014 Google
Figure 4.16. Segments 13 and 14
Image: ©2014 Google
Figure 4.17. Segment 15A
Figure 4.18 shows the southern diversion route for Segment 15 using CTH JJ.
Image: ©2014 Google
Figure 4.18. Segment 15B
Image: ©2014 Google
Figure 4.19. Segment 16
Image: ©2014 Google
Figure 4.20. Segment 17
Segment 18 is described in Figure 4.21. Segment 18 also has two diversion routes. The southern diversion route is shown in Figure 4.21, using Greenfield Avenue.
Image: ©2014 Google
4.3 Experimental Design
During an incident/work zone construction, many factors may affect the final decision on whether or not to implement alternative route guidance to travelers, such as traffic volumes on the freeway and the detour route, the incident duration, the number of lanes blocked, and the number of signals on the detour route, etc. To ensure that the proposed decision model is
effective under a wide range of incident scenarios and roadway geometric and traffic conditions, freeway segments extracted from Section 4.2 are modeled and calibrated in a microscopic simulation test bed. It will be quite cost-effective to use such an experimental environment to replicate a variety of complex and dynamic traffic patterns as well as the real-world operational characteristics (e.g. turning-bay, delay on ramps, and driving behavior) that may contribute to warranting an alternative route. Conceptual design of the experiment and key contributing factors are shown in Figure 4.22.
Figure 4.22. Conceptual experimental design and key contributing factors
4.3.1 Simulation Network Construction
To realistically reflect the real-world operational characteristics in the study network (e.g., turning-bay, delay on ramps, and driving behavior), this study has modeled and calibrated each experimental scenario with the widely used micro-simulation package, CORSIM. The networks built with this the graphical interface TRAFED in the TSIS™ software represent the segments.
to specify the real world width. For example, Figure 4.23 shows an overview of a network that has been created in the TSIS™ software package using TRAFED.
[image:50.612.74.538.116.334.2]Image: ©2014 Google
Figure 4.23. An example freeway corridor segment in the simulation test bed
4.3.1.1 Simulation on Interchange
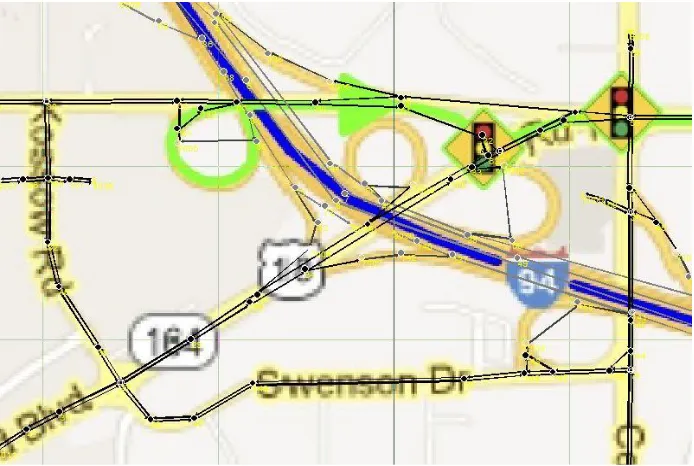
Interchange is a special geometry that needs more efforts to deal with in constructing simulation network. Figure 4.24 is a close-in view of an interchange created in TRAFED that is part of Segments 17 and 18. While the radii are displayed in TRAFVU, they are not considered in the simulation model. The length of the segment is, however, considered. For example, if a
Figure 4.24. A close-in view of an interchange
4.3.1.2 Simulation on Intersections
Intersection geometries are important factors in the performance of a high volume traffic
Figure 4.25. A typical intersection layout
4.3.1.3 Technique on Geometric Parameter Estimation
Google Maps was a very important part of the data collection of this study. Without Google Maps, the process of ascertaining the properties described in this section would have become onerous, or the degree of accuracy attained would have been severely diminished.
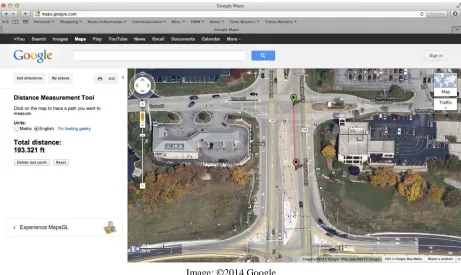
Using Google Maps, geometric data was collected for each of the segments. In addition to geometric data such as the number of lanes comprising a road segment, using the Distance Measurement Tool facilitates obtaining distances for turn bays, freeway auxiliary lanes, and any other critical dimension.
Image: ©2014 Google
Figure 4.26. Demonstration of using Distance Measure tool
Image: ©2014 Google
Figure 4.27. A screen shot of Street View
In summary, Google Maps is great tool in this study to estimate important geometric parameters such as the distances for turn bays, freeway auxiliary lanes, speed limits of a certain corridor and many other critical geometric attributes. Other parameters such as turn volumes, entrance node volumes and exit percentages on the freeways were necessary only to test that the network performed without any errors, as those parameters would be later specified in the running of the experiment, and many different combinations of values would be used.
4.3.2 Category of Key Variables
With a well-established simulation network for each segment, it is necessary to define the category of key factors that may potentially affect alternative route recommendation. This study organizes all the potential factors associated with each experimental scenario into the following groups:
Freeway-related factors: flow rate on the freeway mainline and the number of lanes on the freeway mainline;
Work zone-related factors: work zone duration and the number of lanes blocked;
Traveler-related factors: level of traveler compliance rates to the alternative route recommendation.
4.3.3 Range of Variables Values
[image:55.612.69.541.224.441.2]The range of values of some key factors that will be used in the model development is summarized in Table 4.1; note that these variables and corresponding ranges are original and they may be re-categorized for model construction if needed.
Table 4.1. Key variables and range of values for the experimental design
Variable Description Range of Values
FR_VOL Freeway mainline volume rate
(in vphpl)
250, 750, 1250, 1750, 2200
FR_LN Number of lanes on the freeway mainline 2, 3, 4
INC_DUR Incident duration (in mins) 15, 30, 45,60, 75, 90,105, 120
LN_BLK Number of lanes blocked 1, 2, 3, 4
LC_VOL1 Flow rate on the road connecting from
freeway to detour route (in vphpl)
200, 300, 400, 500, 600, 700, 800
LC_VOL2 Flow rate on the detour route
(in vphpl)
200, 300, 400, 500, 600, 700, 800
LC_VOL3 Flow rate on the road connecting from
detour route to freeway (in vphpl)
200, 300, 400, 500, 600, 700, 800
LC_LN Number of lanes on the detour route 1, 2, 3
NUM_SIGNAL Number of signals on the detour route per mile
2, 3, 4, 5, 6, 7
4.3.4 Scenarios Generating
Considering the wide range of values taken by each contributing factor, the total number of experimental scenarios that can be generated from all possible combinations of key factors will be extremely large. For example, assuming each factor takes five possible values, one can
generate a total of 513 = 1,220,703,125 scenarios. It will be impossible to evaluate all those
4.4 Model Development and Validation
This section will develop and calibrate alterative route decision models. Before the development of the decision models, an optimization model developed by Liu et al. (2011) that can generate optimal detour rate will be presented in Section 4.4.1. The generated optimal detour rate will be compared with a threshold in the two-choice model to determine whether an alternative route decision should be made or not.
Section 4.4.2 presents the development and calibration results of a two-choice model considering many potential factors that have been presented in previous sections. A preliminary analysis with Classification and Regression Tree (CART) will be embedded in this section to analyze the significance of selected variables and re-group the variables to better develop the proposed two-choice model. Obviously, this model provides the result of “provide alternative route
recommendation” or “do not provide alternative route recommendation,” which is effective guidance in the process of incident/work zone management.
4.4.1 Diversion Optimization Model
Experimental Scenario
The Optimal Diversion Control Model
CORSIM
Total throughput Total vehicle in queue Optimal diversion
rate Signal timing Ramp metering
[image:57.612.121.490.68.403.2]Total travel time Total time in queue
Figure 4.28. Connection of detour optimization model and CORSIM
The experimental scenarios served as inputs for the proposed model and the outputs (diversion rate, signal timing optimization, ramp metering) of such a model associated with the
experimental scenarios served as the inputs for CORSIM.
(a) Arterial model
[image:58.612.75.539.72.542.2](b) Freeway and ramps Source: Liu et al. 2011
Figure 4.29. Macroscopic network flow modeling in the integrated diversion control model
To facilitate the model presentation, the notations used hereafter are summarized below:
Notation
t
: Time step for updating arterial status (secs);h
T : Length of the control time interval h (#. of
t
);H: The entire control time horizon;
k
: Time step index of arterial system corresponds to timet
k
t
;N
N
S n
n, : Index of arterial intersections;
U
S : Set of arterial links;
OUT
S : Set of outgoing arterial boundary links;
U
S i
i, : Index of links,
r
S : Set of traffic demand entries;
n
P : Set of signal phases at intersectionn;
n P p
p, : Index of signal phase at the intersectionn;
) ( ), (i 1 i
: Set of upstream and downstream links of linki;
i
l : Length of linki (ft);
i
n : Num. of lanes in linki;
i
N : Storage capacity of linki (vehs);
i
Q : Discharge capacity of linki (veh/h);
free i v
,
min
: Minimum density (veh/mile/lane) and the free flow speed at linki(mph);
min
,v
jam
: Jam density (veh/mile/lane) and the minimum speed (mph);
, : Constant model parameters;M i
S : Set of lane groups at linki;
M i S m
m, : Index of lane groups at linki;
) ( , j 1 i
ij m
: A binary value indicating whether the movement from link i to
j
uses lane groupm; i
m
Q : Discharge capacity of lane groupm at linki (veh/h);
r r k r S
d [ ], : Demand flow rate at entry r at step
k
(veh/h);r r k r S
q [ ], : Flow rate enter the link from entry r at step
k
(veh/h);r r k r S
w [ ], : Queue waiting on the entry r at step
k
(vehs);] [k
qiin : Upstream inflows of link i at step
k
(vehs);) ( ],
[k j 1 i ij
: Relative turning proportion of movement from link i to j;
] [k
Ni : Num. of vehicles at link i for at step k (vehs);
] [k
vi : Mean approaching speed of vehicles from upstream to the end of queue at link i at step k
(mph); ]
[k
i
: Density of the segment from upstream to the end of queue at link i at step k (veh/mile/lane);
] [k
qiarr : Flows arriving at end of queue of link i at step k (vehs);
] [k
si : Available space of link i at step k (vehs);
] [k
xi : Total num. of vehicles in queue at link i at step k (vehs);
] [k
qim : Flows join the queue of lane group m of link i at step k (vehs);
] [k
xmi : Queue length of lane group m of link i at step k (vehs);
) ( ],
[k j 1 i
ij m
] [k
Qmi : Flows depart from lane group m of link i at step k (vehs);
] [k
Qijpot : Flows potentially depart from link i to j i at step k (vehs);
] [k
Qij : Flows actually depart from link i to j i at step k (vehs);
] [k
gnp : Binary value indicating whether signal phase p of intersection n is set to green at step k.
, : Index of the incident upstream on-ramp and off-ramp, respectively
, : Index of the incident downstream on-ramp and off-ramp,
respectively
) ( ],
[k j 1 i
ij
: Relative turning proportion of normal arterial traffic from link i to
j
) ( , j 1 i
ij
: A binary value indicating whether detour traffic at link iheading to
downstream on-ramp will use downstream link
j
or not] [k
Ni : Num. of vehicles from normal arterial traffic at link i at step
k
] [k
Ni : Num. of detour vehicles heading to downstream on-ramp at link
i at step
k
] [k i
: Fraction of normal arterial traffic in total traffic at link i at step
k
) ( ],
[k j 1 i
ij m
: Percentage of normal arterial traffic in lane groupm going from link
i to
j
] [k
Qij : Normal arterial traffic flows actually depart from linkito link
j
atstep
k
] [k Qij : Detour traffic flows heading to downstream on-ramp
actually
depart from linkito link
j
at stepk
} ,
{Ch hH : Common cycle length for all intersections in the control interval h
} ,
,
{ h n SN h H
n
: Offset of intersectionnfor each control interval h
} , , ,
{Gnph nSN pPn hH : Green time for phase p of intersectionn for each control interval h
} ,
{Rh hH
: Metering rate at the incident upstream on-ramp
for each control
interval h
} ,
{Zh hH
: Diversion rate at the incident upstream off-ramp
for each controlinterval h
The integrated control model aims to maximize the use of the corridor capacity to minimize congestion on the freeway mainline due to an incident with the following control objective:
Hk i S in i H t i OUT k q T t q 1 1 0 ,
1 [] [ ]
max S Z G C s t
s T T
np T
n
T
] , , , [ : .