Eutectoid transformations
Eutectic structures at off-eutectic compositions (a reminder)
Figure 1. An off-eutectic composition C0
Figure 2. Solute buildup required for growth of a regular eutectic structure at off-eutectic composition
Consider an alloy of composition C0 on the phase diagram of Figure 1. One often assumes that
this alloy would consist of phase plus eutectic, where the eutectic fraction is given by the lever
rule as
C0C
CE C
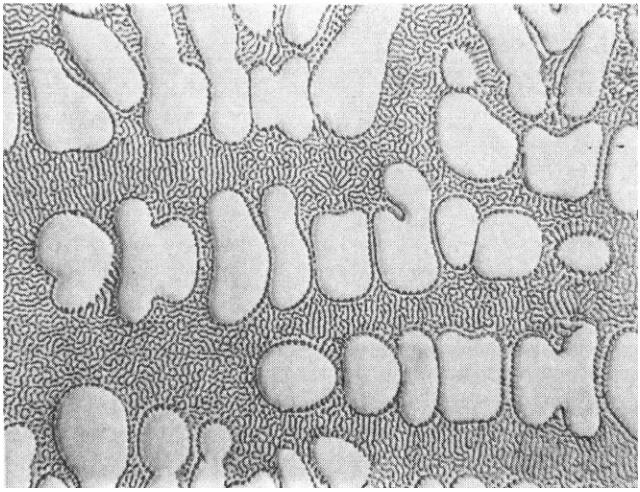
. In a cast alloy, the phase would be present as dendrites with theeutectic between the dendrites as shown in the figure below.
[image:1.612.146.466.427.673.2]the eutectic microstructure. We will refer to such a structure as a eutectic composite. The composition of a eutectic composite is necessarily an average composition, C, over the two
phases of the composite, C f C
1 f
C, where f is the volume fraction of the phasein the eutectic composite, and C and C are the volume concentrations of the and phases
in the eutectic composite as determined from the phase diagram, Figure 1. For a solid of eutectic composition, CE, the value of f is determined from the phase diagram as
C CE
C C
. However, if one can make the plates of the eutectic alloy thicken, thenthe volume fraction of phase, f, will increase and the average eutectic composite
composition C drops below C . Hence, a eutectic composite can, in principle, have any average
composition between
E
C and C depending only on the relative volume fractions of the and
[image:2.612.71.547.324.561.2]plates in the composite microstructure.
[image:2.612.307.542.338.532.2]Figure 3. Lamellar eutectic composite Pb and 23 wt.% Cd
Figure 4. Rod eutectic composite Sn and 18 wt.% Cd
Figure 3 and Figure 4 present two examples of eutectic composites. The Sn–Pb alloy is 20 wt % off the eutectic composition and the Pb–Cd alloy is 6 wt % off eutectic.
The next question then is how can one produce such a eutectic composite at off-eutectic compositions. Consider the rod of composition C0 solidifying to the right in Figure 2. In order
[image:2.612.75.293.338.533.2]1. The liquid at the solid-liquid interface be near to the eutectic composition, CE;
2. The planar interface must be stable (no dendrites).
The first criterion is met by the presence of a solute buildup at the interface as shown in Figure 2. This solute buildup in the liquid can produce constitutional supercooling. However, it has been found experimentally that the presence of constitutional supercooling is not always a sufficient condition to cause the planar interface to degenerate into dendrites. Recent experimental results show that the constitutional supercooling criterion works quite well if C0 is close to C.
However, for close to it is often possible to maintain a planar interface at much lower
temperature gradient in liquid than predicted by the constitutional supercooling criterion. At the present time a correct stability criterion based on kinetic perturbation analysis is the subject of considerable debate.
0
[image:3.612.225.388.315.452.2]C CE
Figure 5. The coupled growth region (cross hatched) on the phase diagram
Eutectoid transformations (main discussion starts here)
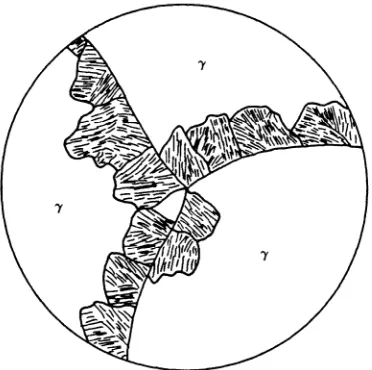
Eutectic solidification was discussed and it was pointed out that the regular eutectic structure results from a form of coupled growth in which two solid phases grow from the liquid in a cooperative manner. Eutectoid transformations also often occur by a coupled growth process in which two solid phases, and , grow cooperatively from a third solid phase, ; see Figure 6. Just as in eutectic growth the microstructure of the coupled phases usually consists of alternating lamellar sheets of and , and there is generally some preferred epitaxial relationship between the and crystals at their common interfaces.
Figure 6. Diffusion of carbon required during pearlite growth
Figure 7. Fe-C phase diagram locating pearlite composition, 0.77 wt % C
The most famous and commercially important eutectoid transformation occurs at 0.77 wt % C in steel. The lamellar structure consists of alternating plates of ferrite and cementite, Fe3C, and has
been given the name pearlite; see Figure 7. This name apparently arose because a polished and etched pearlitic structure has the colorfulness of mother-of-pearl. The color results from the fact that the lamellar structure at the etched surface acts as a diffraction grating for light. The same fascinating appearance is found on properly etched lamellar eutectic structures. The pearlite reaction in steel has been of such predominant importance to metallurgists that it is not unusual to refer to any eutectoid transformation as a pearlite transformation.
Accordingly, we are mainly concerned here with the steel pearlite reaction because of its commercial importance and because it has been studied quite extensively. Figure 8 shows the temperature composition region of the Fe–C phase diagram in which the lamellar pearlite structure can form. It should be noted that pearlite formation is not restricted to the eutectoid composition, 0.77% C. Also, at temperatures increasingly below the eutectoid temperature the and Fe3C phases may form from the phase by a noncoupled growth process producing a
Figure 8. Temperature-composition regions of Fe-C alloys showing various precipitates existing at long reaction times
Morphology
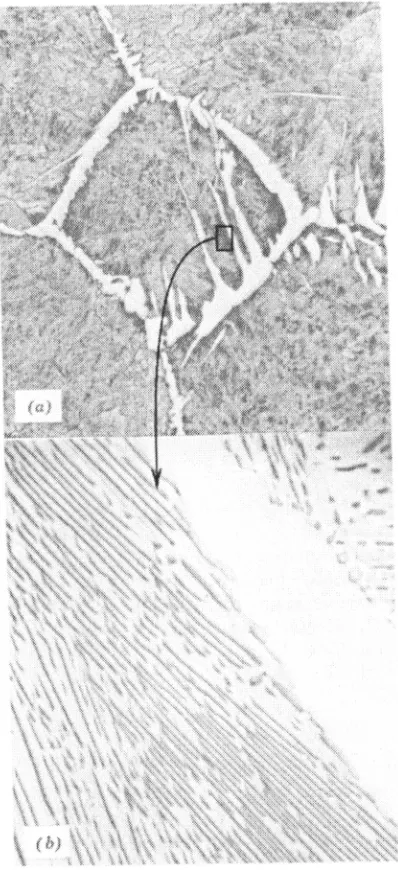
It is quite generally observed that pearlite structures nucleate at the grain boundaries of the parent phase and grow into the parent phase as roughly spherically shaped grains called nodules, Figure 9. Each of these nodules is composed of a number of structural units in which the lamellae are largely parallel; these structural units are generally termed pearlite colonies, see Figure 10. It is often observed that the pearlite nodules only grow into one of the adjoining grains as is shown in Figure 9.
The morphologies of eutectic microstructures may be classified into three categories: 1. Regular;
2. Complex-regular; 3. Irregular.
Figure 9. Nodules of pearlite growing in the interior of austenite grains from grain boundaries
Figure 10. An example of a nodule with several colonies. In this case, a
number of colonies is three
[image:6.612.214.401.356.601.2]Nucleation
Figure 11. Definition of various parameters used in the text
Consider a hypoeutectoid steel of composition C1 shown on Figure 11. It is common to label the
three pertinent phase boundaries A3, Acm, and A1 as shown on Figure 11. After homogenizing the
1
T, which is between the A1 line and T1
. The phase (austenite) is now supersaturated in solute
(carbon) with respect to the phase (ferrite). The phase becomes supersaturated with respect to
when cooled below the A3 line, and it becomes supersaturated with respect to cementite when
cooled below the Acm line.
We therefore expect to see ferrite form as a grain-boundary allotriomorph (GBA) with perhaps some Widmanstätten side-plate formation. As the ferrite allotriomorphs grow into the austenite grains, the composition in the austenite at the interface increases until it eventually reaches C2
shown on Figure 11. This austenite in contact with the GBA interface is now supersaturated with respect to cementite Fe3C, as determined by extrapolation of the Acm line. Consequently, some
cementite forms and this nucleates the pearlite reaction and the remaining austenite within the interior of the grains transforms into a pearlite structure so that one obtains a microstructure such as Figure 12. Notice that the actual composition of the pearlite would be a maximum at the GPA interface and decrease toward the grain centers.
If we now changed the temperature of the salt bath to T1 shown on Figure 11, the entire
austenite grain would be supersaturated with respect to both ferrite and cementite immediately following the quench. If there is no barrier to cementite formation (there is much less chance of an effective barrier to ferrite formation since the austenite is supercooled so far below A3), then
pearlite should form immediately without formation of proeutectoid ferrite. Hence, it may be possible to form a pure pearlite structure in the off-eutectoid alloy if it is quenched to
temperature below T1. This is, in fact, the case as may be seen from Figure 8.
Coupled lamellar growth of off-eutectic structures can also be obtained and the coupled growth region of Figure 5 is quite similar to the pearlite region of Figure 8. In the eutectic case, the coupled growth region is limited by formation of dendrites due to constitutional supercooling. In the eutectoid case, one might expect Widmanstätten side plates to limit the coupled region analogous to dendrite formation in eutectics because the austenite is supercooled well below A3.
case is a function of position relative to the interface. It is generally much smaller than the supercooling present in off-eutectoid growth because the eutectic interface temperature is generally constrained to be within a few degrees of the eutectic temperature, whereas the eutectoid interface temperature may be 100 or more degrees below the eutectoid temperature.
Figure 12. An AISI 1040 steel transformed by slow continuous cooling (a) Ferrite present at the prior austenite grain boundaries as GBA with several
It is interesting to realize that the composition of the pearlite in an off-eutectoid steel is not 0.77 wt % C unless one has the equilibrium amount of proeutectoid ferrite or cementite present. Therefore, unless steel is cooled slowly one will have a pearlite with less than 0.77% C in a hypoeutectoid steel and greater than 0.77% C in a hypereutectoid steel. The pearlite composition is a function of the relative size of the ferrite and cementite plates so that pearlite lowers its composition by simply increasing the ferrite plate width and raises its composition by increasing the cementite plate width.
In a hypoeutectoid steel, the pearlite colonies will form at the interfaces between the proeutectoid ferrite and the austenite. If the proeutectoid ferrite acts as a nucleation site for the pearlite colony, then one would expect the crystallographic orientation of the ferrite to be the same in the proeutectoid ferrite and in the pearlite colony. Pearlite in steel may be nucleated by either ferrite or cementite (it had been thought for quite some time that pearlite in steel could only be nucleated by cementite). In hypereutectoid steels the proeutectoid cementite nucleates pearlite, and in hypoeutectoid steels the proeutectoid ferrite nucleates the pearlite. The actual mechanism of the nucleation event is fairly complex. There are indications that in at least some cases there is an initial competition between the two phases with first one phase forming a film and then the other nucleating an adjoining film, until eventually crystallographic and compositional conditions are evolved that produce an alternating structure of ferrite and cementite. As this structure then grows the ferrite–cementite spacing adjusts itself by a branching process until the steady-state spacing characteristic of the reaction temperature is obtained.
Growth
Is considered in the “Discontinuous precipitation and growth” notes.
Kinetics of formation
Pearlite forms by a nucleation and growth process and consequently the volume transformed into pearlite will have the time dependence described by the Avrami equation:
1 ktn
X e
the Avrami equation is independent of the nucleation rate . The form of his analytic results depends on whether nucleation occurs on a grain corner, a grain edge, or a grain boundary, and the resulting k and n values of the Avrami equation are listed in the table below.
[image:10.612.187.432.170.263.2]N
Table 1
Nucleation Site k n
Grain boundary 2AG 1
Grain edge 2
LG
2
Grain corner 4G3 3 3
In this table, G is the growth rate, A is the grain-boundary area, L is the grain edge length, and
is the number of grain corners per unit volume. Under these saturation conditions, transformation will be complete as soon as the pearlite nodules migrate half way across the grains. Therefore, letting d equal the average grain diameter and G the average growth rate we may estimate the time for complete volume transformation, tf , simply as
0.5
f
d t
G
(1)
This result as well as the results in Table 1 shows clearly that the rate of pearlite formation is dependent upon the grain size of the austenite from which the pearlite forms. Except for the highest transformation temperatures, site saturation is expected to occur in pearlite formation.
Therefore, since N is not involved, as shown in Table 1, the two important parameters controlling the volume rate of pearlite formation are
1. growth rate G; 2. The grain size.
T-T-T diagrams
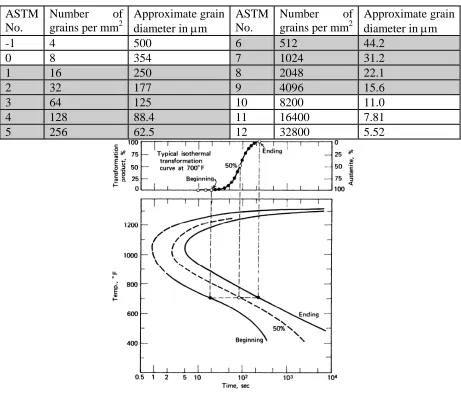
Figure 13. T-T-T diagram for AISI 1080 steel. Austenized at 1650°F (900°C). Grain size: 6
The steel of Figure 13 had an ASTM grain size of 6. From Table 2 we estimate the grain
diameter as 44 m so that from equation (1) we may estimate the growth rate as 6.3 10 4 cm/sec.
It should be pointed out that below around 500°C on this T-T-T diagram pearlite does not form. A very fine Widmanstätten side-plate structure called Bainite forms down to the temperature labeled Ms. Below this temperature only martensite forms. The important point to see here is
Since the Avrami equation is independent of for pearlite, except at high transformation temperatures, the time-temperature position of the nose of the T-T-T curve will be controlled by two main things:
N
1. The grain size;
2. The pearlite growth equation.
[image:12.612.76.537.267.661.2]Addition of alloying elements to steels decreases the pearlite growth rate. It should be clear, then, that by alloying additions one may shift the nose of the T-T-T curves to the right and increase the hardenability of steel.
Table 2. ASTM Grain Size Numbers (usual ASTM numbers are shaded)
ASTM No.
Number of grains per mm2
Approximate grain diameter in m
ASTM No.
Number of grains per mm2
Approximate grain diameter in m
-1 4 500 6 512 44.2
0 8 354 7 1024 31.2
1 16 250 8 2048 22.1
2 32 177 9 4096 15.6
3 64 125 10 8200 11.0
4 128 88.4 11 16400 7.81
5 256 62.5 12 32800 5.52