doi:10.1016/S1537-5110(02)00218-0 SE}Structures and Environment
A New Approach to Controlled Natural Ventilation of Livestock Buildings
K. Andonov; P. Daskalov; K. Martev
Department of Automatics, University of Rousse, 8 Studentska Street, 7017 Rousse, Bulgaria, e-mail of corresponding author: daskalov@ru.acad.bg
(Received 8 April 2002; accepted in revised form 9 September 2002)
An alternative is considered for substitution of the present mechanically ventilated air-conditioning systems in standard livestock building structures on commercial pig-growing farms in Bulgaria. On the basis of a proposed method of controlled natural ventilation and air conditioning in a stock breeding building, some pig-breeding buildings for piglets and fattened pigs have been restructured. Seasonal studies of temperature and humidity have been conducted. Average statistical values for the air temperature and humidity in the restructured buildings and in the existing building with mechanical ventilation, which is regarded as reference, are presented. In the naturally ventilated building, a more favourable humid environment is maintained, the temperatures being comparable to those in the reference house. The regained heat flows of the heat exchange systemhave been calculated. A 2825% degree of heat recovery of the ventilation heat loss can be obtained. The favourable results with the naturally ventilated systems show that this system is a realistic alternative for ventilation in pig-breeding buildings in Bulgaria and its application must be promoted.
#2003 Silsoe Research Institute. All rights reserved Published by Elsevier Science Ltd
1. Introduction
Pig breeding in Bulgaria is a commercial activity and pig building structures are mainly ventilated. Bulgaria has a moderate climate with the following distribution of temperatures throughout the year: 05% between15 and258C; 25% between7 and148C; 8% between 1 and68C; 18% between 0 and 58C; 19% between 6 and 118C; 22% between 12 and 178C; 175% between 18 and 238C; 10% between 24 and 298C; 25% between 30 and 368C (Climate Reference Book of Bulgaria, 1983). For these conditions, the finishing pig housing can do without additional heating. The consumption of energy for building ventilation is still rather high, though, and may thus create difficulties for pig producers when economic margins are small and when electricity costs are high as in Bulgaria. These circumstances demand new, effective and energy-saving methods of air con-ditioning. The object of research is the standard building structures for pig growing, which have a share of about 60% in the whole of pig-producing farmstructures in this country (Beremsky, 1978). Special attention in elaborating the method of ventilation was given to
natural ventilation systems because of the possibility of considerable reduction of electrical energy consumption. The research results in this field are rather scanty (Foster & Down, 1987). It is generally believed that the natural ventilation systems are not able to ensure the required indoor climate throughout the year. The under-lying recent intensive research shows that the controlled natural ventilation systems can be successful in compar-ison with the mechanical ventilation systems (Berckmans & Goedseels, 1986). Natural ventilation systems have a much lower sound level than mechanical ventilation systems and reduce the risk for the animals to suffer from respiratory diseases (Brockett & Albright, 1987).
2. Air conditioning with automatically controlled natural ventilation
The research studies on controlled natural ventilation systems refer mainly to ventilation by means of openings situated in the side walls and the ridge of buildings (Brockett & Albright, 1987; Bruce, 1978), where the air flows directly into the animal living area, thus raising the
1537-5110/03/$35.00 91 #2003 Silsoe Research Institute. All rights reserved
risk of respiratory diseases. In winter, the waste heat recovery is limited. During the summer, the buildings are not ensured against overheating.
The drawbacks mentioned are not encountered in the ventilation scheme shown in Fig. 1 (Andonov et al., 1989). Basic elements of the ventilation system are movable side-wall valves (1), inlet (2) and outlet air ducts (3) and ridge vent (4). The air inlet and outlet ducts are manufactured from reinforced polyethylene foil. Ducts (3) are double-bottomed, constituting an air cushion (8). In this way, no condensate is formed on the outer duct surface. Inlet air ducts (2) are connected with windows (10), which are acting as valves. Vents (4) are placed on ridge (6) and are connected with outlet air ducts (3). Ridge vents (4) contain a control valve (5), and ridge vents bottomvalve (7) can be opened for summer ventilation.
The building roof (6) is made of thin weather-proof plates froman artificial material. Air inlet ducts (2) and outlet ducts (3) compose the underroof insulation. They serve as a heat exchanger as well.
The longitudinal building walls contain movable valves (1) of stagger disposition with adjacent spray nozzles (9), the latter serving for water cooling of
incoming air during hot summer days when outdoor relative humidity is rather low.
The system functions in two major modes}summer and winter modes.
2.1. Winter mode
In winter, valves (7) and (1) are closed [Fig. 1(b) and (c)]. Fresh air enters through inlet channels (2) to the upper middle part of the building. Running through channels (2), the air is being partially recuperatively heated with waste heat fromoutlet channels (3) and indoor air, which is in contact with the inlet channels. Leaving the inlet channels, the inlet air is uniformly distributed to the animal housing area. Thus, the air is additionally heated by the heat emanated by the pigs. In the animal area, the air is taken up by the outlet channels (3) and is exhausted fromthe building through ridge vents (4). The air exchange is controlled by valve (5). The inlet and outlet air channels are of a successive arrangement for a better distribution of temperature and velocity fields of air in the building. Inlet channels (2) are situated next to the roof and occupy the lower Notation
c specific heat of air, kJ/kg8C
MRhe1A weekly averaged value of air relative
humidity inside experimental building 1, zone A, %
MRho weekly averaged value of relative
humidity of the outdoor air, % MRhr weekly averaged value of air relative
humidity inside the reference building, % Mte1A weekly averaged value of air
temperature inside experimental building 1, zone A,8C
Mte1B weekly averaged value of air
temperature inside experimental building 1, zone B,8C
Mto weekly averaged value of temperature
of the outdoor air,8C Mtr weekly averaged value of air
temperature inside the reference building,8C
Ql ventilation heat loss without heat
recovery, kW
Ql mean value ofQl, kW
Qu recovered heat for ventilation process
in experimental building 2, kW Qu mean value ofQu, kW
T interval of record digitization, h ta air temperature inside the building,8C
to temperature of the outdoor air,8C
t1 air temperature inside in the beginning
inlet ducts,8C
t2 air temperature inside in the end inlet
ducts,8C
t3 air temperature inside in the beginning
outlet ducts,8C
t4 air temperature inside in the ridge vent,8C
V airflow rate through the ridge vents, m3s1 e efficiency factor for the recovery heat, % r density of air, kg m3
sRhe1A weekly root-mean-square deviation of
air relative humidity inside experimental building 1, zone A, %
sRho weekly root-mean-square deviation of
relative humidity of the outdoor air, % sRhr weekly root-mean-square deviation of
air relative humidity inside the reference building, %
ste1B weekly root-mean-square deviation of air
temperature inside experimental building 1, zone B,8C
sto weekly root-mean-square deviation of
temperature of the outdoor air,8C str weekly root-mean-square deviation of air
half of the roof area. Nevertheless, the air running through themis partially heated, however its tempera-ture stays near to the outdoor temperatempera-ture. This is an important physical pre-condition for reduction of thermal losses through building roof.
2.2. Summer mode
In hot weather, valves (5), (7) and (1) are open [Fig. 1(d) and (e)] and ventilation is carried out mainly
by means of circulation of atmospheric air entering through side-wall valves (1). Air is partially taken in by channels (2) as well. Air moves through animal area and further flows out into the atmosphere through outlet vents (4). Waste air is taken in by channels (3). When the temperature in the building ta is
compara-tively high (ta>258C), spray nozzles (9) are set into
[image:3.539.92.446.86.512.2]operation. The water spray is directed to the animal area, where it wets pig bodies and locally cools the building structure.
Another refined variant of a natural ventilation system with improved possibilities of utilization of waste ventilation heat is shown in Fig. 2(a)–(c) (Andonov,
[image:4.539.108.444.73.572.2]1994). Novelties are the outside inlet air ducts which are constituted by the external building wall and heat insulation layers (11). Window valves (10) are connected Fig. 2. Livestock building with refined variant of controlled natural ventilation system with improved possibilities for utilization of waste heat: (a) winter mode; (b) summer operational mode; (c) top view from the building (excl. the roof); (1) side-wall valve; (2) air inlet duct (channel) with width 2400 mm and height 440 mm; (3) air outlet duct (channel) with width 2000 mm and height 210 mm; (4) ridge vent; (5) air damper; (6) roof; (7) bottom valve; (8) air cushion; (9) water spray nozzles; (10) knee-joint window; (11) heat-insulation barrier; ta air temperature inside the building; to temperature of the outdoor air; t1 and t2 air temperatures, respectively, inside in the beginning of inlet ducts and inside in the end inlet ducts; t3air temperature inside in the
with these ducts and with inside inlet air ducts (2) within the building. Inside inlet (2) and outlet (3) ducts do not alternate as in comparison with the aeration plan of Fig. 1(a). They are situated one inside the other, as inlet air ducts (2) envelop the outlet air ducts. Thus, a more effective waste ventilation heat exchanger is constituted.
The system functioning in winter and summer modes is illustrated in Fig. 2(a) and (b). An advantage of the proposed ventilation systemis the increased utilization of waste heat. This is due to the improved arrangement of the motion of the airflow. Running through the outside inlet air ducts, the fresh air is being partially heated with the heat passing across the wall. This heat is regained heat that was lost through the wall. Entering into inside air ducts (2), the air envelops the whole surface of outlet air channels (3) and deprives their heat as it is being additionally heated. Thus, the waste ventilation heat losses are utilized.
3. Experimental buildings
Three livestock buildings were monitored. Experi-mental building 1 is a standardized building structure for 1800 growing and finishing pigs, where the air conditioning is accomplished by means of an auto-matically controlled natural ventilation system (ACNV) (Fig. 1). Experimental building 2 is of the same design standard, with a capacity of 800 weaned piglets with a body weight of 7–30 kg. This building is equipped with the proposed refined ventilation system(Fig. 2).
The building used as a reference was of the same design standard (Fig. 3), had the same animal capacity as experimental building 1 and was ventilated with a mechanical ventilation system.
3.1. Experimental building 1
The area of experimental building 1 was 1600 m2, with a volume of 6000 m3, length 100 m, width 16 m and
height 6 m. Two zones (A and B) of equal area were established [Fig. 1(a)]. Zone A was furnished with the water spray nozzle systemfor cooling atmospheric air. There were no such water spray nozzles for cooling in zone B. Inlet air channels (2) were 40 in number with dimensions of 24 mby 04 m. Outlet channels (3) were 32 in number with the same dimensions. The total area of side valves (1) was 92 m2, the total number of valves was 40 (20 valves on each side of the building). Vents (4) were 16 in number with a total area of 16 m2. Nine hundred pigs were housed in each zone of the building.
The controller (C) holds the algorithmfor the control of air temperaturetain the building. The air temperature
taof 188C is taken to be an optimum temperature. The
two-level temperatures of 228C and of 258C were preset. Valves (5), regulating the air exchange, closed partially at ta 4188C, and opened completely at ta >188C .
When valves (5) were partially closed, about 10% of the area of vent openings remained. Thus, the minimum quantity of the necessary air for the animals was ensured. When the value for ta exceeded the set value
of 228C, bottomvalves (7) and side valves (1) were opened. Water spray nozzles (9) were set in operation when the value for ta exceeded the set value of 258C.
Relative humidity of the outdoor air is 20–60% in the summer in Bulgaria, thus allowing considerable eva-porative cooling. Heat stress is decreased this way and specific control functions on indoor humidity are not necessary.
3.2. Experimental building 2
[image:5.539.105.437.583.684.2]The area of experimental building 2 was 420 m2, with a volume of 1575 m3, length of 35 m, width of 12 m and height of 5 m. Six inlet–outlet air channels were situated under the roof [Fig. 2(a)]. They were made from reinforced polyethylene foil with the dimensions shown inFig. 2(b), section A–A. The control of air temperature
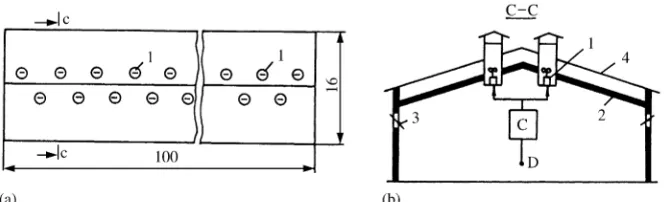
Fig. 3. Mechanical ventilation system installed in standard reference building: (a) layout of building with fan arrangement; (b) cross-section of building with insulation; (1) fans; (2) roof insulation; (3) knee-joint window; (C) controller; (D) temperature
inside the building was equal to the one in experimental building 1.
3.3. Reference building
The area of the reference building was 1600 m2, length 100 m, width 16 mand height 6 m(Fig. 3). Sixteen
high-speed fans of volume flow rate from
1000 to 2000 m3min1 and a total electric capacity of 48 kW were mounted on the roof. The roof (4) was made of corrugated artificial material plates. Roof heat insulation consisted of an 80 mm thin glass wool layer. Controller (C) switches the fans into operation with maximum flow rate of 2000 m3/min when tempera-ture of airtais higher than 228C. The minimum flow rate
is used at ta4228C. The fans are turned off when
ta5188C.
4. Thermal and hygroscopic processes
The weekly change in temperature and relative humidity of air was continuously recorded by hygro-thermographs.
The data were recorded in the course of 32 weeks which is the period of two cycles of 4 months each, designated for finishing pigs. The measuring period comprises all seasons}winter, spring, summer and autumn.
All the recorded data were statistically analysed. The thermal and relative humidity processes with air are treated as ergodic randomprocesses with normal distribution (Martinenko et al., 1984). Mathematically proposed values and root-mean-square deviation of processes are calculated and compared for each week of the finishing pig period. The interval of record digitiza-tion T is 1 h. The obtained results are represented in Figs. 4 and 5.
Additional active experiments were carried out for evaluation of aeration rate and waste heat recovery in experimental building 2. The atmospheric temperature to, temperature taof the air inside the building, the air
temperature t1 and t2, respectively, inside in the
beginning of inlet ducts and inside in the end inlet ducts, the air temperature t3inside in the beginning of
outlet ducts and the air temperature inside in the ridge ventt4along with the flow rateVof ventilation air in the
experimental building were synchronously recorded. Measuring locations are given in Fig. 2. Low-inertia platinumthermoresistors were used. Airflow through roof openings was measured by means of a thermo-electrical anemometer with a measuring set of 20 thermocouples (Petkov and Bankov, 1978). The integral value of air velocity was taken into consideration. The
accuracy of measurement in the range 0–06 m s1 is 001 ms1, and in the range 06–09 m s1 is 005 ms1. Thirty experiments were carried out in
0 5 10 15 20 25 30 35
1 3 5 7 9 11 13 15 17 19 21 23 25 27 29 31
Weeks
Temperature,
°
C
[image:6.539.280.511.76.228.2]Spring Summer Autumn & winter
Fig. 4. Comparison of the thermal processes in the buildings: , Mtoweekly averaged value of temperature of the outdoor air; ,stoweekly root-mean-square deviation of temperature of the outdoor air; , Mte1B weekly averaged value of air temperature inside experimental building 1, zone B; ,ste1B weekly root-mean-square deviation of air temperature inside experimental building 1, zone B; , Mte1Aweekly averaged value of air temperature inside experimental building 1, zone A, equipped with evaporative cooling (with nozzles); , Mtr weekly averaged value of air temperature inside the reference building and ,strweekly root-mean-square deviation of air
temperature inside the reference building
0 10 20 30 40 50 60 70 80 90 100 Relative humidity, %
Spring Summer Autumn & winter
1 3 5 7 9 11 13 15 17 19 21 23 25 27 29 31
Weeks
Fig. 5. Comparison of the hygroscopic processes in the build-ings, where: , MRho weekly averaged value of relative humidity of the outdoor air; ,sRhoweekly root-mean-square deviation of relative humidity of the outdoor air; , MRhe1A weekly averaged value of air relative humidity inside experi-mental building 1, zone A; , sRhe1A weekly root-mean-square deviation of air relative humidity inside experimental building 1, zone A; , MRhr weekly averaged value of air relative humidity inside the reference building and ,sRhr weekly root-mean-square deviation of air relative humidity inside
the winter. The duration of each experiment was 240 min. A sampling interval of 10 min was chosen. The heat transferred in the ventilation processQuin kW
was calculated according to the equation
Qu¼rcVðt3t4Þ
where: r is the density of the air in kg m3; c is the specific heat of the air in kJ kg1K1; V is the airflow rate through the ridge vents in m3s1; t3 is
the air temperature inside in the beginning outlet ducts in8C;t4is the air temperature inside in the ridge
vent in8C.
The waste heat (ventilation heat loss) Ql in kW was
calculated according to the equation
Ql¼rcVðtat0Þ
where:tais the air temperature inside the building in8C;
to is the temperature of the outdoor air in8C.
The results of one experiment are represented graphically in Fig. 6(a)–(c). The mean values Qu and Ql for the heat transferred and the heat loss, respec-tively, for each experiment were determined. An efficiency factor for the recovery heat e was computed
0 5 10 15 20 25
0 20 40 60 80 100 120 140 160 180 200 220 240
Time from start, min
Temperature, ˚C
0.0 0.2 0.4 0.6 0.8 1.0 1.2 1.4 1.6 1.8
0 20 40 60 80 100 120 140 160 180 200 220 240
Time from start, min
Air exchange, m s
3
_1
0 5 10 15 20 25
0 20 40 60 80 100 120 140 160 180 200 220 240
Time from start, min
Heat, kW
(a)
(b)
[image:7.539.122.416.248.666.2](c)
Fig. 6. Results of one experimental cycle (240 min) for determining the air exchange rate and the quantity of recovered heat: (a) , totemperature of atmospheric air and air temperature t1, (t1=to) in the inside inlet duct; , air temperature t2in inlet opening; , air temperature t3, ( t3=ta) in outlet opening; , air temperature t4 in ridge vent; (b) air exchange V in
as the correlation
e¼Qu
Ql100 The results are summarized inFig. 7.
5. Technological results for finishing pigs
Finishing pigs with an initial weight of 30 kg and slaughter weight of 100 kg were in the reconstructed experimental building 1. Measurements were done during two production cycles with duration of about 4 months each. The first cycle comprises the period November–February (winter), the second one is from 15 May till September (summer). A special procedure was worked up for the purpose of this research. A limiting factor was the fact that the experiment was carried out under commercial conditions. In the reference building (Fig. 3), the number of pig pens was 78. Experimental building 1 had 80 pens, 40 pens were in zone A, and 40 in zone B. The number of pigs in each pen was 23–25. The pigs were brought into the experimental and reference buildings simultaneously.
The research had two main aspects.
5.1. Total control on pig condition in both buildings A register was kept for everyday record of the number and weight of the pigs, the expenditure on medicines, etc. Animals were weighed prior to and at the end of the pig finishing period. The results are presented in Table 1. The number of pigs in the experiment was between 1703 and 2004 for each cycle. The daily feed intake was registered.
5.2. Intermediate control
Three controlled boxes exist in each of the investi-gated buildings, both experimental and reference ones. The aimof the procedure is to obtain a better authenticity of results by means of an extract from the cycle of pig finishing. The period of observation was 4 weeks, the pens in the experiment had similar locations in both buildings. The batch number of pigs brought in was 70, all of themequal in liveweight, age, sex, and health condition. Pigs were weighed once a week at a fixed time. The results are presented in Table 2.
6. Analysis of measured results
The proposed arrangement of the ACNV system (Fig. 1) ensures better conditions for pig growing throughout the whole year, compared with existing mechanical ventilation systems (Fig. 3). For all the seasons, the air temperatures in the experimental and the reference buildings are very close in value (Fig. 4, curves Mte1B and Mtr, respectively). The difference
between both temperatures is up to 28C. The root-mean-square temperature deviation in experimental building 1 is the lowest one (Fig. 4, curveste1B), showing
more stable temperature fields were maintained through natural ventilation. Higher values of temperature in the experimental building are recorded in summer when no cooling of air exists (zone B) (Fig. 4, curve Mte1B
compared to Mtr). A considerable improvement of this
situation is found when cooling nozzles are applied (zone A, Fig. 1) (Fig. 4, curveMte1Acompared toMtr).
This fact should be mentioned as a new quality of the proposed arrangement of aeration, achieved on the basis
24 25 26 27 28 29 30 31 32
1 3 5 7 9 11 13 15 17 19 21 23 25 27 29
Number of experiment
Degree of utilized heat ,
[image:8.539.121.422.530.699.2]%
of saved electrical energy for ventilation. In this way, in summer, overheating of the animals and growth suppression are normally prevented.
As far as the humidity of air is concerned, the advantages of the proposed aeration systemare to be traced throughout the whole year. The relative humidity of the air in experimental building 1 in winter is 60–70% (Fig. 5, curveMRhe1A). No formation of condensate was
observed. In the reference building, the relative humidity was even higher than 80%, where a condensate was traced to formon roof and walls, due to restricted air exchange in the building when the controller turned off the fans. The comparison during transition seasons (spring–autumn) is similar. In summer, the humidity in the experimental building is closer to the optimum one. The operation of humidification nozzles maintains the humidity in the recommended range of 55–75% (Fig. 5, curveMRhe1A). The humidity variation was lower in the
experimental building, as expressed by the root-mean-square deviation (Fig. 5, curve sRhe1A). The energy
saving is considerable, up to 30% of waste heat is recovered [Fig. 6(c), curve Qu and Fig. 7]. The mean
value fromall experiments of the degree of utilized heat
is 2825%. Entering atmospheric air increases its temperature up to 58C Fig. 6(a), curve t2compared to
to]. In winter, the mean energy saving in experimental
building 2 is 126 kW h day1.
Better results in pig growing during the research period were recorded in experimental building 1 compared to the reference one: dead pigs were less, 07–135%, those slaughtered of necessity were less with 033–13%. The daily liveweight gain was higher with 43–66%, and fodder consumption was less, 19–94% (Table 1). The results of the check observation are higher too (Table 2). The differences in total are not very considerable, but they show the micro-environment in the experimental building to be of a more favourable nature for pig growing compared to the reference one.
7. Conclusions
[image:9.539.29.514.96.264.2](1) The experimental research proved the efficiency of the concerned air-conditioning systems. The com-parison between experimental building structure 1 Table 2
Results on pig breeding in controlled pens (3 in number)
Measurement Winter Summer
E R E R
Start End Start End Zone A Zone B Start End
Start End Start End
Number of pigs 70 70 70 70 70 70 70 68 70 69
[image:9.539.29.515.311.423.2]Mean weight, kg 43 587 438 575 421 568 413 532 419 535 Mean daily liveweight gain, kg 056 051 058 053 054 Feed conversion factor, kgkg1[liveweight gain] 496 544 485 524 531
Table 1
Summary results on pig growth in experimental (E) and reference (R) buildings
Measurement Winter Summer
E R E R
Zone A Zone B
Number of finishing pigs 2004 1703 968 973 1816
Mean initial liveweight of pigs, kg 2978 3451 3162 3015 30.95 Dead pigs
Number 36 49 15 22 51
% 18 287 156 228 2.8
Pigs slaughtered of necessity
Number 42 56 21 28 59
% 2 33 217 288 3.59
with an automatically controlled natural ventila-tion systemand the reference building structure with a mechanical ventilation system demonstrated the better temperature and humidity parameters of air and improved animal health conditions in the case of the former. The heat recovery is essential in experimental building structure 2.
(2) The concerned arrangements of automatically controlled natural ventilation systemcan serve as a basis for the construction of a model of energy saving in livestock building structures. Such structures would be a successful alternative of the existing pig-growing building infrastructure.
References
Andonov K J (1994). An aeration configuration in a stock
breeding building. Agricultural Mechanization, Bulgaria,5, 16–18
Andonov K J; Daskalov P I; Martev K V(1989). Microclimate
systemfor livestock building with controlled natural ventilation. Agricultural Engineering, Bulgaria, 2, 55–62
Berckmans D; Goedseels J(1986). Development of new control
techniques for the ventilation and heating of livestock buildings. Journal of Agricultural Engineering Research,33, 1–12
Beremsky S S(1978). Industrial pig growing. Zemizdat (Earth
Publishers), Sofia, pp. 170–179
Brockett B L; Albright TD(1987). Natural ventilation in single
airspace buildings. Journal of Agricultural Engineering Research,37,141–154
Bruce J M (1978). Natural convection through openings and
its applications to cattle building ventilation. Journal of Agricultural Engineering Research,23,151–167
Climate Reference Book of Bulgaria(1983). Vol. 3, pp. 198–208,
Sofia, Science and Art Publishers
Foster M P; Down M I (1987). Ventilation of livestock
buildings by natural convection. Journal of Agricultural Engineering Research,37,1–13
Martinenko I I; Girnik L; Polypchuk V M (1984).
Automatic Control of Heat and Humidity Modes at Agricultural Structures, Kolos Publishers, pp. 55–70. Moscow
Petkov G; Bankov B(1978). Veterinary Ecology, pp. 132–133.