An Application of the Weak Form of the Efficiency
Hypothesis on the Saudi Arabia Stock Market after
Tadawul
Mohammed Hokroh
University of Leicester, UK
Received: Feb. 24, 2013 Accepted: May 20, 2013 Published: June 1, 2013
doi:10.5296/ajfa.v5i1.3725 URL: http://dx.doi.org/10.5296/ajfa.v5i1.3725
Abstract
The aim of this study is to test the efficiency of the Saudi Stock Market (SSM) after “Tadawul” (the entity responsible for operating the SSM). The weak form of the efficiency theory was applied to test the SSM efficiency. The SSM daily stock price returns index was examined using autocorrelation and the run test of randomness from January 1st 2007 to March 18th 2007 (before Tadawul) and from March 19th 2007 to May 29th 2007 (after Tadawul). The results suggest more investigation to be done on the SSM behavioral finance and under reaction and overreaction split to confirm the SSM “efficiency”.
1. Introduction
1.1 The Efficient Market Hypothesis (EMH)
The Efficient Market Hypothesis (EMH) is a key discussion in the finance literature. Dr. Eugene Fama pointed out that there are three forms of this theory, the strong, semi-strong and weak form. He further defined the weak-form as a market where, under analysis, firms’ historical information will be fully and quickly reflected in its present stock price. (Poshakwale 1996) This is to differentiate it from the strong form which is defined as a market where, under analysis, firm’s publicly available or privately held information will be fully and quickly reflected in its present stock price. On the other hand, the semi-strong form is defined as a market where, under analysis, firm’s publicly available information will be fully and quickly reflected in its present stock price. (Gili et.al. 2008) Few applications of the theory were attempted in the Saudi Stock Market (SSM).
1.2 The History of the Saudi Stock Market (SSM) and the “Tadawul” system
The history of the SSM goes back to early 1934, when stocks were unofficially traded. In 1983, the official SSM was formed and gradually emerged until this date. (Al-Bogami 1996) “Tadawul” is the name of the company responsible for operating the market effectively and efficiently, ensuring market integrity, fairness and education of customers (Tadawul 2013a). The Tadawul Company was formed on March 19th 2007 and is assumed to bring transparency to the market, thus ensuring availability and reliability of information to all market participants (Tadawul 2013b). Few researchers tested the weak-form of the EMH in the SSM.
2. Literature Review
2.1 Previous work
2.2 Discussion
Although Al-Abdulqader et.al. (2007) proposed that IT may have contributed to the improvements of the SSM efficiency, their study was not aimed at examining Tadawul impact on efficiency. Abdulqader et.al. (2007) study was conducted before the “Tadawul” period when there was another system in place called the “Electronic Security Information System” (ESIS) offered by the Saudi Arabian Monetary Agency (Al-Bogami 1996). According to Al-Bogami (1996), the ESIS was the first technology to be introduced in the SSM in 1990. The ESIS helped make the SSM more transparent and provided investors with instant bid feature but had limitations (e.g. 400 domestic and oversea bank terminals) (Al-Bogami 1996). As a result, it was replaced by the “Tadawul” system (Tadawul 2013c).
Opposing to previous work, this study is aimed at examining the “Tadawul” effect on efficiency, an examination that has never been attempted in previous literature. Accordingly, the autocorrelation and the run test of randomness are used to test for the weak-form of the EMH before and after “Tadawul”.
3. Methodology
3.1Data Collection
The empirical work of this research is based on a comparison between the SSM daily stock price returns (close price) before and after Tadawul. Using the Tadawul Company’s official website data engine, I was able to obtain the SSM stock price returns from January 1st 2007 onward. Accordingly, the SSM daily stock price returns index before Tadawul (January 1st 2007 to March 18th 2007) and after Tadawul (March 19th 2007 to May 29th 2007) were
collected. The SSM daily stock price returns index includes all the daily closing price for all shares traded from 11:00 a.m. to 3:30 p.m. (Tadawul 2013d). All data was collected from the Tadawul Company’s website (http://www.tadawul.com.sa) using the websites’ historical database search engine (Tadawul 2013d). The total number of observations was 104 observations (52 before Tadawul and 52 After Tadawul).
3.2 Autocorrelation test
Autocorrelation is a statistical analysis technique used to describe the degree to which one variable is related to another (Levin et.al. 1998). In other words, to test the association between variable won values at different intervals of time (Kashif et.al. 2010). Accordingly, if there is a strong association between variables at a time series, a pattern can be predicated and as a result, the efficiency hypothesis is rejected. However, if the opposite occur, the efficiency hypothesis cannot be rejected and randomness is assumed.
Accordingly, two hypotheses are obtained;
H0: data is random, there is no sequence.
H1: data is not random, follow a predictable sequence.
The autocorrelation was applied on the SSM daily stock price returns index from 1/1/2007 until 3/18/2007 and from 3/19/2007 until 5/29/2007.
3.3 The Run Test of Randomness
The Run Test of Randomness is statistical test that is used to evaluate the randomness of a series of observations by analyzing the number of runs it contains. A run is defined as the consecutive appearance of one or more observations that are similar. (Weiers 2008) Accordingly, the run is the order of identical occurrence preceded and followed by different occurrence or by none at all (Levin et.al. 1998). To illustrate this, suppose for example that a random observation table contained the following data: 2, 7, 6, 8, 9, 6, 7, 6, 6 and 4. The median of these observations is 4.5. Thus, the digit (2) which is below the median (4.5) constitutes one run. The digit (4) which is also below the median will constitute another run and the middle eight digits that are all above the median make up another run. As a result, the observation table contained three runs. (Weiers 2008).
The run test can be calculated as follows:
T – ((2n1n2/n) + 1)
Z = ــــــــــــــــــــــــــــــــــــــــــــــــــــــــــ
√2n1n2 (2n2n1 – n)/n2 (n-1)
T is the number of runs, n1 is the number of observation of the first type, n2 is the number of observation of the second type and n is the total number of observations (n1 + n2).
Similier to autocorrelation, two hypothesizes are obtained:
H0: data is random, there is no sequence.
H1: data is not random, follow a predictable sequence.
The run-test was applied on the SSM daily stock price returns index from 1/1/2007 until 3/18/2007 and from 3/19/2007 until 5/28/2007 to examine the efficiency hypothesis before and after “Tadawul”.
4. Results and Findings
moving trend of prices inclining over time which suggest a predictable pattern. Diagram 2 shows a variation of price movements but fewer patterns are observed.
Diagram 1. The SSM price index before Tadawul
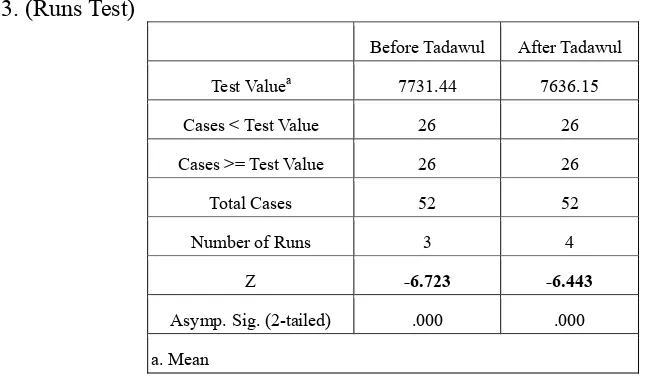
To test H0 andH1, autocorrelation and the run test of randomness were applied on the price
returns. The results of the autocorrelation test are shown in table 1 and 2 while the result of the run test of randomness is shown in table 3:
Table 1. (Autocorrelations)
Series: Before Tadawul (1/1/2007 to 3/18/2007)
Lag Autocorrelation (P) Std. Errora Box-Ljung Statistic
Value df Sig.b
1 .958 .135 50.502 1 .000
a. The underlying process assumed is independence. b. Based on the asymptotic chi-square approximation.
Table 2. (Autocorrelations)
Series: After Tadawul (3/19/2007 to 5/29/2007)
Lag Autocorrelation (P) Std. Errora
Box-Ljung Statistic Value df Sig.b
1 .864 .135 41.120 1 .000
a. The underlying process assumed is independence. b. Based on the asymptotic chi-square approximation.
Table 3. (Runs Test)
Before Tadawul After Tadawul Test Valuea 7731.44 7636.15
Cases < Test Value 26 26 Cases >= Test Value 26 26
Total Cases 52 52
Number of Runs 3 4
Z -6.723 -6.443
(autocorrelation), 18.5% (box-ljung statistic) and 4.16% (run test). This decrease gives a clear indication that an alteration in the SSM efficiency has obviously occurred after the formation of “Tadawul”. However it is not clear if this “efficiency improvement” is predominantly due to the “Tadawul” or just a “shock” resulting from regulatory changes? To further investigate, the SSM stock price index returns from 5/30/2007 until 12/31/2007 were tested via same tests to see if the alteration of efficiency preserved or decreased over time. In addition, the SSM stock price index returns from 1/1/2008 to 12/31/2008 were also tested. The results are shown in tables 4, 5, 6 and 7.
Table 4. (Autocorrelations)
Series: (5/30/2007 to 12/31/2007)
Lag Autocorrelation (P) Std. Errora Box-Ljung Statistic
Value df Sig.b
1 .972 .082 138.885 1 .000
a. The underlying process assumed is independence. b. Based on the asymptotic chi-square approximation.
Table 5. (Runs Test)
Series: (5/30/2007 to 12/31/2007)
Test Valuea 7837.67 Cases < Test Value 72 Cases >= Test Value 72
Total Cases 144
Number of Runs 12
Z -10.202
Table 6. (Autocorrelations)
Series: (1/1/2008 to 12/31/2008)
Lag Autocorrelation (P) Std. Errora Box-Ljung Statistic
Value df Sig.b
1 .979 .065 228.943 1 .000
a. The underlying process assumed is independence. b. Based on the asymptotic chi-square approximation.
Table 7. (Runs Test)
Series: (1/1/2008 to 12/31/2008)
Test Valuea 9285.31 Cases < Test Value 118 Cases >= Test Value 118
Total Cases 236
Number of Runs 12
Z -13.960
Asymp. Sig. (2-tailed) .000 a. Mean
et.al. (2010) found that investments objectives of finance professors are largely driven by the same behavioral factors for those amateur investors. Doran et.al. (2010) found that personal confidence in the ability to beat the market is independent of opinion on market efficiency. Thus, future research may look more on the behavioral finance of the SSM. Without looking collectively to all of these factors (behavioral finance, underreaction and overreaction split and returns correlation), it is difficult to confirm the SSM “efficiency”.
5. Conclusion
The aim of this study is to test the weak form of efficiency in the SSM before and after “Tadawul”. The SSM daily stock price returns index was examined from January 1st 2007 to March 18th 2007 (before Tadawul) and from March 19th 2007 to May 29th 2007 (after Tadawul) to investigate alterations in efficiency through autocorrelation and the run test of randomness. More investigation should be made on behavioral finance, underreaction and overreaction split. Without looking collectively to all of these factors (behavioral finance, underreaction and overreaction split and returns correlation), it is difficult to confirm the SSM “efficiency”
References
Al-Abdulqader, K. A., Hannah, G., & Power, D. M. (2007). A Test of the Weak-form of the Efficient Markets Hypothesis for the Saudi Stock Market. Journal of emerging market finance, 6(2),167-190. http://dx.doi.org/10.1177/097265270700600202
Al-Bogami, S. (1996). An Examination of the Usefulness of Interim Financial Statements to Investors in the Saudi Stock Market. Ph.D. thesis. United Kingdom: University of Dundee
Al-Razeen, A.M. (1997). The Weak-form Efficiency of the Saudi Stock Market. Ph.D. thesis. United Kingdom: University of Leicester
Butler, K. C., & Malaikah, S. J. (1992). Efficiency and Inefficiency in Thinly Traded Stock Markets: Kuwait and Saudi Arabia. Journal of banking and finance, 16(1), 197-210.
http://dx.doi.org/10.1016/0378-4266(92)90085-E
Doran, J. S., Peterson, D. R., & Wright, C. (2010). Confidence, opinions of market efficiency, and investment behavior of finance professors. Journal of Financial Markets, 13, 174-195.
http://dx.doi.org/10.1016/j.finmar.2009.09.002
Fama, E. F. (1998). Market efficiency, Long-term returns, and Behavioral finance. Journal of Financial Economics, 49(3), 283-306. http://dx.doi.org/10.1016/S0304-405X(98)00026-9
Fishman, M. J., & Kathleen H. M. (1992). Insider Trading and the Efficiency of Stock Prices.
The RAND Journal of Economics, 23(1),106-122. http://dx.doi.org/10.2307/2555435
Gili, Y., & Cheng, F. L. (2008). Efficient Market Hypothesis (EMH): Past, Present and Future.
Review of Pacific Basin Financial Markets and Policies, 11(2), 305-329.
http://dx.doi.org/10.1142/S0219091508001362
Efficient Market Hypothesis: Empirical Evidence from Asia-Pacific Markets. International Research Journal of Finance and Economics, 58, 122-132.
Khababa, N. (1998). Behaviour of Stock Prices in the Saudi Arabian Financial Market: Empirical Research Findings. Journal of Financial Management and Analysis, 11(1), 48-55.
Levin, R. I., & Rubin, S. D. (1998). Statistics for managers Upper Saddle River, New Jersey:
Prentice Hall
Onour, I. A. (2004). Testing Weak-Form Efficiency of Saudi Stock Exchange Market. Ministry of Economy and Planning, Riyadh: Saudi Arabia
Poshakwale, S. (1996). Evidence on Weak-Form Efficiency and Day of the Week Effect in the Indian Stock Market. Finance India, 10(3), 605-616.
Tadawul. (2013a). Our Technology Available online at: http://www.tadawul.com.sa/wps/portal/!ut/p/c1/04_SB8K8xLLM9MSSzPy8xBz9CP0os3g_
A-ewIE8TIwMLj2AXA0_vQGNzY18Q1wAoH4kk7x4QZmrgaeITbBQc4GVs4GlEQHdwa p6-n0d-bqp-QW5EOQDHzSS6/dl2/d1/L2dJQSEvUUt3QS9ZQnB3LzZfTjBDVlJJNDIwOE hTRDBJS1EzNzNNNDIwNDc!/ (February 5, 2013)
Tadawul. (2013b). Objectives Available online at: http://www.tadawul.com.sa/wps/portal/!ut/p/c1/04_SB8K8xLLM9MSSzPy8xBz9CP0os3g_
A-ewIE8TIwMLj2AXA0_vQGNzY18Q1wAoH4kk7x4QZmrgaeITbBQc4GVs4GlEQHdwa p6-n0d-bqp-QW5EOQDHzSS6/dl2/d1/L2dJQSEvUUt3QS9ZQnB3LzZfTjBDVlJJNDIwOE hTRDBJS1EzNzNNNDIwNDc!/ (February 10, 2013)
Tadawul. (2013c) Riyad Bank Profile Available online at: http://www.tadawul.com.sa/wps/portal/!ut/p/c1/nY9BDoIwFETP4gn-pwrK0qBi1TRIgVg2D dFKGoEaJOrxLTtWGM3sZuYlM5CDVVM8dVl02jRFBSfIPckwyGI6Ixg6voN0z49-SpYEd 3Obi2EeZS7S2YETHu2mSMlPNHIXezpLgkM4RcQvNFcNsK2pFQjI54Mmi3zb9NaUrmI MFwSS_ldx7j_xrtVNCaLSj653o0COofJq2nqjVXWRXJ0708pEvf8CQTh2pxjdea_T04sxN5 S3yQel3Oae/dl2/d1/L0lDU0lKQ2dwUkEhIS9JRFJBQUlqRUFJZ3FhbUtnL1lCSko0NTRrc2 x5dHdBISEvN19OMENWUkk0MjBHMTkxMElLU1E5VTJBMjBCNS9hY3Rpb25TdHJpb mcvY29tcGFueQ!!/?symbol=1010&tabOrder=5 (February 10, 2013)
Tadawul. (2013d). Historical Data Available online at: http://www.tadawul.com.sa/wps/portal/!ut/p/c1/lc9ND4IwDAbgn9TKl3pGxSlZCEPCuCwEJ
1kCm8EF_fmymxcxpre-fdIWaphLN5PqGquMbnqooI4ExbjMSeBhQrMtknO0J2SXY5LgnP PPPCtDJEHKPJadfCTeXxpZiE6XRZwmPiL-0ExqoEczSOBQr79Objwo3F9N635idlS6A96r h3XdLBZLVNzMOByU7K-CydaaURTyZd3C_ynw1Qz54qX34VI9KQ0nKsgbZit42w!!/dl2/ d1/L2dJQSEvUUt3QS9ZQnB3LzZfTjBDVlJJNDIwRzE5MTBJS1NROVUyQTIwSjc!/?sym bol=1010&tabOrder=2 (February 10, 2013)