ABUNDANCE IN MAINE
Lee E. Kantar1
and Rod E. Cumberland2
1Maine Department of Inland Fisheries and Wildlife, Bangor, Maine 04401, USA;2Maritime College of
Forest Technology, Fredericton, New Brunswick E3C 2G6, Canada
ABSTRACT: Management goals and objectives for moose (Alces alces) in Maine are centered on providing hunting and wildlife viewing opportunity. Robust population estimates of moose are critical to assure that harvest rates are appropriate and biologically sustainable while also addressing values of other user groups. The Maine Department of Inland Fisheries and Wildlife most recently used the rela-tionship between moose sightings by deer hunters and moose abundance to produce density indices within Wildlife Management Districts (WMD). Due to the marked decline of deer hunters in much of northern Maine that invalidates use of this technique, we tested a double-count aerial survey method to estimate moose abundance in 9 northern WMDs. Density estimates ranged from 0.4–4.0 moose/ km2
, sightability was high (>70%) for all size moose groups (1–≥3 moose), and moose were well dis-tributed across the landscape in early winter. The density estimates tracked closely with trends in moose sighting rate by moose hunters, harvest level, and hunter success rate in the survey area, and were consistent with jurisdictions in eastern Canada that also have low levels of predation and a pre-ponderance of younger-aged forests. The double-count aerial survey is considered the preferred method to estimate population density, whereas hunter sighting indices would be most useful to track temporal population changes within a WMD.
ALCES VOL. 49: 29–37 (2013)
Key words: aerial survey,Alces alces, double-count survey, moose, population estimate, Maine.
In Maine, management goals and objec-tives for moose (Alces alces) specify provid-ing huntprovid-ing and wildlife viewprovid-ing opportunity, as well as an adequate age structure of bulls (Morris 2002). Based on a planning process that involves public input, the Maine Depart-ment of Inland Fisheries and Wildlife (MDIFW) created 3 categories (zones) to manage moose: Recreation, Compromise, and Road Safety Zones. The primary goal in Recreation Zones is to maximize hunting and viewing opportunities by maintaining high moose density without affecting habitat quality (i.e., 55–65% of carrying capacity). In Compromise Management Zones, the goal is to balance public concern about moose-vehicle collisions with its desire to hunt moose; further, it is stipulated that moose populations in such zones must be
reduced by 1/3 from the population estimate calculated in the year 2000 that was based upon the relationship between moose abun-dance and moose observations by deer hunters (Bontaites et al. 2000). Objectives in Road Safety Zones are broadly stated as reducing the population as necessary to lower the danger or frequency of moose-vehicular collisions.
to the target population, as well as account-ability to multiple groups that value and use the moose resource. Therefore, it is imperative to have adequate data to support management decisions, particularly harvest levels.
The MDIFW has attempted various tech-niques to estimate abundance including transect counts from fixed wing aircraft, line-track intercept techniques, a modified Gasaway survey, and Forward Looking Infrared (FLIR). Maine had adopted a tech-nique that uses the relationship between moose abundance and moose observations by deer hunters based on work in adjacent New Hampshire (Bontaites et al. 2000). This relationship was predicated on aerial survey data using FLIR technology and having an adequate sample of moose sight-ings by deer hunters. This technique has been the cornerstone of estimating moose abundance in Maine, yet model assumptions were not tested in Maine, and the recent marked decline in deer and deer hunters in northern parts of Maine presumably invali-dates the sighting data requirement. There-fore, we used a double-count aerial survey, developed originally for white-tailed deer (Odocoileus virginianus) in Quebec (Potvin et al. 1992) and adapted for moose in New Brunswick (Cumberland 2012), to estimate moose abundance in 9 northern Wildlife
Management Districts (WMD) with
presumed high density and 1 WMD with low density.
STUDY AREA
Northern WMDs with the highest moose density based on hunter sighting rates, high-est harvhigh-est rates, and permit allocations (MDIFW data) were prioritized for the double-count surveys. Surveys were flown
in Aroostook County, Maine (17,687 km2)
that is comprised mostly of farmland
(>131,100 ha) in its eastern part, with
∼76,000 ha of actual cropland (Maine
Department of Agriculture, Food and Rural Resources 2003), and in northern portions of adjacent Franklin, Hancock, Penobscot,
Piscataquis, Somerset, and Washington
Counties. In total, the study area included
WMDs 1–6, 8, 11, and 19 and comprised
∼32,950 km2 (Fig. 1). Forested areas are
dominated by spruce (Picea spp.), balsam
fir (Abies balsamea), northern white cedar (Thuja occidentalis), and white pine (Pinus strobus), with mixed hardwoods of aspen (Populus spp.), birch (Betula spp.),
beech (Fagus grandifolia), and maple
(Acer spp.). Other species highly palatable
to moose include red-osier dogwood
(Cornus stolonifera) and willow (Salixspp.).
METHODS
Using a Geographical Information
System (GIS), each WMD was divided into blocks that were 259 km2and oriented either
S-N or E-W depending on the unique shape/ orientation of the WMD; survey blocks were uniformly 15 x 24 km rectangles. The Maine Land Cover Dataset (2004) was used to select 7 habitat variables: 1) crops/grass-lands/blueberry barrens, 2) deciduous forest, 3) evergreen (coniferous) forest, 4) mixed forest, 5) recent cuts/regenerating forest/ scrub-shrub, 6) wetlands, and 7) partial cuts. Urban centers, lakes, or non-permeable surfaces were not included in the GIS analy-sis. We calculated the percentage of each habitat variable within each survey block and the total percentage of each habitat vari-able within all blocks in a WMD.
WMD 4 were flown the same winter (2012) to investigate consistency of density esti-mates in the largest WMD (>5200 km2) and
to survey areas receiving high hunting pres-sure. As an initial evaluation of the relative reliability of the technique at lower moose density, we surveyed WMD 11 where
density was considered low based on sight-ing and harvest rate.
Universal Transverse Mercator (UTM) points delineated the survey blocks and transects spaced 1 km apart systematically set at the edge of a block. For each survey
block, flight maps included 7, ∼15 km
transects that were oriented either N-S or E-W to account for as much habitat variation as possible, yet ensure that variation among transects was minimal and precision maxi-mized (Caughley et al. 1976).
A Bell Jet Ranger 206 was outfitted with bubble windows for the front and rear obser-ver to increase and improve viewing angle from the helicopter skid. A radar altimeter was installed to ensure that height above ground was maintained at 60 m regardless of topography. Flights were conducted and maintained at 60 m above ground level at
speeds of 56–72 km/h; they occurred on
days with no precipitation and low wind speed (<24 km/h). We flew when snow con-ditions would not impede moose movement (<61cm) and ambient temperature was cold (<−12 °C; Quayle et al. 2001).
Transects widths were initially calibrated at 60 m above ground level while the aircraft hovered over a 60 m width delineated on the ground. Observers sighted the width from the edge of the helicopter skid out to 60 m by affixing a tape line across the bubble win-dow. A modified communications system was used to isolate the 2 observers seated fore and aft on the port side of the helicopter. To ensure independence, moose observa-tions were communicated separately by each to the recorder who sat behind the pilot; observers could not hear or speak to each other (Gauthier and Cumberland 2000). The recorder initiated and ended each flight transect, relayed all information to the obser-vers and pilot, and was responsible for
fol-lowing the flight lines and checking
navigation. Transect coordinates were
entered into a mobile GPS unit and the on-board GPS prior to flight departure. The flight crew remained constant for all flights. The recorder cued the 2 observers at the start and end of each transect. Observers independently sighted moose within the 60 m transect width and relayed the number of moose to the recorder. If the recorder
was unable to determine if both observers counted the same moose, they immediately asked questions concerning the location, habitat, and direction of movement. The
recorder then determined independently
whether the 2 observers identified the same moose, thereby verifying and subsequently recording the observation data. Thus, obser-vations could be categorized as by the pri-mary observer only, the secondary observer only, or by both observers; these data served as the mark-resight elements. Estimates of abundance (moose/km2) and sighting
prob-abilities were calculated following Rivest et al. (1995) and Cumberland (2012).
To evaluate the relationship between the double-count survey and other population indices in Maine, we compared our density estimates with trends in moose sightings by moose hunters during the October season, harvest success rates, and permit allocations over a fairly stable hunt framework period
(2003–2010). As a general assessment of
the technique, we reviewed moose sightings and group size on transects and among sur-vey blocks to characterize moose distribu-tion within survey blocks.
RESULTS
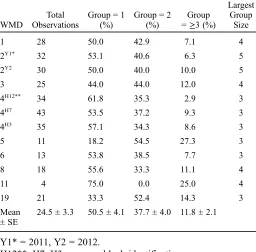
A total of 294 observations (≥1 moose/ observation) occurred in the 12 surveys. The observation rate ranged from 4–43 per survey block, averaging 24.5 (Table 1). Across all flights, single moose represented
50.5%, 2 moose 37.7%, and ≥3 moose
11.8% of all observations (Table 1). Single moose represented≥50% of observations in 75% of the surveys; the largest group size was 5 moose. Across all surveys, the sight-ing probability of a ssight-ingle moose by the
for-ward (0.72, range = 0.47–1.00) and rear
and rear observers (0.89, range = 0.68–1.00) were nearly identical and also not different (P= 0.973) (Table 2).
In the winter of 2010–11, flights were conducted on 28 and 31 January and 1 Feb-ruary 2011 in Wildlife Management Districts 2, 3, and 6; density estimates were 3.0 ± 0.2, 2.7 ± 0.6, and 1.2 ± 0.3 moose/km2,
respec-tively (Table 3). Favorable conditions
occurred earlier in 2011; flights were conducted on 12 and 16 December, and continued on 8, 9, 11, 22, and 26 January, and 8 and 15 February; surveys occurred in WMDs 1, 2, 4 (3 flights), 5, 8, 11, and 19. The density estimates ranged from 0.4 ± 0.2 (WMD 11 with presumed low density)
to 4.0 ± 0.7 moose/km2 (WMD 4). No
change in the density estimate occurred from 2011 (3.0 ± 0.2) to 2012 (3.1 ± 0.6
moose/km2) in WMD 2 that was flown both
winters. Density estimates for all surveys are provided in Table 3.
From 2003–2010, the
highest sighting rates occurred in the northern tier of the state, ranging from 1.3 (WMD 11) to 6.9 (WMD 2), and declining north to south as moose habitat declines in quality (Table 3). We used linear regression to test whether these average sighting rates were related to the density estimates in the sur-veyed WMDs; the relationship was significant with a moderate R2(n = 13,F= 5.10,P= 0.045,
R2= 0.32).
DISCUSSION
The predominance (>85%) of observations as single or 2 moose indicated that
conduct-ing flights under optimal
conditions (<30 cm snow and <∼−17 °C) helped ensure that moose were distributed spatially and not clumped. In deeper snow conditions or in late winter when temperatures have ameliorated, moose typically spend more time in coniferous cover and/or in larger groups. We saw no evidence of these behaviors during our flights.
Although habitat was not described at the point of observation, forest stands with >50% canopy closure were uncommon and flight data indicated that moose were observed in multiple habitats (e.g., hard-wood, coniferous, and mixed stands). Most forest stands were commercial and in early to mid-seral stages that provide preferred moose browse and conditions for optimal sightability. Taken in whole, the low group
size and continual observations along
transects in varied habitats support our assumption that moose were not clumped in distribution.
Table 1. Observations (n = 294), group size, and proportional frequency of group size in double-count aerial surveys of moose in 9 Wildlife Management Districts, Maine, USA, winters 2011 and 2012.
WMD
Total Observations
Group = 1 (%)
Group = 2 (%)
Group =≥3 (%)
Largest Group
Size
1 28 50.0 42.9 7.1 4
2Y1*
32 53.1 40.6 6.3 5
2Y2 30 50.0 40.0 10.0 5
3 25 44.0 44.0 12.0 4
4H12**
34 61.8 35.3 2.9 3
4H7 43 53.5 37.2 9.3 3
4H3 35 57.1 34.3 8.6 3
5 11 18.2 54.5 27.3 3
6 13 53.8 38.5 7.7 3
8 18 55.6 33.3 11.1 4
11 4 75.0 0.0 25.0 4
19 21 33.3 52.4 14.3 3
Mean ± SE
24.5 ± 3.3 50.5 ± 4.1 37.7 ± 4.0 11.8 ± 2.1
Y1* = 2011, Y2 = 2012.
Video recording during flights indicated minimal detection of moose directly under the helicopter; rather, tracks and beds were
recorded in the footage. Moose typically responded to the helicopter by moving away, thereby providing high sightability along a wide continuum of forest cover types and stand conditions. The sighting probability of single and groups of moose was moderate to high (∼70–80%) compared to other aerial techniques; Potvin and Breton (2005) found that reliable estimates could be calculated with sighting probabilities as low as 45%. Cumberland (2012) provided a complete synopsis of the performance of this technique and the relationship of sight-ing probabilities to the mark-resight model.
Trends in moose sightings by moose hunters were presented to provide context about moose abundance in northeastern Maine (Table 3). Long-term, high harvest success rates and high sighting rates provide indirect support of the density estimates reported here; in general, sighting rates and density estimates were correlated. Sighting rates by moose hunters in October serve as the most reliable and least biased index to moose abundance across the state because of high visibility due to leaf drop, and bulls are less receptive to calling and rutting behavior. While sightings by deer hunters can provide a reliable index to moose abundance (see Ericsson and Wallin 1999, Solberg and Saether 1999, Bontaites et al. 2000), loss of deer hunters in northern Maine has led to inadequate sample sizes to make inferences at the WMD level.
The estimated moose density (2.7–4.0
moose/km2) in WMDs 1–4 was moderately
high relative to many other North American populations (range 0.04–9.3 moose/km2;
Karns 2007). Population increases in the northeastern United States have been facili-tated by low predation risk, low deer
densi-ties (i.e., low transmission rates of
Parelaphostrongylus tenuis), and optimal habitat conditions (i.e., clear-cutting, wet-land habitat, farmwet-land reverting to forest) (Karns 2007). In the Cape Breton highlands
Table 2. Sighting probabilities for single and groups of moose by 2 observers (front, rear) during double-count aerial surveys in 9 Wildlife Man-agement Districts (WMD) in northern Maine, USA, winter 2011 and 2012. No difference (P>0.05) in sightability was found between the 2 observers for either single or groups of moose.
Single Group
WMD Front Rear Front Rear
1 1.00 0.79 0.86 0.68
2 0.75 0.69 0.96 0.76
2 0.63 0.91 0.97 0.94
3 0.78 0.88 0.78 0.78
4 0.68 0.94 0.84 1.00
4 0.90 0.86 1.00 0.95
4 0.47 0.67 0.84 1.00
5 0.50 1.00 1.00 0.81
6 0.60 0.60 1.00 0.85
8 0.67 0.86 0.74 1.00
11 0.67 1.00 1.00 1.00
19 1.00 0.86 0.61 0.85
Mean 0.72 0.84 0.88 0.89
SE 0.05 0.04 0.04 0.03
Table 3. Ranking of average moose hunter sighting rates (moose/10 h; 2003–2010) and density esti-mates from double-count aerial surveys of moose in 9 Wildlife Management Districts in Maine, USA, winters 2011 and 2012. Sighting rates and density estimates were correlated (P <0.05).
WMD Rank Sighting Rate Density Estimate
2 1 6.9 3.0, 3.1
1 2 5.3 2.7
5 4 4.5 1.4
4 5 4.2 2.9, 3.4, 4.0
8 7 3.9 1.7
3 8 3.7 2.7
6 10 2.7 1.2
19 11 2.0 2.4
of Nova Scotia, where predation is low and hunting is either not allowed or access is dif-ficult, moose density has been as high as 20 moose/km2 (Smith et al. 2010). Similarly,
moose density in Newfoundland has ranged from 0.80–6.13/km2 in a system where
pre-dation is low (McLaren and Mercer 2005); Timmerman and Rodgers (2005) outlined similar dynamics (i.e., low predation, mod-ern forestry, closely managed hunting) in other moderate to high moose populations. Arguably, both moderate-high population density and similar dynamics exist currently in Maine.
From a habitat standpoint, much of Maine's commercial forestlands are able to sustain and produce moderate to high moose density, and historic and current land use, moose sighting rates, and hunter success
rates support this assertion. During
1970–1980s, a widespread spruce budworm
(Choristoneura fumiferana) outbreak occurred across much of Maine's commer-cial forestlands (Department of Conservation 2005). In subsequent years, extensive sal-vage cutting increased the intensity of forest harvesting and clear-cuts, and creation of extensive road systems across the commer-cial forest landscape, utilization of smaller diameter wood, and shorter rotations all pro-duced a landscape with increased carrying capacity for moose populations. Forestry practices within northern Maine have created a widespread patchwork of early to middle seral stage forestlands characterized by small patch size (K. Legaard, University of Maine, unpublished data). While the amount of browse available during the growing season has declined since the 1990s (MDIFW data), it is unlikely that the moose population is limited by quantity or quality of habitat.
Further, annual mortality of adult moose appears to be relatively low in the absence of a significant predator and conservative hunt-ing permit allocations. The role of parasitism (i.e., Dermacentor albipictus) in overwinter
calf survival, and both the frequency and dis-tribution of winter die-offs across Maine are
unknown, but likely have measurable
influence on the population trajectory due to mortality of calves and reduced productiv-ity of yearling females as in adjacent New Hampshire (Musante et al. 2010). Overall, the estimates in all WMDs appear reasonable given the combination of these attributes, current habitat conditions, low annual mor-tality, and historic permit allocations.
MANAGEMENT IMPLICATIONS
Reliable measures of abundance are cri-tical to management of moose given their value to multiple stakeholders and the MDIFW mandate to manage species for the good of all Maine citizens. Sighting rates appear to be most useful to track temporal population changes within a WMD, but less meaningful as an indication of absolute abundance. Unlike aerial surveys, sighting rates are likely influenced by variation in habitat conditions, size and juxtaposition of forest harvest classes, and road density. Esti-mates of abundance provide a starting point
for understanding population dynamics,
determining sustainable harvest, and estab-lishing stakeholder confidence. Aerial sur-vey work is likely more acceptable and better grasped by a diverse public that often is suspicious of“bureaucracy”and weary of models and academic frameworks.
ACKNOWLEDGEMENTS
L. Kantar thanks Maine Forest Service ranger pilots C. Blackie, L. Mazzei, J. Knight, and J. Crowley, consummate profes-sionals whose dedication, expertise, and commitment kept us safe and on line. I espe-cially thank our exceptional flight crew including K. Marden, S. McLellan, A. Starr, and D. Hentosh. Without the flexibility and dedication of all these individuals this work would not have been possible. We thank Dr. P. Pekins for editorial advice and critical review.
REFERENCES
BONTAITES, K. M., K. A. GUSTAFSON, and R.
MAKIN. 2000. A Gasaway-type moose
survey in New Hampshire using infrared thermal imagery: preliminary results. Alces 36: 69–76.
CAUGHLEY, G., R. SINCLAIR, and D. SCOTT
-KEMMIS. 1976. Experiments in aerial
sur-vey. Journal of Wildlife Management 40: 290–300.
CUMBERLAND, R. E. 2012. Potvin
double-count aerial survey in New Brunswick: are results reliable for moose? Alces 48: 67–77.
DEPARTMENT OF CONSERVATION MAINE FOREST
SERVICE. 2005. The 2005 Biennial Report
on the State of the Forest and Progress
Report on Sustainability Standards.
Report to the Joint Standing Committee of the 122nd Legislature on Agriculture,
Conservation and Forestry. Maine
Department of Conservation, Augusta, Maine, USA.
ERICSSON, G., and K. WALLIN. 1999. Hunter
observations as an index to mooseAlces alces population parameters. Wildlife Biology 5: 177–185.
GAUTHIER, P., and R. E. CUMBERLAND. 2000. A
New Brunswick Manual for Aerial Sur-veys of White-Tailed Deer Populations Utilizing the Potvin Mark-Recapture Technique. New Brunswick Deer Techni-cal Report No. 5. Fredericton, New Brunswick, Canada.
KARNS, P. D. 2007. Population distribution,
density and trends. Pages 125–139. in
A. W. Franzmann and C. C. Schwartz, editors. Ecology and Management of the
North American Moose (2nd edition).
University Press of Colorado, Boulder, Colorado, USA.
MAINE DEPARTMENT OF AGRICULTURE, FOOD
and RURAL RESOURCES. 2003. Aroostook
County: 2003–2004 County Profile of
Maine Agricultural Enterprises. <http:// www.maine.gov/agriculture/mpd/farm-land/facts/aro1103.pdf> (accessed April
2010).
MAINE OFFICE OF GEOGRAPHIC INFORMATION
SYSTEM. 2004. Maine Land Cover
Data-set. <http://geolibportal.usm.maine.edu/ geonetwork/srv/en/metadata.> (accessed October 2010).
MCLAREN, B. E., and W. E. MERCER. 2005.
How management unit license quotas relate to population size, density, and hunter access in Newfoundland. Alces 41: 75–84.
MORRIS, K. I. 2002. Moose Management
System. Maine Department of Inland
Fisheries and Wildlife, Augusta,
Maine, USA.
MUSANTE, A. R., P. J. PEKINS, and D. L. S CAR-PITTI. 2010. Characteristics and dynamics
of a regional moose Alces alces
population in the northeastern United States. Wildlife Biology 16: 185–204. POTVIN, F., L. BRETON, L. RIVEST, and A. G
IN-GRAS. 1992. Application of a
double-count aerial survey technique for white-tailed deer, Odocoileus virginianus, on
Anticosti Island, Quebec. Canadian
Field-Naturalist 106: 435–442.
———, and ———. 2005. From the field:
testing 2 aerial survey techniques on deer in fenced enclosures – visual dou-ble-counts and thermal infrared sensing. Wildlife Society Bulletin 33: 317–325. QUAYLE, J. F., A. G. MACHUTCHON, and D. N.
JURY. 2001. Modeling moose sightability
RIVEST, L. P., F. POTVIN, H. CREPEAU, and G.
DAIGLE. 1995. Statistical methods for
aerial surveys using the double-count technique to correct visibility bias. Biometrics 51: 461–470.
SMITH, C., K. BEAZLEY, P. DUINKER, and K. A.
HARPER. 2010. The impact of moose
(Alces alces andersoni) on forest regen-eration following a severe spruce bud-worm outbreak in the Cape Breton
Highlands, Nova Scotia, Canada. Alces 46: 135–150.
SOLBERG, E. J., and B. E. SAETHER. 1999.
Hunter observations of moose, Alces
alces, as a management tool. Wildlife Biology 5: 107–117.
TIMMERMAN, H. R., and A. R. RODGERS. 2005.