University Students’
Perceptions of Social
Media as a Learning Tool
Laila Al-Sharqi & Khairuddin Hashim
Abstract
This study aims to investigate university students’ percep-tions of social media as a learning tool. Data were collected using a specially designed survey during the academic year 2013/2014 at King Abdulaziz University (KAU). The sample size was 2,605 students of different ages and gen-ders representing various KAU colleges. The results indi-cate that a moderate majority of KAU students are using social media tools in their learning and have the desire to integrate social media as a tool in their learning at univer-sity. The paper also reports gender significant differences
on preferred social media tools and purposes of social me-dia usage. The findings support the advantages of social media in learning and do not indicate any obvious disad-vantages. Such findings can encourage academic planners and instructors to adopt and implement social media tools in the learning context.
I
n recent years, social media tools such as Facebook, Twitter and YouTube have become increasingly popular, particularly with college students. Excessive use of these tools has led to debate over whether or not it has changed the very shape andstructure of students’ social behavior and academic practices, and has thus caused leading educators to rede-fine their understanding of interpersonal communication and study dynamics (Junco, Merson, & Salter, 2010).
Students use social media tools for many purposes such as access to information, group discussion, resource sharing and entertainment (Wang, Chen, & Liang, 2011). This has generated speculation on their use and possible positive and negative implications, in both the short and the long terms. As several studies demonstrate, social media interaction could have positive and negative effects on students. They can provide flexibility in learning, stimulate innovative ideas, and increase interpersonal relationships among students and instructors. These tools, however, can have negative impacts on students as they might distract their attention from the learning process, reduce their physical social interaction and be potentially addictive.
many types of social media on a daily basis. Abdelraheem (2013) investigated undergraduate students’ use of social networks sites (SNSs) and the relation to gender, grade point average (GPA) and other variables. Analysis of re-sponses of 120 students revealed that students use these sites for social purposes more than academic ones. Al-shareef (2013) examined the effects of Web 2.0 and social networks on students’ performance in online education at KAU. Using data from 100 students obtained through an electronic questionnaire, the study found a significant positive impact of social learning on the students’ educa-tion compared with tradieduca-tional teaching.
A study exploring the perceptions of university fac-ulty members for using social media in formal and infor-mal learning (Chen & Bryer, 2012) indicated that most of the studied population used Facebook for personal commu-nication and LinkedIn for professional purposes. It also found that academic activities using social media were de-signed to be informal reinforcements to classroom teaching rather than conventional assessment tools.
non-academic purposes, but that high use of SNSs did not adversely affect students’ academic performance, appar-ently because students were managing their time effi-ciently.
Junco et al. (2010) studied the effect of using Twit-ter for various types of academic discussion on the engage-ment and grades of college students. The study examined 125 students (70 in the experimental group and 55 in the control group) using a 19-item scale selected from the Na-tional Survey of Student Engagement (NSSE). The au-thors found that Twitter can motivate both students’ and faculty’s engagement in non-traditional learning activities. In the same vein, Ellison, Steinfield and Lampe (2007) as-serted that Facebook can facilitate college students’ aca-demic learning objectives through instructor-to-student and student-to-student course communication e.g. re-sponding to questions and managing out-of-class projects.
Liu (2010) studied students’ use, attitudes and per-ceptions of 16 different social media tools through an online questionnaire involving 221 students. The top four reasons that prompted students’ use of social media tools were found to be social engagement (85%), direction com-munications (56%), speed of feedback/results (48%), and relationship building (47%); less than 10% used social me-dia tools for academic purposes.
and perception of the impact of social media on their learn-ing. A research questionnaire was designed to determine the factors that may have affected students in relation to age, gender and college. Through analysis of the data, the study attempts to detect the positive and negative impacts on the academic community's preferences, perceptions and social behavior, and to identify key themes, trends or per-ceptions that can be used as a foundation for more in-depth research.
The main contribution of the study lies in identify-ing students’ usage and perception of social media as a learning tool that can help in adoption of social media tools in the learning context. Given the present limitation of available data on students’ use of social media at the university level, the data gathered provide a valuable source of information, as they offer a deeper insight into students’ association with the new media.
Method
This study used both primary and secondary sources of data. The secondary data were from the litera-ture review described above. The primary data were col-lected through a questionnaire administered to randomly selected respondents representing a sample of university students from various academic disciplines of KAU. The research team designed and fine-tuned the survey instru-ment, and conducted a workshop to obtain the opinion of administrators, instructors and students on which topics to include. This study is part of a research project ap-proved by the university's research arm.
various colleges of KAU. The target students represented a homogeneous mix (male or female), different age groups (20 years and older or younger than 20 years of age) and disciplines to sufficiently preserve optimal diversity within the collected data required for subsequent analysis.
The questionnaire was pre-tested on a number of university students from various majors. The question-naire was then revised by several senior university faculty members, who, specializing in sampling and questionnaire design, made modifications to enhance clarity. The ques-tionnaire was then pilot tested, using a version that con-tained the questions in both English and Arabic guages, to provide a survey questionnaire in dual lan-guages for ease of understanding. Based on the target numbers, copies of the questionnaire were then distributed to students by college administrators trained to facilitate data collection.
The questionnaire was divided into four parts. In the first part, students were requested to respond to gen-eral and demographic questions about their gender, age, and field of specialization. Students were also asked about their level of association with the Internet and social me-dia use. The second part provided more specific questions on the types of social media students’ use, the purpose for which they use social media, availability of social media platforms at the university, and their preference on the integration of social media in learning. The third part ad-dressed questions related to students’ perspectives on the benefits of social media use in learning. While the fourth part focused on their views on the negative aspects related to social media use in learning.
to coordinators. A statistician was engaged to ensure that processing of data was done properly. Data were coded and processed into SPSS, a statistical package system. The data were explored both for their descriptive statistics (i.e. calculation of percentage distributions, frequency distribu-tions, calculations of averages, and coefficient of variation) and inferential statistics (i.e. level of significance, t-test, z-test, ANOVA, correlation and regression and classification analysis). Cronbach's alpha was also used to provide indi-cations of the reliability of measurement scales.
Analysis
The total sample size of 2,605 students meant an acceptable error of ±4% at 95% confidence level for the university student population. In
investigating significant difference, the Pearson chi-square test of independence is used. If chi-chi-square results are significant, post-hoc analysis is then conducted for identifying significant differences at the 0.05 level through column proportions z-tests approach. Researchers adjusted p-values for the multiple comparisons using the Bonferroni method (Sheskin, 2011).
Sample Breakdown Based on Demographic Factors Table 1 shows the sample breakdown according to the demographic variables considered. The two highest percentages were students studying arts and media
Table 1
Sample breakdown based on demographic factors
College Count Gender
Age (Count) Total per gen-der % of gender per to-tal sample size Youn ger than 20 20 or older
Engineer-ing 10.17%265
Male 39 179 218 8.37
Female 22 25 47 1.8
Science, IT
and Seas 11.48%299
Male 49 116 165 6.33
Female 35 99 134 5.14
Environ-mental, weather and earth sciences* 183 7.02%
Male 59 124 183 7.02
Female 0 0 0 0
Art and
media 18.31%477
Male 56 109 165 6.33
Female 25 287 312 11.98
Public
health 9.1%237
Male 33 103 136 5.22
Female 33 68 101 3.88
Economics 17.31%451
Male 57 155 212 8.14
Female 16 223 239 9.17
Home
Econ* 2.76%72
Male 0 0 0 0
Female 14 58 72 2.76
Education 8.37%218
Male 38 135 173 6.64
Female 12 33 45 1.73
Language and pre college
403 15.47%
Male 147 19 166 6.37
Female 179 58 237 9.1
Total 2,605 100%
Male 478 940 1418 54.43
Female 336 851 1187 45.57
(68.8%) were aged 20 years and older. The sampled gender and age cohorts provide a consistent representative sam-ple of the ratios of the overall KAU student population.
KAU Students’ Background on the Internet and Social Media
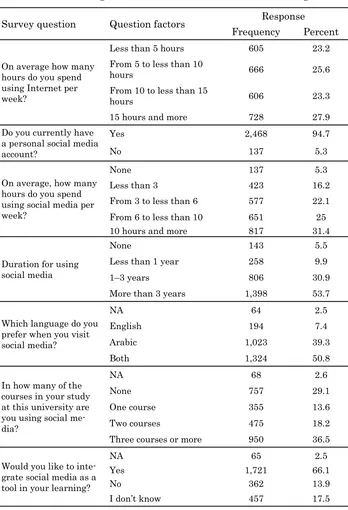
The survey included some questions designed to provide information about KAU students’ background in using the Internet and social media. These questions are shown in Table 2, together with their corresponding re-sponses. The responses indicated that KAU students are familiar with and are immersed in the Internet and social media use. The majority of students use the Internet for more than 10 hours per week, have social media accounts for at least one year, access them for at least 6 hours per week and feel confident in their skills in dealing with so-cial media. More than half of the students prefer to use social media in both Arabic and English languages. A mod-erately high majority of students use social media in their studies for one or more courses at KAU, with a similar proportion wanting to integrate social media as a tool in their learning at university.
KAU Students’ Preferred Social Media Tools
me-Survey question Question factors Response Frequency Percent
On average how many hours do you spend using Internet per week?
Less than 5 hours 605 23.2 From 5 to less than 10
hours 666 25.6 From 10 to less than 15
hours 606 23.3 15 hours and more 728 27.9 Do you currently have
a personal social media account?
Yes 2,468 94.7 No 137 5.3 On average, how many
hours do you spend using social media per week?
None 137 5.3 Less than 3 423 16.2 From 3 to less than 6 577 22.1 From 6 to less than 10 651 25 10 hours and more 817 31.4 Duration for using
social media
None 143 5.5 Less than 1 year 258 9.9 1–3 years 806 30.9 More than 3 years 1,398 53.7 Which language do you
prefer when you visit social media?
NA 64 2.5 English 194 7.4 Arabic 1,023 39.3 Both 1,324 50.8 In how many of the
courses in your study at this university are you using social me-dia?
NA 68 2.6 None 757 29.1 One course 355 13.6 Two courses 475 18.2 Three courses or more 950 36.5 Would you like to
inte-grate social media as a tool in your learning?
NA 65 2.5 Yes 1,721 66.1 No 362 13.9 I don’t know 457 17.5
Table 2
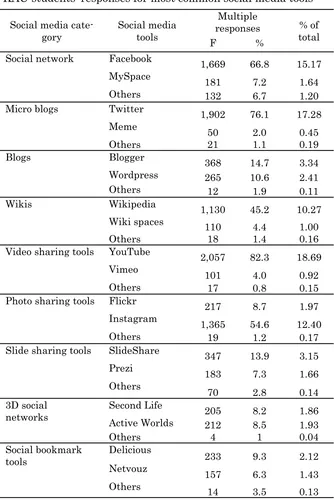
Social media
cate-gory Social media tools
Multiple
responses % of total
F %
Social network Facebook 1,669 66.8 15.17
MySpace 181 7.2 1.64
Others 132 6.7 1.20
Micro blogs Twitter 1,902 76.1 17.28
Meme 50 2.0 0.45
Others 21 1.1 0.19
Blogs Blogger 368 14.7 3.34
Wordpress 265 10.6 2.41
Others 12 1.9 0.11
Wikis Wikipedia 1,130 45.2 10.27
Wiki spaces 110 4.4 1.00
Others 18 1.4 0.16
Video sharing tools YouTube 2,057 82.3 18.69
Vimeo 101 4.0 0.92
Others 17 0.8 0.15
Photo sharing tools Flickr 217 8.7 1.97
Instagram 1,365 54.6 12.40
Others 19 1.2 0.17
Slide sharing tools SlideShare 347 13.9 3.15
Prezi 183 7.3 1.66
Others
70 2.8 0.14
3D social
networks Second LifeActive Worlds 205 8.2 1.86
212 8.5 1.93
Others 4 1 0.04
Social bookmark
tools Delicious 233 9.3 2.12
Netvouz 157 6.3 1.43
Others 14 3.5 0.13
Table 3
dia category has the highest usage level. Social networks and microblogs are next, followed by photo sharing tools. Fewer students use other options such as slide sharing tools, 3D social networks, and social bookmarks. Figure 2 shows the top 10 most commonly used social media tools across all categories. The survey question was of multiple response type. The figure shows the distribution on re-sponse of students in descending order of social media tool usage. It illustrates the video sharing tool YouTube as the most popular (82%), followed by the microblog Twitter (76%), the social network Facebook (67%) and the photo sharing tool Instagram (55%).
The value of the Pearson Chi-Square relating to the top ten social media tools of Figure 3 is significant at p less than 0.01. Hence, there exists a strong association be-tween the social media tools and gender. Post-hoc analysis indicates that there is greater proportion of responses by the male students than the female students in the
‘Facebook’ category and that the difference is significant at the 0.05 level. For YouTube, Instagram and SlideShare tools, there are greater proportions of responses by the fe-male students than the fe-male students and that these dif-ferences are significant at the 0.05 level.
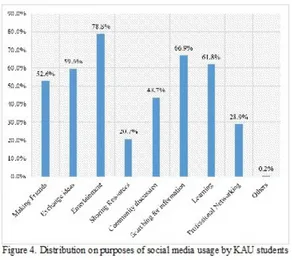
Purposes on Usage of Social Media
stu-dents sample as per the most common purposes. The sur-vey question was a multiple response type. The figure re-veals that KAU students use social media tools for a blend of academic and non-academic purposes. Category
‘Entertainment’ represents the highest category with 79 percent usage level. The second highest is category ‘Information searching’ with 67 percent and the third highest is category ‘Learning’ with 62 percent.
The value of the Pearson Chi-Square relating to the eight categories of Figure 5 is significant at p less than 0.01. Hence, there exists a strong association between pur-poses of social media usage and gender. Post-hoc analysis indicates that the proportion for the male group is larger than the proportion for the female group for categories of ‘Making friends’ and ‘Sharing Resources’ and that these differences are significant at the 0.05 level. For all the other categories except the category ‘Community discus-sion,’ the proportions of the female group are larger than the proportion of the male group and these differences are significant at the 0.05 level.
Evaluating KAU Students’ Perceptions on Social Media in Learning
The remaining portion of the questionnaire was de-signed to investigate KAU students’ perceptions regarding the following: a) rating 19 statements as benefits
(advantages) that encourage the use of social media for learning; and b) rating 11 statements as problems (disadvantages) that prevent students from using social media for learning. The study factors results are reliable, with Cronbach’s alpha values of greater than 90 percent: .957 for advantages (19 items) and .909 for disadvantages (11 items).
of 3.00)—represents “unsure”) of using social media in learning. The mean value for factor advantages is of atti-tude ‘Agree’ while the mean value for factor disadvantages is of attitude ‘Unsure’. This indicates that students agree with the advantages but are unsure of the disadvantages.
Investigating dominant issues on advantages of us-ing social media in learnus-ing. Out of the items under each
Table 4
Sub-factors on advantages of using social media in learning
1. Help me exchange opinions regarding subjects 2. Learn collaboratively with others
3. Make my learning more convenient 4. Improve my group-problem solving skills 5. Improve my interaction with my classmates 6. Improve my communication with instructors 7. Help me co-create knowledge
8. Help me increase my leadership skills 9. Help me become an independent learner 10. Makes my learning more interesting 11. Help gain more info on different subjects 12. Make learning more competitive
13. Give better chance for access new to resources 14. Improve ability to be creative and innovative 15. Broaden my global views of world issues 16. Improve my research skills
17. Help me in taking initiatives
factor, we selected the top five perceptions by mean values. These help identify support factors in using social media as a learning tool. The summary for perceptions on advan-tages is given in Table 6. Students believe that they are able acquire more information and have access to learning resources through the use of social media in learning. They also believe that through the use of social media in learning, they are able to co-create knowledge, communi-cate better with instructors and improve their research skills.
Investigating dominant issues on disadvantages of using social media in learning. Out of the items under each factor, we selected the top five perceptions by mean values. These help highlight potential problems in using social media as a learning tool. The summary for
percep-Table 5
Sub-factors on disadvantages of using social media in learning
1. Cause intrusion on my privacy 2. Cause misuse and domination 3. Raise my parents’ concerns 4. Require formal training
5. Require more work and preparation 6. More time consuming
7. Difficult to manage learning activities
8. Raise concerns over direct contact with instructors 9. Distract me from studying
tions on disadvantages is given in Table 7. It is interesting to note that the top two concerns relate to addictiveness and distraction, respectively. The next two concerns relate to expectation of additional effort required when using so-cial media in learning while the last concern highlights the need for appropriate training, perhaps to formalize the use of social media for learning.
Discussion
The findings on students’ background on the Inter-net and social media reflect the maturity of KAU students regarding use of the Internet and social media. It also agrees with findings from previous studies (Alshareef, 2013; Pempek, Yermolayeva & Calvert, 2009). Pempek
Table 6
Top 5 perceptions on possible benefits (advantages) on the use of social media in learning
Advantages (in
descend-ing order) Mean CV (%) Percep-tion
Help me gain more infor-mation on different
sub-jects 3.98 24.7 Agree
Gives me better chance
to access new resources 3.92 25.2 Agree Help me co-create
knowl-edge 3.90 25.1 Agree
Improve my
communica-tion with my instructors 3.89 27.5 Agree
Improve my research
and colleagues found that college students' social network-ing experiences are high especially on Facebook. The study conducted by Alshareef (2013) on the effects of Web 2.0 and social networks on students’ performance in online education in KAU showed a good level of experience in us-ing social media.
As to students’ preferred social media tools with YouTube as the most popular (82%), followed by the mi-croblog Twitter (76%) and then the social network Face-book (67%), our finding is in contrast to findings of a re-cent survey (Guimaraes, 2014) conducted where Facebook remains the top social network for the U.S.
Pertaining to gender breakdown and significant differences on social media tools, some differences in the
Table 7
Top 5 perceptions on possible problems (disadvantages) on the use of social media in learning
Disadvantages (in descending
order) Mean (%)CV Percep-tion
Increase my additive potential 3.39 37.8 Unsure
Distract me from studying 3.24 38.9 Unsure
Be more time consuming than
the topic is worth 3.21 38.1 Unsure
Require more work and
prepa-ration 3.06 37.6 Unsure
proportion of responses are witnessed. As with Facebook, the male students proportion is 77 percent and female stu-dents proportion is 56 percent. Furthermore, Facebook does not take a position at the top three categories of the female group. These findings are in contrast with findings of the survey (Guimaraes, 2014) on adoption of social net-work which state that women in the U.S. are more skewed to Facebook than men by about 10 percentage points.
Pertaining to purposes of using social media, it is worth noting that the responses for searching for informa-tion and learning are both above 60 percent. This indicates a moderately high percentage of students use social media for learning. A further investigation reveals that a high percentage (77%) of students represent the union set of learning and searching for information. This combination can be classified under the activity of learning and repre-sents a proportion close to that of the highest category un-der purposes on usage of social media. These findings are in contrast to the conclusion made by Ahmed and Qazi (2011), which states that social network sites are mainly used for non-academic purposes by students.
Re-sources’ and that these differences are significant at the 0.05 level. The finding of males being in favor of the cate-gory ‘Making friends’ is in line with the outcome of study conducted by Mazman and Usluel (2011) which states that males are more dominant in using social media for making new contacts compared to females.
On the investigation of dominant issues pertaining to disadvantages of using social media in learning, the concern of being addicted highlighted as the top concern in our survey has also been highlighted by Thompson and Lougheed (2012).
The study is limited to students of KAU. For future research work, replication of the study in different settings will allow for comparisons and significant differences to be examined.
Conclusions
learning. This combination represents a proportion very close to that of the highest category.
Students positively agree on the advantages of so-cial media as a learning tool. However, they are unsure about its disadvantages. On gender significant differences, survey outcomes indicate that the female students group has a stronger inclination toward usage of social media for learning compared to its male counterpart. This finding can help in strategizing piloting options for adoption and phased implementation of social media tools at KAU in the learning context.
References
Abdelraheem, A. Y. (2013, 14–16 January 2013). University Students' Use of Social Networks Sites and their Relation with Some Variables. Paper presented at the WEI International Academic Conference, Antalya, Turkey.
Ahmed, I., & Qazi, T. (2011). A look out for academic impacts of social networking sites (SNSs): A student based perspec-tive. African Journal of Business Management, 5(12), 5022–5031.
Alshareef, M. (2013). Evaluate student satisfaction for social learning network at King Abdulaziz University.
Advances in Internet of Things, 3, 41–44.
Chen, B., & Bryer, T. (2012). Investigating instructional strate-gies for using social media in formal and informal learn-ing. The International Review of Research in Open and Distance Learning, 13(1).
Guimaraes, T. (2014). Revealed: The demographic trends for every social network. Retrieved from http://
www.businessinsider.com/2014-social-media-demographics-update-2014-9.
Junco, R., Merson, D., & Salter, D. W. (2010). The effect of gen-der, ethnicity, and income on college students' use of communication. Cyberpsychology, Behavior and Social Networking, 13(6).
Liu, Y. (2010). Social media tools as a learning resource. Journal of Educational Technology Development and Exchange, 3(1), 101–114.
Mazman, S. G., & Usluel, Y. K. (2011). Gender differences in using social networks. Turkish Online Journal of Educational Technology, 10(2), 133-139.
Pempek, T. A., Yermolayeva, Y. A., & Calvert, S. L. (2009). College students' social networking experiences on Facebook. Journal of Applied Developmental Psychology, 30(3), 227–238.
Sheskin, D. J. (2011). Handbook of Parametric and Nonparamet-ric Statistical Procedures. Boca Raton, Florida: Chap-man and Hall/CRC.
Thompson, S. H., & Lougheed, E. (2012). Frazzled by Facebook? An exploratory study of gender differences in social network communication among undergraduate men and women. College Student Journal, 46(1), 88-98.
Valjataga, T., Pata, K., & Tammets, K. (2011). Considering stu-dents’ perspectives on personal and distributed learning environments in course design: Applying social informat-ics for tertiary teaching. In Information Science
Reference. New York: Hershey.