https://doi.org/10.3926/jiem.2518
A Proposal for a Green Supply Chain Strategy
Carola Pinto Taborga , Amaia Lusa , Anna Maria Coves Universitat Politècnica de Catalunya (Spain)
cpintotaborga@gmail.com, amaia.lusa@upc.edu, anna.maria.coves@upc.edu
Received: November 2017 Accepted: March 2018
Abstract:
Purpose: The purpose of this paper is to establish a set of steps for helping companies to create a Green Supply Chain Strategy based on the reduction of their carbon footprint. The aim is to put forward a simple guideline that companies can follow and guide them in achieving their carbon emission targets, as well as obtaining attractive supply chain savings.
Design/methodology/approach: Based on a literature review and benchmarking this paper proposes a methodology based on three pillars: 1) Corporate Carbon Strategy; 2) Carbon emission roadmap; and 3) Implementation and tracking. Analytic Hierarchy Process (AHP) techniques were used in order to create a green strategy and support the decision-making processes to select the most interesting alternatives for carbon emission reduction and supply chain savings. The supply chain of a metallurgical company is used to illustrate the case study where the proposed methodology is used. The criteria used for the carbon alternatives selection was based on three factors: 1) the supply chain cost of the alternative; 2) carbon emission impact in terms of CO2 tonnes; and 3) marketing effect.
Findings: The paper identifies some specific steps for developing a Green Supply Chain Strategy. The case study developed, demonstrates the importance of following a proper methodology based on a set of steps, it also demonstrates that some alternatives focus on improving the supply chain, such as the facilities location, can also improve the key performance indicator related with carbon emission.
Originality/value: The study provides guidance for manufacturing companies in implementing their Green Supply Chain Strategy.
Keywords:green supply chain, carbon dioxide emissions, ahp, green supply chain management
1. Introduction
Global climate change is one of the most controversial and complex topics that society is confronting today and its impact on industry is currently important but will soon be enormous. In order to deal with this critical situation, a climate change accord, “The Paris agreement”, was signed by nearly 200 countries in December 2015; the agreement came into force in November 2016. The main point of the Paris agreement is to keep global warming below 2ºC and it encourages world leaders to have a long-term goal for net zero emissions, which would effectively phase out fossil fuels.
Understanding the role of industry in the climate change, the business community is also supporting the Paris Climate Agreement. The last Conference of Parties (COP22) had the contribution of 350 companies, all of them reiterating their strong support for the Agreement. Companies are thinking more and more about emitting less CO2
overheads. Moreover, endorsing a carbon strategy can promote a competitive advantage and help them stand out against their competitors. According to some research (Carbon Trust, 2012), over 65% of consumers think that it is important to buy from environmentally responsible companies, which means that it can be taken as a very good marketing strategy.
Certainly, the concept of climate change is generating actions at governmental and business level; therefore, companies need to adapt their strategy and use this trend to generate a competitive advantage. Consequently, there is a need to support companies and decision makers in this field.
Some guidance and standards have been developed to help companies to design effective strategies for reducing carbon emissions. One of these tools is the GHG Protocol (WBCSD/WRI, 2004) and another is ISO 14064 (International Organization for Standardization, 2006) which is coherent and compatible with the GHG Protocol. In general terms, ISO 14064 identifies the “What” and the GHG Protocol the “How” and “Why”. ISO 14064 is oriented towards audits, while the GHS protocol is oriented towards providing a set of options for reducing carbon emission. Moreover, Life Cycle Analysis (LCA) methodology is useful for evaluating the environmental impact associated with a product, process or activity (Franchetti & Apul, 2012).
In general, in this context, there are two main schools of research: the first one considers the LCA evaluation, where the total environmental footprint (in terms of CO2 emissions) of a product or a service is considered; the
second approach, normally based on GHG protocol, aims to quantify the carbon footprint of an organisation, rather than a product or a service itself. Due to the nature of this guidance an organizational level approach, based on the GHG protocol, is taken.
The involvement of the scientific, political, economic, and social communities in environmental issues is increasing steadily. Simultaneously, companies are changing their traditional way of viewing the supply chain and are including the green concept within their Supply Chain and creating a new concept, the “Green Supply Chain” (GSC). Environmental factors in supply chain design have become a focus research in recent years. Studies have analysed the implications of different transportation types regarding GHG emissions (Pan, Ballot & Fontane, 2013), as well as of energy-saving technology (Wang, Xiaofan & Shi, 2011) in both transportation and production. The concept Green Supply Chain has recently appeared to include the environmental factor in supply chain design.
Together with the GSC the Green Supply Chain Strategy is arisen. A Green Supply Chain Strategy (GSCS) is defined as a long-term action plan that integrate environmental thinking into supply-chain management to create a competitive advantage (Kumar, Teichman, & Timpernagel, 2011). The GSCS can include topics related with water, waste and carbon emission, nevertheless this paper is specially focus on improving the carbon emission indicator.
The GSCS creation can represent a challenge for a company and can arise with some questions, such as: How to design a GSCS? How to integrate the environmental decisions into the supply chain strategy? How to define a long-term green target? What kind of resources are needed? How can developing a GSCS give us a competitive advantage? What are the monetary and non-monetary benefits of developing a GSCS?.
As soon as a company has defined its GSCS some strategies and targets are established, normally a second set of questions arises, for instance: How to reach the Carbon Reduction targets? What kind of initiatives are needed? When should these initiatives be implemented?.
The standards and guidance already established are useful for helping in the definition of some part of the GSCS. For instance, GHG protocol is useful for defining reporting principles, determining boundaries and setting GHG targets, whilst the PAS 2050 Guide helps in assessing the life cycle carbon footprint of products and identifying emission reduction opportunities. Nevertheless, neither the GHG Protocol nor PAS 2020 Guide have a formalized guide for creating a carbon strategy and helping companies to achieve the carbon reduction targets.
Supply Chain Strategy. It provides step by step guidance, starting with the assessing and finishing with the tracking of results. The aim is to take advantage of the benefits of green growth and use it for marketing and to gain a competitive advantage.
The rest of the paper is organized as follows: Section 2 includes a brief literature review; Section 3 proposes a methodology for carbon reduction; in Section 4 a case study is presented; finally, Section 5 includes the main conclusions and recommendations.
2. Literature Review
Supply Chain is defined as a set of processes where different stakeholders (i.e. suppliers, factories, distributors and retailers) work together to convert raw materials into final product ready to be delivered to customers and eventually collect the end of use products for reuse, remanufacture or recycle purposes (Damert, Arijit & Ruoert, 2017). Within the Supply Chain two big processes can be defined 1) the Production Planning and Inventory Control Process, and 2) the Distribution Process, both working in a synchronized manner.
More than a physical flow the supply chain encompasses all the activities associated with the flow and transformation of goods from raw materials stage (extraction), through to the end user, as well as the associated information flows. Material and information flow both up and down the supply chain. “Supply Chain Management (SCM) is the integration of these activities through improved supply chain relationships to achieve a sustainable competitive advantage’’ (Handfield & Nichols, 1999).
A supply chain is traditionally designed based on the economic objectives (cost minimization, sales maximization) (Pinto-Varela, Barbosa-Póvoa & Novais, 2011), but due to the societal environment concerns are increasing and every supply chain is part of the global society (Chaabane, Ramudhin & Paquet, 2010), then a supply chain should be evaluated also based on the environmental objectives (carbon emissions, recycling performance, waste management and energy use), and the social performances (quality of life, noise, etc.).
Sustainable development is defined as a “development that meets the needs of the present, without compromising the ability of future generations to meet their own needs" (WCED, 1987). Since a supply chain has a strong link with the society, an integrated approach linking these three pillars (economic, environmental and social) is needed.
A Sustainable Supply Chain includes objectives related with sustainable development, economic, environmental and social (Seuring & Müller, 2008). A supply chain interacts with other stakeholders like customer and suppliers, which are belong to other supply chain themselves. Therefore, a well implemented Sustainable Supply chain strategy will also impact in customer and suppliers, then all the stakeholders will contribute to create an extended sustainable supply chain.
Green Supply Chain Management (GSCM) is a piece of the sustainable supply chain where environmental thinking is integrated into supply chain management (Srivastava, 2007) and it includes supplier’s selection, product design, manufacturing process, warehousing and transportation and end-of-life of the product.
Different authors such as Cordero (2013), Pinto and Coves (2014) and Dasaklis and Costas (2013) have made a general review of the relevant literature and current methodologies for carbon reduction into the Supply Chain and, based on a systematic categorization of the findings, they have identified carbon reduction opportunities. In addition, a set of guidelines for carbon reduction is listed in the Carbon Trust (2012) and authors such as Hoffman (2005) have proposed a Climate Change Strategy for companies including guidelines for Voluntary Greenhouse Gas Reductions.
(Trotta, 2010). The third pillar involves investment in New Technologies such as Combined Heat and Power (CHP) (Bianchi & De Pascale, 2012) or Biomass.
Research by Vujanovića, Čučekb Lidija and Zdravko (2014) highlighted energy management as the fourth pillar; it can impact on manufacturing but also on any other facility of the supply chain. The use of renewable energy sources helps to mitigate the effects of climate change and ensures that no net greenhouse gases are released.
Carbon Trust (2012) revealed a guideline for properly selecting the type of the renewable energy. The guideline proposes considering the importance of assessing the type (electricity, heat) of energy used, including the fluctuation of the energy demand per season and during the day, as well as the quantity of renewable energy needed. As soon as an energy technology is identified, a feasibility study needs to be carried out to assess the technical, economic and environmental performance. Wind power, solar electricity, biomass and anaerobic digestion are just examples of the renewable energies currently available.
Research by Hashim, Nazam, Yao, Baig and Zia-ur-Rehman (2017) showed the importance of incorporating an environmental objective into the conventional supplier selection. Along the same lines, Opetuk, Zolo & Dukic. (2010) demostrated how to work closely with suppliers and leverage the procurement agreements to create a long term carbon strategy. Some criteria such as type of energy used, CO2 performance certificates, longevity of
breeding stock, waste management methods or the use of artificial fertilizers can be included in the procurement negotiations.
Opportunities in the transportation area are also important in a Green Supply Chain Strategy. The use of different transportation modes can be an excellent option for reducing carbon emissions, which can include a combination of rail-road (Lee Lam, 2014) or water-road, included in the Li, Xu and Liu (2013) research.
On the other hand, vehicle design and fuel consumption play a key role in the transport sector and directly affects GHG emissions. Research by Wu & Dunn (1995) explained how to use different alternative fuels (Emulsified Diesel, Biodiesel, Natural Gas, Propane, Ethanol-Diesel Mix) and the later research by Günther, Kannegiesser & Autenrieb (2015) and Ajanovic & Haas (2015) showed how the use of electric vehicles can significantly reduce vehicle carbon emissions, especially if compared with diesel combustion.
Finally, the opportunity for carbon emission reduction in warehousing is related with the location (Wang, Zhu & Jeeva, 2013), the energy management and the storage equipment. Authors like Tian and Yang (2013) highlighted the importance of the characteristics of energy consumption in companies’ logistics processes.
Several authors have contributed to the GSCS field, but most of them are focused on some specific areas, while other authors are dedicated to a general compilation of them all. Additionally, previously established guidelines such as GHG protocol or PAS 2050 define a strategy for carbon reduction, but do not include a methodology for selecting carbon reduction alternatives.
So far, most management research has focused in the carbon reduction and the climate change mitigation using different methodologies based on mathematics tools, research hypotheses or case studies. But the term corporate carbon strategy is defined by (Damert et al., 2017) as “a complex set of actions to reduce the impact of a firm's business activities on climate change and to gain competitive advantages over time”.
For (Busch, Lehmann & Hoffmannet, 2012), a “carbon management strategy” is any corporate firm’s effort to reduce the impact on climate change, whilst (Kolk & Levy, 2001) mentions that a “climate strategy” is based on the selection of various strategic carbon options and for (Cadez & Czerny, 2016) a “climate change mitigation strategy” stand on the application of the right carbon practices.
Moreover, (Okereke & Russel, 2010) comment that a “corporate climate strategy” links the possibility to achieve market gains but also to keep political influence. Creating a social-political strategy can also avoid future problems, indeed for (Jeswani, Wehrmeyer & Mulugetta, 2007) a “business response to climate change” is basically the degree of proactivity that a company has in response to the climate change mitigation.
Notwithstanding when a company pretends to develop a “carbon management strategy” the major bottlenecks are the short-term mindset specially focused in the profit maximization (Slawinski, Pinkse, Busch & Baner, 2015). This approach is normally in conflict with a long-term strategy which includes the carbon reduction. Therefore, how to accommodate the carbon reduction long-term strategy into the short-term goal, is crucial for the success of the mitigation strategies. Indeed, the short term and long-term connection is a prerequisite for any realistic assessment of the carbon strategy effectiveness.
(Damert et al., 2017) recommend that a corporate carbon strategy should be based on three objectives: 1) carbon governance; 2) carbon reduction; and 3) carbon competitiveness. Their conclusion mentions the “talking before walking” argument as an explanation for the missing link between carbon governance and carbon reduction activities.
According to (Montabon, Sroufe & Narasimhan, 2007) a key aspect of carbon reduction strategies is their effectiveness of delivering the desired impacts in the long-term; this contribution is seconded by (Mintzberg, 2000) who concludes that a carbon reduction strategy is not mere words but words that must be translated into actions.
The existing literature regarding business strategy and climate change investigations of corporate GHG mitigation strategies and their impact on corporate carbon performance are limited. Moreover, the available works does not integrate financial elements into climate change mitigation plans. Besides there is a lack GSCS where techniques such as Multiple Criteria Decision-Making integrate for creating a robust climate mitigation strategy.
Multiple criteria decision-making is a very useful technique for supporting the subjective evaluation of performance criteria by decision-makers (Mardani, Jusoh, Nor, Khalifah, Zakwan & Valipour, 2015). MCDM methods cover a wide range of quite distinct approaches. MCDM has increased its application in the last decades and it has become very used in environmental, socio-economic, technical and energy planning (Al-Barqawi & Zayed, 2008).
One the most frequently MCDM method used is the Analytic Hierarchy Process (AHP), in this method a numerical score for each alternative is selected for obtaining preferences of importance regarding to the criteria (Saaty, 1988). The main advantages of this method consist in the possibility to use quantitative and qualitative criteria, besides there is a good traceability due to the ordered process of the decision making.
Motivated by the research gaps outlined above, this paper aims at contributing to a better understanding of the developing of a GSCS focused in a corporate carbon reduction. Specifically, this study aims at analysing the following: 1) proposing a step by step guideline to create a carbon Green Supply Chain Strategy; 2) showing how to create a roadmap where the long-term plans related to carbon reduction are allocated; and 3) demonstrating how a multiple criteria decision-making technique can support the creation of long term plan.
3. Green Supply Chain Strategy
The proposed Green Supply Chain Strategy, depicted in Figure 1, consists of three stages: 1) the definition of a Corporate Carbon Strategy (CCS); 2) the road map creation; and 3) the implementation, tracking and regular review of the results. Each of the stages is detailed in the following subsections.
3.1. Definition of a Corporate Carbon Strategy
Figure 1. The three pillars of the Green Supply Chain Strategy
Figure 2. The six steps of the Green Supply Chain Strategy (Based on GHG protocol)
The fourth step is to determine the carbon reduction goals, based on the results of the previous step. Next, the potential carbon emission reduction opportunities should be identified and the final step would be to decide if the company should participate in voluntary GHG programs or carbon markets (A market created for the trading of carbon emission allowances to help companies to limit their carbon emissions).
This CCS breaks the approach down into easy-to-follow sections. The next sections include an explanation of every stage.
3.1.1. Identifying the Type of Emissions
The carbon dioxide equivalent (CO2e) is the single unit used to measure different greenhouse gases. Nevertheless,
depending on its activity or products a company can cause emissions of one or more greenhouse gases (Carbon dioxide (CO2), Methane (CH4), Nitrous Oxide (N2O), Fluorinated gases). Therefore, the first step towards
managing a carbon strategy is to understand which kind of emissions are linked with the activity of the company.
3.1.2. Scope Definition
According to the GHG protocol there are two types of boundaries that a company needs to define; the first one is the organizational boundary, divided into equity share approach and control approach. The second boundary is the operational one, and it is generally divided into two categories: direct and indirect emissions.
Operational boundaries are important for delimitating the scope and identifying where reductions should take place. Direct emissions or Scope 1 are from sources owned or controlled by the company (emissions from combustion in owned or controlled boilers, furnaces, vehicles, etc).
comprising business travel, third-party distribution and logistics, production of purchased goods and emissions from the use of sold products.
3.1.3. Determining a Carbon Emission Baseline
Once the organizational and operational boundaries are defined a company should establish a base year and start to measure its emission reduction. This stage should include defining the procedure for calculating the carbon emission per area and establishing which carbon emission factors need to be used. A performance information includes understanding and evaluating the current performance and then planning the future emissions and the capital expenditure.
3.1.4. Determining Carbon Emission Indicators and Goals
Establishing carbon emission targets helps to demonstrate the leadership’s commitment and encourages staff throughout the organisation to reach real reductions in carbon emissions. Carbon emission targets should be aligned with existing corporative goals to ensure the success of the strategy. Defining emission targets correctly will help to identify cost-effective reduction opportunities, risks and operational synergies.
There are two different ways of determining carbon targets: absolute and efficiency of carbon base. The first one is the total amount of carbon emission, measured in terms of kilograms or tonnes of CO2. The efficiency base
considers the total amount of carbon emission but as a ratio indicator, in which a business metric is included. It could be the relation between carbon emission and finished goods sold, the total sales volume, or the turnover. For this purpose, two performance metrics are identified:
• KPI 1: Absolute amount of carbon emitted as measured in “Kilograms of CO2” (Kg CO2). It gives
information on a company’s total CO2 impact.
• KPI 2: Efficiency of carbon emissions as measured in “Kilograms of CO2 per Kilograms sold” (Kg CO2 /
Kg sold). It indicates the total amount of CO2 to produce and/or move one Kg of freight.
Similar key performance indicators (KPIs) are used in the research by Özsalih (2007). The efficiency of carbon emissions “Kilograms of CO2 per Kilograms sold” would be an excellent base for establishing targets, whatever the
KPI used; it is highly recommended for use as a function of a business metric. Target emissions are performed transparently, relative to past emissions and based on a fixed target or a rolling target base year.
3.1.5. Identifying Carbon Reduction Opportunities
One of the most important steps in the Corporate Carbon Strategy is the identification of the potential alternatives, which will help to achieve the carbon reduction targets. In this step, the company should compile a list of potential and feasible alternatives per area of the supply chain.
According to the information provided in the literature review, in the transportation area there are potential opportunities such as intermodal transport (rail-road, water-road), alternative fuel (biodiesel, Compressed Natural Gas (CNG); electric vehicle, hybrid vehicle) and vehicle design (Euro4,5,6).
In manufacturing, alternatives can be related with new technologies (CHP, Biomass), engineering (certification schemes such as Leed or Breeam) or new technologies (Carbon Capture Technology), whilst in warehousing it is related with maximizing usage of daylight (Solatube), lighting controls and/or light sources.
Improvements related with renewable energy (wind power, solar electricity, solar water heating, fuel cells, etc.) can affect either manufacturing or warehousing. In the procurement area, some alternatives are related with supplier selection and the criteria used. Some of the suppliers’ requirements include green certification, waste management, stock longevity, etc.
The cost, CO2 amount and marketing impact should be calculated or estimated for every potential alternative. In
3.1.6. Evaluate the Participation in Carbon Markets
A new concept is set out in Article 17 of the Kyoto Protocol, an “emissions trading” scheme, which allows countries and companies to optimize CO2 emissions. Under this scheme, companies can buy or sell CO2 credits,
and in so doing, meet their environmental goals. This scheme is based on assigning a quota of emission credits [1 credit = the right to emit one metric ton of carbon dioxide equivalent to (t CO2e)]. Every company must manage
these carbon credits in the most efficient manner possible.
The last step of the Corporate Carbon Strategy is the definition of the carbon market, where the company can participate. In this stage, the company should find opportunities in the carbon taxation policy levied and assess the benefit of participating in some of those programs (Hou, Jia, Tian, Wei & Wei, 2015).
There are different carbon markets around the world (Johnson & Heinen, 2004), for instance the European Union Emission Trading Scheme (or EU ETS), the New Zealand Emissions Trading Scheme (NZ ETS), the Chicago Climate Exchange in the United States and the Montreal Climate Exchange in Canada.
3.2. The Carbon Roadmap Creation
An Analytic Hierarchy Process (AHP) technique is used for creating a carbon emission roadmap. This technique is useful in supporting the decision-making processes for selecting the most interesting alternatives, which would be part of the strategy for achieving the carbon reduction goals (Álvarez & de la Calle, 2011).
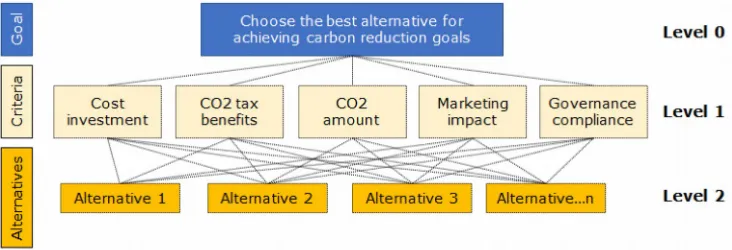
Every potential alternative, previously identified in the step 5 of the CCS, must be submitted to a reasonably complex hierarchy. It involves factors ranging from the tangible and precisely measurable (cost/investment, economic savings, CO2 tax benefits), through tangible but difficult to measure (carbon emission amount,
government polices compliance) to the intangible and totally subjective (marketing impact, competitive advantage). The criteria for evaluating every alternative could change according to the priorities already defined in the CCS. Nevertheless, the goal should be the same or similar - “Choose the best alternative for achieving carbon reduction goals”.
Figure 3 shows an example of an AHP for making decisions related to environmental projects, such as carbon reduction roadmap. The goal of the analysis at level 0. Level 1, in yellow, shows the multi-criteria and level 2, in orange, represents the alternatives. All the alternatives for carbon reduction are shown below the lowest level of each criterion. Later in the process, each alternative will be evaluated with respect to the criterion directly above it.
Figure 3. An example of AHP for the carbon alternatives selection (Based on AHP principles)
Note that the structure of the carbon reduction alternatives hierarchy might be different for other companies, for instance some of them could be focussing more on the marketing impact or other intangible criteria, whilst other companies might focus on the economic criteria.
3.3. Implementation and Tracking
According to the Carbon Trust (2012) there are different strategies for taking advantage of the carbon reduction results, some examples of which are: publicising the company’s achievements, gaining an accreditation, applying for an environmental award and/or participating in voluntary or carbon markets.
The publicity can be made using external communication channels, promoting green products/services, using media to share the carbon roadmap progress. In addition, it is possible to find certification such as ISO14001 or BS8555 in the implementation phase, which can help in preparing for an audit as proof of the environmental commitment.
Applying for an environmental award is another interesting manner to publicise that commitment and motivate employees regarding the carbon reduction goal. Besides, the carbon reduction reported yearly can be useful for participating in carbon markets or voluntary programs (as explained in section 3.1.6 “Identifying carbon reduction opportunities”).
In this stage reviewing and re-evaluating new alternatives for carbon reduction is also recommended. The aim is to create a “virtuous circle” where the company constantly looks for new opportunities and re-develops its Green Supply Chain Strategy to keep a step ahead of its competitors.
This case study implements the Green Supply Chain Strategy proposed here in a metallurgical company. The study demonstrates the importance of following the proposed strategy step by step, making a special analysis of the scope definition impact. It also shows how an AHP technique can be useful in defining a carbon roadmap.
This case study is organized as follows: Section 4.1 includes a description of the current supply chain; Section 4.2 implements the Green Supply Chain Strategy in the case study company, including a description of all the steps of CCS and the creation of the carbon roadmap using the AHP technique; and finally, Section 4.3 includes a sensitivity analysis of the carbon footprint scope definition.
4. Case Study
To illustrate the proposal, the set of data of a global manufacturing company in the metallurgical sector is used. In section 3.1 the current situation is described, whilst in section 3.2 the proposal for a Green Supply Chain Strategy is implemented and finally in section 3.3 a sensitivity analysis of the carbon scope definition is exposed.
4.1. The Current Situation
The company has a set of retailers located in the United States, which is the main market. These retailers are physically based in Texas, Virginia, Florida, Colorado, New York, Chicago and California.
Nowadays, the company has a factory in Michigan (United States) and it is planning to open another one in Dortmund (Germany). The company uses one Distribution (DC) in California and is planning to open two DC more in Texas and Michigan. The company uses third-party providers to transport goods through the network, with a combination of rail and truck for movements between the Michigan factory and the California DC. See the map of Figure 4 for a better understanding of the current situation.
Both factories have a group of suppliers that serve them but the most relevant are located in China, Turkey and Ukraine. The flows between the suppliers and the Michigan factory use water transportation and the company tries to avoid using air transport for any flow.
The company under review wants to have a carbon reduction plan for three reasons:
• The competitors have started reporting emissions. Consequently, they feel threatened by the competition.
• As this company is publicly traded, it is trying to position itself in the area of being more environmentally responsible; they are also under some pressure due to media attention and their customers’ questions on the subject.
Figure 4. Supply chain. Current situation
4.2. The proposal for a Green Supply Chain Strategy
The GSCS presented in this paper was applied to this metallurgical company. Table 1 shows a summary of the CCS, including a definition of the six steps, starting with the determination of the type of emission and finishing with the evaluation of possible carbon markets.
As soon as the CCS is defined, the next stage is to develop a carbon reduction roadmap using an AHP technique. For this case study, the criteria used for the carbon alternatives selection were based on three factors: (1) the alternative cost, (2) carbon emission impact in terms of CO2 tonnes and (3) marketing effect.
The first one is a tangible and precisely, it is basically the variable cost or the investment needed for the alternative implementation; Table 1 shows an example of the estimated cost per alternative. The second one is tangible but moderately difficult to estimate, every alternative includes the potential reduction in carbon emission.
Finally, the third factor could be subjective and much more difficult to measure. A successful marketing campaign based on carbon emission reduction must be measured in terms of brand benefits; it is mainly related with the expected sales increase. Nevertheless, this type of initiatives can also have a positive effect in the Corporate Social Responsibility (CSR) and in the corporate image, more than direct financial benefits. Thus, the marketing effect was quantified using a rate, where 10 is the alternative with the highest marketing effect and 1 the one with the lowest effect.
In the CCS definition, twelve alternatives were identified as potential and feasible for improving the supply chain and the carbon emission KPI. The list of pre-selected alternatives is as follows:
• Alternative 1: Increase Rail-Road intermodal for transportation between Factories and DCs. Carbon emission saving: 30k Tons; Marketing effect: 4
• Alternative 2: Use Water-Road intermodal for transportation between Factories and DCs. Carbon emission saving: 40k Tons; Marketing effect: 8.5
Step of the CCS Carbon Strategy Financial Planning
1. Type of emission Carbon dioxide (CO2) Methane (CH4) Nitrous oxide (N2O)
2. Scope definition Ownership perspective Including Suppliers Excluding Corporate Offices
3. Carbon emission baseline Year: 2017 forecast KPI1: 3,320,000 CO2 tons KPI2: 8.3 Kg CO2/Kg sold
Sales: 400,000 tons forecast 2017
4. Carbon reduction goals Plan: 7 years KPI2: More than 30% reduction in terms of Kg CO2/Kg sold
Sales: 706,575 tons forecast 2023
5a. Alternatives:Manufacturing
1. CHP – US factory 2. Biomass – US factory
3. Wind Energy – Germany factory 4. Solar Energy – US factory
1. Inv: ~3.75 – 5 M€ 2. Inv: ~4 – 6 M€ 3. Cost: +15% and
4. Cost: +12% of the energy cost
5b. Alternatives: Warehousing 1. Daylight – Solatube2. Energy storage 1. ~80 - 200 K€2. ~90 – 220 k€
5c. Alternatives:Transportation
1. Alternative fuel CNG 2. Alternative fuel Hybrid 3. Intermodal Rail-Road 4. Intermodal Water-Road
1. & 2. Cost: +8%; 3. Cost: +10% and
4. Cost: +5% of the transport cost
5d. Alternatives: Network 1. Open a new factory in Germany2. Open two new DC in US 1. 30 – 40 M€2. 15 – 20 M€
6. Carbon Markets Voluntary program in California, using one of thefacilities based there.
Table 1. Green Supply Chain Strategy
• Alternative 4: The use of Hybrid vehicles in transportation from DCs to retailers. Carbon emission saving: 28k Tons; Marketing effect: 3.3
• Alternative 5: Commissioning two new DCs in Texas and Michigan to reduce kilometres travelled between DCs and Retailers. Carbon emission saving: 373k Tons; Marketing effect: 2.5
• Alternative 6: Commissioning a new factory in Germany using technologies to reduce the energy consumption. Carbon emission saving: 304k Tons; Marketing effect: 4.8
• Alternative 7: Maximize usage of daylight, implementing technologies such as Solatube (solution to increase daylight utilization). Carbon emission saving: 15k Tons; Marketing effect: 7.8
• Alternative 8: Implement Combined Heat and Power (CHP) system in the US factory). Carbon emission saving: 180k Tons; Marketing effect: 7
• Alternative 9: Implement Biomass technology in the US factory. Carbon emission saving: 157k Tons; Marketing effect: 10
• Alternative 10: Apply for the use of Wind energy in new factory in Germany (it would be selected only in the event that Alternative 5 is also selected). Carbon emission saving: 238k Tons; Marketing effect: 6.3
• Alternative 11: Implement Solar energy in the US factory. Carbon emission saving: 53k Tons; Marketing effect: 1.8
• Alternative 12: Implement an optimal energy storage and charging process in all the DCs. Carbon emission saving: 5k Tons; Marketing effect: 1
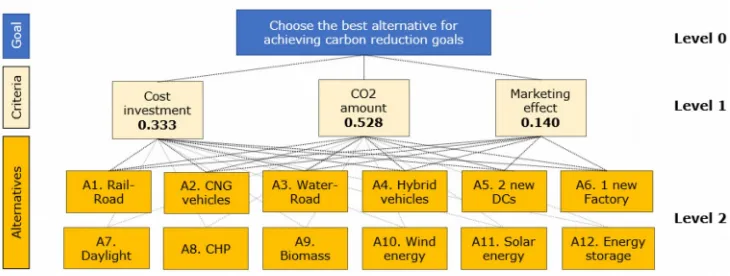
Figure 5. AHP applied to the case study
As a part of the technique, the first step was to make 3 pairwise comparisons for the criteria. Given that the objective of this case study is to create a carbon reduction strategy, the “CO2 amount” criteria was considered
extremely more important, thus it has the highest rate, whilst “cost investment” is moderately more important than the “marketing effect”. The resulting weights are based on the principal eigenvector of the decision matrix and are shown in the column “Criterion weight” of the Figure 5.
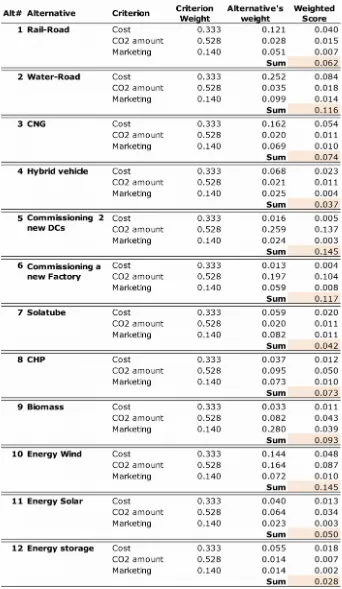
The second step is to make the 66 pairwise comparisons for the 12 alternatives, first based on the cost of the alternative; then another 66 pairwise comparisons is needed, but in this case based on the carbon emission impact in terms of CO2 tonnes. Finally, the 66 pairwise comparisons should be made, based on the marketing effect.
In terms of cost of the alternative, those alternatives associated with investments have the highest investment values, thus the lowest alternative weight (see Figure 7). Those alternatives related to energy management (i.e. Biomass, CHP) also imply a considerable investment, whilst the transportation alternatives have an incremental cost in the transport rates (see Table 1).
The “CO2 amount” criteria was evaluated according the estimated quantity of carbon emission saving of each
alternative. The last criteria “marketing effect”, was assessed with a marketing rate (based on an internal assessment), which includes the alignment with the CSR, corporate image and brand benefits (the calculation the marketing rate is out of scope of this study).
The results are shown in the column “Alternative’s weight” of Figure 6. The final step is to calculate the weighted score, which is done by multiplying the criterion weight by every alternative’s weight. The highest scores are the alternatives selected to form part of the carbon roadmap.
The six alternatives selected are: 1) Commissioning two new DCs, 2) Using Wind energy, 3) Commissioning a new factory in Germany, 4) Using intermodal transport Water-Road for lines from factories to DCs, 5) Implementing Biomass technology in the US factory and 6) using CNG as an alternative fuel. Figure 7 shows the six alternatives organized by priority according to the weighted score.
Figure 7. Results of the AHP technique
4.2.1. Supply Network Projects: A New Factory and 2 New DCs
The network re-design alternative in logistics would occur in 2019. As a result, there is a significant carbon emission reduction in transportation, in both secondary transport (35%) and primary transport (45%). It is mainly a consequence of the kilometres travelled, reporting 31% less in the primary and 45% in the secondary transport. During 2020 the company would open a new factory in Germany. This decision is based on the fact that different manufacturing and other operations from Europe are better from an environmental and carbon footprint perspective than the United States.
4.2.2. Manufacturing Projects: Wind Energy and Biomass Technology
Wind energy is a good option for implementation in 2021, as a part of the improvements of the new factory commissioned in Germany. This plan is based on the possibility of making agreements with a renewable energy company which will provide a certified energy supply.
On the other hand, for the US factory in 2022, the proposal is to implement Biomass technology. The biomass boiler is fed with old pallets and waste wood from the furniture industry, but the factory should only use sustainable biomass from genuine “end of life” sources that do not compete with food crops.
4.2.3. Transportation Projects: Intermodal Water-Road and CNG
The plan for the secondary transport would be to use road transport, due to the flexibility that this kind of transport mode has. However, the proposal is to use Compressed Natural Gas (CNG) at the beginning of the roadmap in 2018 just for routes between California DC and retailers and extend this scope for all the secondary transport in 2024. The intermodal water-road would also be part of the plan for primary routes starting in 2023. Figure 8 shows how the six alternatives are allocated across the roadmap. The impact of the implementation of these alternatives is a 36% reduction in carbon emissions in terms of Kg CO2 per Kg sold (8.3 in 2018 vs 5.7 in
2024). As Figure 7 shows, all the alternatives are divided into projects related with energy management, alternative fuels, intermodal transport and network design.
In order to create a carbon reduction strategy, the AHP method was implemented. The implementation of this MCDM method has proposed a plan where the carbon emissions in terms of Kg CO2 per Kg sold is reduced 36%
Figure 8. Carbon Reduction Roadmap for the metallurgical company
The given methodology, including the set of alternatives, was presented and are in evaluation phase. So far, the assess is positive and the evaluation rates the proposal as logical, reasonable and useful for reaching the CO2 targets.
The proposal is considered as very good starting point, considering that carbon corporate standards are still lacking in the corporate world where there is lots of leeway for misunderstanding and misinterpretation.
4.3. A Sensitivity Analysis of the Carbon Scope Definition
Depending on what the companies are trying to do, different scenarios can be evaluated. For instance, if only the transportation between DCs and retailers were considered, the distance would be a key factor. Nevertheless, in the logistics area, the agreements with the 3PLs are also another key parameter.
If the scope is extended to the factories, energy management can be even more important than the transportation aspect and again, agreements with the factory would be a significant point; for example, joint venture agreements. Furthermore, if the scope included raw materials, the supplier’s location would be important and would be relevant if the supplier also worked with some sustainable policies.
Once the carbon emission forecast is carried out, it is possible to look at all the elements of the supply chain, to understand the agreements with all the facilities, movements, port operations and international shipments and define the strategic scope to be used by the company.
In order to demonstrate the importance of the scope definition a sensitivity analysis for different scopes was carried out, based on the 2019 carbon forecast. Three scenarios are generated in this section, the first being the quantification of the extended scope which is used in the case study. Scenario 2 includes the ownership perspective, whilst scenario 3 was developed using the scope 1 and 2 of the GHG protocol. Finally, scope 4 quantifies carbon emissions from a conservative perspective.
4.3.1. Scenario 1: The Extended Scope
The particularity of this first analysis is that it includes the emissions coming from suppliers as well as the associated transportation. Therefore, this extended scope includes the carbon emissions of the DC facilities (California, Georgia, Texas) and factories (Michigan and Dortmund) and carbon emissions of the raw materials coming from suppliers (based in Shanghai, Istanbul, Kiev).
The total emissions estimated under this scope are 3.2 million tons of CO2, most of which come from the US
factory (37%) and suppliers (20%) (see Table 2). The carbon emission in facilities is calculated by multiplying the energy consumption in terms of kilowatt hours by the emission factor of the technology used (coal, wind energy) (Kg CO2 / kilowatt).
In transportation, the carbon emissions are calculated by multiplying the kilometres travelled by the emission factor (Kg CO2 / kilometres travelled). Finally, the carbon emissions of the raw materials are calculated by multiplying the
raw material amount by the emission factor of each type of raw material.
Extended scope CO2 Emission 2019 [tons] Contribution [%]
DC California 7,550 0.2%
DC Georgia 89,207 3%
DC Texas 54,241 2%
Transport DC - Retailer 189,034 6%
US Factory 1,213,632 37%
German Factory 291,007 9%
Transport Factory - DC 324,878 10%
Supplier China 176,951 5%
Supplier Turkey 147,628 5%
Supplier Ukraine 310,086 10%
Transport Supplier - Factory 444,369 14%
Total 3,248,584 100%
Table 2. Carbon emission split under the extended scope
4.3.2. Scenario 2: The Product Ownership Perspective
The scope from the product ownership perspective includes the total carbon emissions, but it does not consider either the emissions from suppliers or the transportation from suppliers to factories. Also in this case, the most relevant part of the carbon emissions is in the factories (55%). See Table 3.
Product ownership perspective CO2 Emission 2019 [tons]
Contribution [%]
DC California 7,550 0.2%
DC Georgia 89,207 3%
DC Texas 54,241 2%
Transport DC – Retailer 189,034 6%
US Factory 1,213,632 46%
German Factory 291,007 11%
Transport Factory – DC 324,878 12%
Transport Supplier - Factory 444,369 17%
Total 2,613,919 100%
4.3.3. Scenario 3: GHG Scope 1 & Scope 2
The GHG Scope 1 and 2 means that only the own carbon emission is taken into account. This is the case of the transportation, if it is excluded as a part of the 3PL agreement it is somebody else’s. In terms of the factory the GHG protocol specifies that if the factory is a joint ownership, only the share of emissions that the company owns have to be considered. Table 4 shows how the new split would be, the total is 1.5 million of CO2 emissions, 54%
less than Option 1.
GHG Scope 1 & Scope 2 CO2 Emission 2019 [tons] Contribution [%]
DC California 7,550 0.5%
DC Georgia 89,207 6%
DC Texas 54,241 4%
US Factory 1,213,632 80%
German Factory (50%) 145,504 10%
Total 1,510,134 100%
Table 4. Carbon emission split under GHG Scope 1 & Scope 2
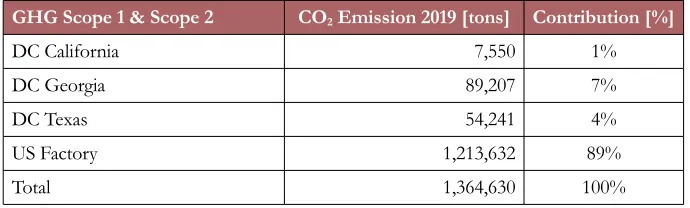
4.3.4. Scenario 4: Conservative/Regulatory
The last option is the conservative and regulatory one: in this case, only the three warehouses and the US factory are included. This means the United States emissions, which would be regulated in California. In this case 1.3 million tons of carbon emission would be avoided (see Table 5).
GHG Scope 1 & Scope 2 CO2 Emission 2019 [tons] Contribution [%]
DC California 7,550 1%
DC Georgia 89,207 7%
DC Texas 54,241 4%
US Factory 1,213,632 89%
Total 1,364,630 100%
Table 5. Carbon emission split under Conservative/regulatory
The four scenarios shown above demonstrate how the scope definition can change the carbon strategy, in terms of carbon emission impact, alternatives in the scope and places/facilities for participating in the carbon markets. It also shows the importance of defining the scope as a part of the CCS.
5. Conclusions
In response to the needs of the industry, this paper proposes a strategy for carbon reduction into a supply chain. The aim of this methodology is to guide companies step by step in creating a Green Supply Chain Strategy, proposing a CCS, developing a carbon reduction roadmap and defining the strategy to be followed, taking advantage of the progress and finally reaching their carbon reduction targets.
The Green Supply Chain Strategy aims to improve the supply chain, but at the same time reduces the environmental impact. As part of the operation’s strategy different alternatives such as the location of factories and warehouses, as well as manufacturing and logistics projects are qualified through an AHP technique. The result is a proposal that makes a trade-off between environmental and economic objectives.
Chain Strategy. First, the CCS is defined; a finite number of potential alternatives (twelve) are selected in the CCS; these alternatives should be quantified in terms of supply chain cost, carbon emission or marketing impact. Secondly, an AHP technique was used to select six of the twelve alternatives, then these alternatives were properly allocated in the roadmap timeline.
In the case study the carbon emission KPI, in terms of cost Kg CO2 per Kg, is improved 36%. To achieve these
results, the AHP technique has selected alternatives such as commissioning two Distribution Centres (Georgia and Texas), commissioning a new factory in Germany, using CNG as an alternative fuel on the secondary routes and intermodal water-road on primary routes. Additionally, the alternative in manufacturing is to implement wind energy in the factory based in Germany and to use biomass technology in the US-based factory.
The case study also demonstrates the importance of defining the scope, early in the CCS stage. Depending on the considered scope and on what the company wants to do with the results, the strategy may produce different answers. If only the transportation level is considered the distance would be the most relevant parameter; if the manufacturing emissions are included it can actually reverse the decision, even more so if the supplier is taken into account, which can change the picture again.
Finally, it is important to point out the importance of the communication strategy in the implementation stage. It is highly recommended that the whole company is committed to align the supply chain strategy with achieving the carbon reduction targets.
Acknowledgments
This paper was supported by the project DPI2015-67740-P(MINECO/FEDER).
Declaration of Conflicting Interests
The authors declared no potential conflicts of interest with respect to the research, authorship, and/or publication of this article.
Funding
The authors received no financial support for the research, authorship, and/or publication of this article.
References
Ajanovic, A., & Haas, R. (2015). Driving with the sun: Why environmentally benign electric vehicles must plug in at renewables. Solar Energy, 121, 169-180. https://doi.org/10.1016/j.solener.2015.07.041
Al-Barqawi, H., & Zayed, T. (2008). Infrastructure Management: Integrated AHP/ANN Model to Evaluate Municipal Water Mains’ Performance. Journal of Infrastructure Systems, 14(4), 305-318. https://doi.org/10.1061/ (ASCE)1076-0342(2008)14:4(305)
Álvarez, E., & de la Calle, A. (2011). Sustainable practices in urban freight distribution in Bilbao. Journal of Industrial Engineering and Management, 538-553. https://doi.org/10.3926/jiem.2011.v4n3.p538-553
Behzadian, M., Kazemzadeh, R., Albadvi, A., & Aghdasi, M. (2010). PROMETHEE: A comprehensive literature review on methodologies and applications. European Journal of Operational Research, 200(1), 198-215.
https://doi.org/10.1016/j.ejor.2009.01.021
Bianchi, M., & De Pascale, A. (2012). Emission Calculation Methodologies for CHP Plants. Energy Procedia, 14, 1323-1330. https://doi.org/10.1016/j.egypro.2011.12.1096
Busch, T., Lehmann, N., & Hoffmann, V. (2012). Corporate Social Responsibility, Negative Externalities, and Financial Risk: The Case of Climate Change. Amsterdam and Rotterdam: Duisenberg school of finance - Tinbergen Institute Discussion Paper.
Carbon Trust. (2012). Green your business for growth. Management Guide. London.
Chaabane, A., Ramudhin, A., & Paquet, M. (2010). Design of sustainable supply networks under the emission trading scheme. International Journal of Production Economics, 135, 37-49. https://doi.org/10.1016/j.ijpe.2010.10.025
Cordero, P. (2013). Carbon footprint estimation for a sustainable improvement of supply chains: state of the art. Journal of Industrial Engineering and Management, 6(3), 805-813. https://doi.org/10.3926/jiem.570
Damert, M., Arijit, P., & Ruoert, B. (2017). Exploring the determinants and long-term performance outcomes of corporate carbon strategies. Journal of Cleaner Production, 160, 123-138. https://doi.org/10.1016/j.jclepro.2017.03.206
Dasaklis, T.K., & Costas, P.P. (2013). Supply chain management in view of climate change: An overview of possible impacts and the road ahead. Journal of Industrial Engineering and Management, 6(4), 1124-1138.
https://doi.org/10.3926/jiem.883
Franchetti, M., & Apul, D. (2012). Carbon Footprint Analysis: Concepts, Methods, Implementation, and Case Studies (Systems Innovation Book Series). CRC Press. https://doi.org/10.1201/b12173
Günther, H., Kannegiesser, M., & Autenrieb, N. (2015). The role of electric vehicles for supply chain sustainability in the automotive industry. Journal of Cleaner Production, 90, 220-233. https://doi.org/10.1016/j.jclepro.2014.11.058
Handfield, R., & Nichols Jr., E. (1999). Introduction to supply chain management. New Jersey: Prentic-Hall.
Hashim, M., Nazam, M., Yao, L., Baig, A.S., & Zia-ur-Rehman, M. (2017). Application of multi-objective optimization based on genetic algorithm for sustainable strategic supplier selection under fuzzy environment. Journal of Industrial Engineering and Management, 10(2), 182-212. https://doi.org/10.3926/jiem.2078
Hoffman, A.J. (2005). Climate Change Strategy: The Business Logic behind Voluntary Greenhouse Gas Reduction. California Management Review, 47(3). https://doi.org/10.2307/41166305
Hou, Y., Jia, M., Tian, X., Wei, F., & Wei, K. (2015). Optimal Decisions of Countries with Carbon Tax and Carbon Tariff. Journal of Industrial Engineering and Management, 8(3), 981-1001. https://doi.org/10.3926/jiem.1506
International Organization for Standardization. (2006). ISO 14064. Standard, Geneva, Switzerland.
Jeswani, K., Wehrmeyer, W., & Mulugetta, Y. (2007). How warm is the corporate response to climate change? Evidence from Pakistan and the UK. Business Strategy and the Environment, 18, 46-60.
Johnson, E., & Heinen, R. (2004). Carbon trading: time for industry involvement. Environment International, 30, 279-288. https://doi.org/10.1016/j.envint.2003.09.001
Kolk, A., & Levy, D. (2001). Winds of Change:: Corporate Strategy, Climate change and Oil Multinationals. European Management Journal, 19(5), 501-509. https://doi.org/10.1016/S0263-2373(01)00064-0
Kumar, S., Teichman, S., & Timpernagel, T. (2011). A green supply chain is a requirement for profitability. International Journal of Production Research, 1278-1296.
Lee Lam, J. (2014). Designing a sustainable maritime supply chain: A hybrid QFD–ANP approach. Transportation Research Part E: Logistics and Transportation Review. https://doi.org/10.1002/bse.711
Lee, S.-Y. (2012). Corporate carbon strategies in responding to climate change. Business Strategy and the Environment, 21, 33-48. https://doi.org/10.1002/bse.711
Letmathe, P., & Balakrishnan, N. (2005). Environmental considerations on the optimal product mix. European Journal of Operational Research, 167, 398-412. https://doi.org/10.1016/j.ejor.2004.04.025
Li, G., Xu, H., & Liu, W. (2013). Option of operating speed for vessels under low-carbon economy. Journal of Industrial Engineering and Management, 6(1), 289-296. https://doi.org/10.3926/jiem.660
Mintzberg, H. (2000). The strategy process: concepts, contexts, cases. Prentice Hall.
Montabon, F., Sroufe, R., & Narasimhan, R. (2007). An examination of corporate reporting, environmental management practices and firm performance. Journal of Operations Management, 25(5), 998-1014.
https://doi.org/10.1016/j.jom.2006.10.003
Okereke, C., & Russel, D. (2010). Regulatory Pressure and Competitive Dynamics: Carbon Management Strategies of UK Energy-Intensive Companies. California Management Review, 52, 100-124.
https://doi.org/10.1525/cmr.2010.52.4.100
Opetuk, T., Zolo, I., & Dukic, G. (2010). Greening elements in the distribution networks. Journal of Industrial Engineering and Management, 3(2), 353-363. https://doi.org/10.3926/jiem.2010.v3n2.p353-369
Özsalih, H. (2007). MSc: A methodology for transport buying companies to estimate CO2 emissions in transport: Application in Unilever European Logistics. Schaffhausen.
Pan, S., Ballot, E., & Fontane, F. (2013). The reduction of greenhouse gas emissions from freight transport by pooling supply networks. International Journal of Production Economics, 143(1), 86-94.
https://doi.org/10.1016/j.ijpe.2010.10.023
Pinto, C., & Coves, A. (2014). The reduction of CO2 emission into the supply network design: A review of current
trends in mathematical models. Annual of Industrial Enginerring 2012, 131-138. https://doi.org/10.1007/978-1-4471-5349-8_16
Pinto-Varela, T., Barbosa-Póvoa, A., & Novais, A. (2011). Bi-objective optimization approach to the design and planning of supply chains: Economic versus environmental performances. Computers & Chemical Engineering, 35, 1454-1468. https://doi.org/10.1016/j.compchemeng.2011.03.009
Saaty, T.L. (1988). Multicriteria Decision Making: The Analytic Hierarchy Process: Planning, Priority Setting, Resource Allocation. New York, USA: McGraw-Hill: New York.
Seuring, S., & Müller, M. (2008). Core issues in sustainable supply chain management – a Delphi study. Business Strategy and the Environment, 17, 455-466. https://doi.org/10.1002/bse.607
Slawinski, N., Pinkse, J., Busch, T., & Baner, S.B. (2015). The Role of Short-Termism and Uncertainty Avoidance in Organizational Inaction on Climate Change. Business & Society, 56(2), 253-282.
https://doi.org/10.1177/0007650315576136
Srivastava, S. (2007). Green supply chain management: a state of the art literature review. ‐ ‐ ‐ ‐ International Journal of Management Reviews, 9, 53-80. https://doi.org/10.1111/j.1468-2370.2007.00202.x
Tian, Y., & Yang, M. (2013). Demonstration analysis for the low-carbon factors index system of logistics enterprises. Journal of Industrial Engineering and Management, 6(1), 297-307. https://doi.org/10.3926/jiem.681
Trotta, M.G. (2010). Product Lifecycle Management: Sustainability and knowledge management as keys in a complex system of product development. Journal of Industrial Engineering and Management, 3(2), 309-322.
https://doi.org/10.3926/jiem.2010.v3n2.p309-322
Vujanovića, A., Čučekb Lidija, P.B., & Zdravko, K. (2014). Multi-Objective Synthesis of a Company’s Supply-Network by Accounting for Several Environmental Footprints. Process Safety and Environmental Protection.
https://doi.org/10.1016/j.psep.2014.03.004
Wang, F., Xiaofan, L., & Shi, N. (2011). A multi-objective optimization for green supply network network design. Decision Support Systems, 51, 262-269. https://doi.org/10.1016/j.dss.2010.11.020
Wang, Y., Zhu, X., & Jeeva, A.S. (2013). Eco-efficient based logistics network design in hybrid manufacturing/ remanufacturing system in low-carbon economy. Journal of Industrial Engineering and Management, 6(1), 200-214.
https://doi.org/10.3926/jiem.665
WCED, W.C. (1987). Our common future. Oxford: Oxford University Press.
Wu, H., & Dunn, S. (1995). Environmentally responsible logistics systems. Journal of Physical Distribution and Logistics Management International, 25, 20-20. https://doi.org/10.1108/09600039510083925
Yunus, S., Elijido-Ten, E., & Abhayawansa, S. (2016). Determinants of carbon management strategy adoption: Evidence from Australia’s top 200 publicly listed firms. Managerial Auditing Journal, 31, 156-179.
https://doi.org/10.1108/MAJ-09-2014-1087
Journal of Industrial Engineering and Management, 2018 (www.jiem.org)
Article’s contents are provided on an Attribution-Non Commercial 4.0 Creative commons International License. Readers are allowed to copy, distribute and communicate article’s contents, provided the author’s and Journal of Industrial Engineering and