RESEARCH ARTICLE
New potentiometric sensors
for methylphenidate detection based
on host–guest interaction
Haitham AlRabiah
1, Mohammed Abounassif
1, Haya I. Aljohar
1and Gamal Abdel‑Hafiz Mostafa
1,2*Abstract
The study aims to develop simple, sensitive, and selective methods for detecting methylphenidate in its bulk, dosage form and human urine. Sensing materials include β‑cyclodextrin (β‑CD), γ‑cyclodextrin (γ‑CD), and 4‑tertbutylcalix[8] arene as ionophores or electroactive materials have been used for construction of sensors 1, 2, and 3, respectively; Potassium tetrakis (4‑chlorophenyl)borate (KTpClPB) as an ion additive was used and dioctyl phthalate as a plasticizer. The sensors displayed a fast, stable response over a wide concentration range of methylphenidate (8 × 10⁻⁶ M to 1 × 10⁻³ M) with 10−6 M detection limit over the pH range of 4–8. The developed sensors displayed a Near‑Nernstian cationic response for methylphenidate at 59.5, 51.37, and 56.5 mV/decade for sensors β‑CD, γ‑CD, or 4‑tertbutylcalix[8] arene respectively. Validation of the proposed sensors is supported by high accuracy, precision, stability, fast response, and long lifetimes, as well as selectivity for methylphenidate in the presence of different species. Sensitive and practi‑ cal sensors for the determination of methylphenidate in bulk, in pharmaceutical forms and urine were developed and validated for routine laboratory use. The results were comparable to those obtained by HPLC method.
Keywords: Methylphenidate, β‑CD, γ‑CD, 4‑tert‑butylcalix[8]arene, Ionophore, Sensors, Potentiometry
© The Author(s) 2019. This article is distributed under the terms of the Creative Commons Attribution 4.0 International License (http://creat iveco mmons .org/licen ses/by/4.0/), which permits unrestricted use, distribution, and reproduction in any medium, provided you give appropriate credit to the original author(s) and the source, provide a link to the Creative Commons license, and indicate if changes were made. The Creative Commons Public Domain Dedication waiver (http://creativecommons.org/ publicdomain/zero/1.0/) applies to the data made available in this article, unless otherwise stated.
Introduction
Methylphenidate is a piperidine derivative that acts as an activator for the central nervous system used to treat hyperactivity and attention deficit. Hyperactivity is believed to be associated with reduced dopamine and norepinephrine functions in the brain; dopamine and norepinephrine are responsible for human executive functions, such as logic, inhibitory behavior, organiza-tion, problem solving and planning [1, 2]. The chemical nomenclature of methylphenidate is methyl 2-phenyl-2-(piperidin-2-yl) acetate and the structure is shown in Fig. 1a. Methylphenidate inhibits the reuptake of cat-echolamines by blocking dopamine and norepinephrine transport, which increases the concentration of catecho-lamines at their active sites [3].
Different analytical techniques for assaying of meth-ylphenidate have been available, most of which rely on chromatographic methods [4–15] using HPLC-ultravio-let detection [4, 5], HPLC-fluorescence detection [6, 7], HPLC-chemiluminescence detection [8], HPLC-mass spectrometry [9–12], and enantiomeric resolution [13– 15]. Most of these methods incorporate sample treat-ments steps and require expensive instrutreat-ments. The lack of functional groups (–NH2, –OH, –COOH, –CO, –CHO, ….) attached to the main structure of the drug (responsible for chemical reactions by the compound) makes it chemical reactivity very limited. Therefore, detection of the drug using spectroscopic or electro-chemical techniques are not widely used. Thus, we aimed to develop, for the first time, a cost effective potentiomet-ric sensors for the detection of methylphenidate.
Polyvinyl chloride (PVC) membrane sensors are rela-tively inexpensive, simple, highly selective, with a fast response and represent one of the few techniques used for detection of both cation or anionic compounds [16, 17]. Moreover, the application of PVC membrane sensors
Open Access
*Correspondence: gmostafa@ksu.edu.sa
1 Pharmaceutical Chemistry Department, College of Pharmacy, King Saud
University, P.O. Box 2457, Riyadh 11451, Saudi Arabia
in biological/medical matrices was previously described [18–20]. In addition, this technique is not affected by the presence of color or turbid samples [21].
The current study describes the applicability of either β-CD, γ-CD, or 4-tert-butylcalix[8]arene as ionophores and potassium tetrakis (4-chlorophenyl)borate as an ion additive to construct and develop new PVC membrane sensors for methylphenidate. The methods were then used for detecting methylphenidate in its bulk, dosage form and urine. The obtained results were compared with HPLC.
Materials and methods
Apparatus
All potentiometric measurements were performed at 25 ± 1 °C unless otherwise stated, using a HANNA pH 211 pH meter with methylphenidate indicator sensors in conjunction with a reference electrode (Merck) contain-ing 10% (w/v) potassium nitrate in the outer compart-ment. The pH was measured using a combined Ross glass pH electrode.
The chromatographic assay of methylphenidate was carried out on Waters HPLC system (Milford, USA)
equipped with a “Waters 1500 series HPLC pump, a Waters 2489 dual-wavelength UV detector, and a Waters 717 Plus autos ampler”. The chromatographic separation was achieved with an analytical C18 analytical column (125 mm × 4.6 mm internal diameter × 3 μm particle size) (Waters, Ireland) using a mixture of methanol: ace-tonitrile: acetate (pH 4.0) as mobile phase. The detection was carried out at 230 nm by UV detection [4].
Reagents and materials
All chemicals were of analytical reagent grade and dou-ble distilled water were used throughout. High molecu-lar weight PVC powder, dibutyl phthalate (DBP), dioctyl phthalate (DOP), o-nitrophenyloctyl ether (o-NPOE), and tetrahydrofuran (THF) of purity > 99% were obtained from Aldrich Chemical Company and methylphenidate HCl, β-CD, γ-CD, 4-tert-butylcalix[8]arene and KTp-ClPB were obtained from Sigma Chemical Company, Germany. Methylphenidate tablets (10 mg; Laborato-ries Rubio, S.A., 08755 Castellbisbal, Spain) and Ritalin, 10 mg MP, Novartis were obtained from a local phar-macy, Saudi Arabia. An appropriate amount of methyl-phenidate was dissolved in distilled water to prepare a
1 × 10⁻² M solution. Working solutions of methylpheni-date (1 × 10⁻² –1 × 10⁻⁶ M) were prepared by serial dilu-tion of the stock in distilled water. Acetate buffer soludilu-tion of pH 5 was prepared using mixture of 0.05 M sodium acetate and acetic acid.
Preparation of the MP‑PVC membrane sensors
The ionophore materials (β-CD, γ-CD, or 4-tert -butylca-lix [8]arene; 5 mg each) were combined with KTpClPB as an additive (5 mg) and thoroughly mixed with the PVC powder (190 mg), and 350 mg of the plasticizer (DBS, DOP, or o-NPOE) followed by addition of THF (5 mL) in glass Petri dishes (5 cm diameter). After mixing the con-stituents, the solvent was allowed to evaporate for about 20 h while the sensing membranes formed. The PVC master membranes were sectioned using a cork borer (10 mm diameter) and glued to a polyethylene tube (3 cm long, 8 mm i.d.) using THF [16, 17]. Glass electrode bod-ies were used and connected with a polyethylene tube at one end then the indicator electrode was filled with the internal standard solutions (the same volumes of 1 × 10⁻² M aqueous solutions of methylphenidate and KCl). Ag/ AgCl internal reference electrode (1.0 mm diameter) was used. The working electrode was conditioned by keeping it in a 1 × 10⁻² M aqueous methylphenidate for 1 h and it was kept in diluted solution of methylphenidate after finishing the work.
Effect of pH and response time
The pH of the investigated sensors at two concentra-tions of methylphenidate was assessed for the optimum pH relative to response to methylphenidate. The pH was controlled using a weak HCl or NaOH solution. The methylphenidate-PVC sensors were tested using two concentrations (0.001 M and 0.0001 M) of relative response to methylphenidate.
One of the most important factors that affect electrode characterization is the stability of potential reading of the developed sensors. The minimum time required to obtain the potential reading of a sensor after inserting the electrode into the methylphenidate test solution (increas-ing or decreas(increas-ing the concentration) is the assessed as an average time.
Procedure
The methylphenidate-PVC sensors were standardized by immersion in combination with a reference electrode in an electrochemical cell containing 9.0 mL acetate buffer of pH 5. Then, a 1.0 mL aliquot methylphenidate solu-tion was added with constant stirring to obtain the final drug concentrations ranging from 10−6 to 10−3 M and the potential was recorded after each addition. Calibra-tion graphs were then made by plotting the potentials
as a function of −log[methylphenidate]. The extracted equation of each calibration line was used for the assay of solution with unknown methylphenidate concentration.
Detection of methylphenidate in its dosage form
Ten tablets of methylphenidate (10 mg each) were weighed, crushed and blended in a mortar. An adequate amount (10 mg methylphenidate powder) was trans-ferred into a 100 mL beaker, dissolved in distilled water, sonicated for approximately 10 min, filtered and collected in 100 mL measuring flask, and filled with water. Aliquots (5.0 mL) were moved into a 50 mL measuring flask, the pH was adjusted to 5 using acetate buffer, and the volume mad up with water. The potential of the formed solution was recorded using methylphenidate sensors in con-junction with a reference double con-junction electrode. The concentration was calculated from the previously con-structed calibration equations using the different sensors. The potentials of the methylphenidate assay solution were recorded before and after the addition of a 1.0 mL of 1 × 10⁻³ M solution. The unknown concentration of methylphenidate was assessed using standard addition technique [16].
To prepare the reconstituted powder, a mixture was made with a fixed amount of methylphenidate powder (5 mg) and tablet ingredients starch, lactose, and magne-sium stearate. The constituents were dissolved in water, sonicated for 15 min, filtered, and collected in a cali-brated measuring flask. The unknown concentration was assessed to measure both recovery and accuracy.
Determination of methylphenidate in urine
A urine sample was obtained from a healthy volunteer and spiked with 1 × 10⁻⁵ g/L methylphenidate. The pre-pared sample was centrifuged at 3000 ppm for 8 min. Then the clear upper layer was analysis as recommended procedure.
Results and discussion
Mechanism of sensing membrane
Cyclodextrins (CDs) are commonly used as receptors in host–guest inclusion complexes [25, 26]. Addition-ally, 4-tert-butylcalix[8]arenes are well known as selective ligands for many different ions [27]. 4-tert-butylcalix[8] arenes form stable inclusion complexes (host–guest interaction) through dipole–dipole interactions and therefore different ionic selective membrane can be made [28–30]. CDs have a large cyclic-like structure present as a cylindrical funnel with an upper, wide rim and a lower, narrow rim (Fig. 1b, c). The upper rim in the CDs is com-posed of secondary alcohols, while the lower rim consists of primary alcohols [25], which allow the coordination between the carrier and guest.
The degree of complexation between host and guest is based on the size of the carrier (ionophore). The host– guest interactions are based on different forces e.g. for-mation of hydrogen bonds, hydrophobic interactions and van der Waals force [31]. The carriers used in the present investigation are β-CD, γ-CD, and 4-tert-butylcalix[8] arene. β-CD and γ-CD are 7-membered and 8-membered sugar ring molecules, respectively. On the other hand, methylphenidate has donor atoms (oxygen and nitrogen) that assist the coordination reaction between host and guest. In addition, methylphenidate has a positive charge, which also assists the coordination reaction between guest and host, through the formation of a flexible inclu-sion complex reaction.
The effect of the additive
The additive in membrane composition plays a sig-nificant role in the sensing mechanism; the additive is employed to produce ionic sites through the membrane material. This procedure improves the analytical behav-ior of the investigated membrane, which becomes more ionic (cationic or anionic) [16, 17]. In this case study, the addition of KTpClPB converts the neutral site of the carrier to a cationic site, which allows the detection of
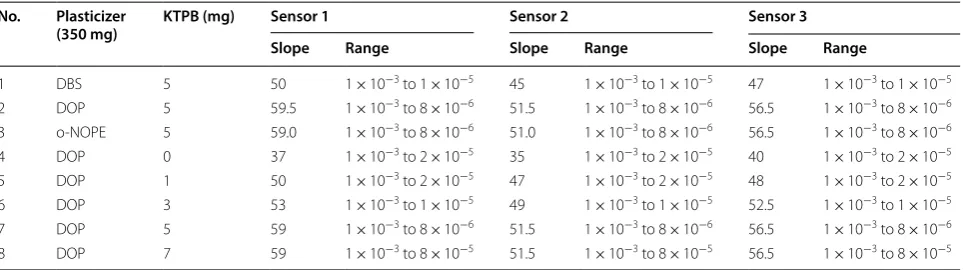
cations (methylphenidate ions) by reducing anionic inter-ferences, thus increasing selectivity towards the target analyte [27]. It also enhances the ion-exchange response, which increases the sensitivity of the proposed sen-sors [24]. In this study, we used KTpClPB, which allows the carrier to produce cationic sites through the sensing membrane, and it acts as an anionic excluder in the other direction, reducing the selectivity. Therefore, the additive increases the sensitivity and increase selectively of the proposed PVC sensors towards the proposed drug [24, 27]. The addition of additive KTpClPB from 1 mg to 7 mg was studied, as the concentration of additive increase the sensitivity of the methylphenidate sensors increase till 5 mg, upon increasing of KTpClPB till 7 mg the sensitiv-ity is remaining constant. Therefore, 5 mg was chosen as the optimum concentration of the additive (KTpClPB). The results are listed in Table 1.
The effect of plasticizers
Methylphenidate-PVC membrane sensors were assessed for the effect of using different plasticizers in relation to their analytical characteristics. The three plasticizers were DBP, DOP, and o-NPOE. The role of the plasticizers in the manufacturing of such PVC membranes is to pro-duce a plastic membrane that is flexible and homogene-ous to assist ion exchange through the membrane. DOP and o-NPOE were observed to be suitable plasticizers, accessible and available mediators for methylphenidate sensors compared with DBP. The solvation of the iono-phores by DOP and o-NPOE seemed to be suitable for the construction of the sensors; however, in the case of
o-NPOE the nature of the membrane is oily and there-fore it is not easily handle. Therethere-fore, the best results were acquired using DOP (ε = 7) compared with o-NPOE (ε = 24). In addition, different quantities of plasticizer (250, 300, 350 and 400 μL) were tested. The rigidity of the membranes made with 250, 300 μL plasticizer was
Table 1 Optimization of the PVC membrane composition
Sensor 1 (β-CD), Sensor 2 (γ-CD) and Sensor 3 (calaxirene)
No. Plasticizer
(350 mg) KTPB (mg) Sensor 1 Sensor 2 Sensor 3
Slope Range Slope Range Slope Range
1 DBS 5 50 1 × 10⁻³ to 1 × 10⁻⁵ 45 1 × 10⁻³ to 1 × 10⁻⁵ 47 1 × 10⁻³ to 1 × 10⁻⁵
2 DOP 5 59.5 1 × 10⁻³ to 8 × 10⁻⁶ 51.5 1 × 10⁻³ to 8 × 10⁻⁶ 56.5 1 × 10⁻³ to 8 × 10⁻⁶
3 o‑NOPE 5 59.0 1 × 10⁻³ to 8 × 10⁻⁶ 51.0 1 × 10⁻³ to 8 × 10⁻⁶ 56.5 1 × 10⁻³ to 8 × 10⁻⁶
4 DOP 0 37 1 × 10⁻³ to 2 × 10⁻⁵ 35 1 × 10⁻³ to 2 × 10⁻⁵ 40 1 × 10⁻³ to 2 × 10⁻⁵
5 DOP 1 50 1 × 10⁻³ to 2 × 10⁻⁵ 47 1 × 10⁻³ to 2 × 10⁻⁵ 48 1 × 10⁻³ to 2 × 10⁻⁵
6 DOP 3 53 1 × 10⁻³ to 1 × 10⁻⁵ 49 1 × 10⁻³ to 1 × 10⁻⁵ 52.5 1 × 10⁻³ to 1 × 10⁻⁵
7 DOP 5 59 1 × 10⁻³ to 8 × 10⁻⁶ 51.5 1 × 10⁻³ to 8 × 10⁻⁶ 56.5 1 × 10⁻³ to 8 × 10⁻⁶
very low, and therefore the handling of the membrane is harder, whereas with 350 or 400 μL, this was better handled. Thus 350 μL was used as the most appropriate quantity of plasticizer. The effect of different plasticizer on the membrane composition was listed in Table 1. The results indicate that DOP was better compared with o-NPOE and DBS.
Influence of pH and response time
The pH diagram for the investigated sensors had constant slopes (51.37, 59.4, and 56.3 mV/decade for sensors 1, 2, and 3, respectively) over the pH range 4 -8, as presented in Fig. 2. At higher pH (pH > 8), the potential decreases because the amount of un-protonated methylphenidate increases at higher pH (pKa = 8.9) [32]. Figure 2 shows
that the potential was constant in the pH range of 4–8. Different buffer solutions were tested (phosphate, ace-tate) over the optimum pH range (4–8). Acetate buffer (pH 5) appeared to be the best performing buffer; there-fore, acetate buffer was used for all experiments.
As presented in Fig. 3 the sensor response time [33] was 25 s whereas the potential reading of the proposed sensors before 20 s was unstable after 25 s the electrode potential was stable, therefore the response time was 25 s. The repeatability of the response was approximately within ± 1 mV for each test concentration. The lifetime of
the developed sensors were approximately 8 weeks (i.e., the period over which response was stable) where the RSD of the sensors was less than 3%. During 2 months, the membrane showed reproducible results, indicating that the PVC sensors were stable for the indicated life-time. After 2 months, the new section of the membrane showed reproducible of less than 4%.
Interference studies
The impact of various ions on the selectivity of the devel-oped sensors was investigated. The KAPot,B of the proposed
sensors was studied according the IUPAC recommenda-tions using either separate or mixed solution method [33, 34] at pH 5. KAPot,B was estimated for the separate solution method according to Eq. (1):
where EA and EB are the potential readings of methyl-phenidate and interfering ion concentration (1 × 10⁻³ M each), respectively; aA and aB are the activities of meth-ylphenidate and interfering species, respectively; ZA and ZB are the charge of methylphenidate and interfering spe-cies, respectively; and S is the slope of the graph (mV/ decade). The selectivity coefficient values for the mixed solution method were estimated according to Eq. (2):
where a′
A is the known activity of a primary ion that is
added to a known solution that has a fixed activity ( aA) of primary ions, and the corresponding potential change (ΔE) is recorded. Another test, a solution of an inter-fering ion (aB) is added to the known solution until the same potential change (ΔE) was recorded. Table 2 shows the results of interference tests. The results show reason-able selectivity for methylphenidate in the presence of most investigated interfering species. These data show that KA,BPot had low values, indicating high selectivity of the proposed sensors to methylphenidate.
Characteristics of the developed sensors
The potentiometric features of the developed sensors for methylphenidate utilizing: β-CD, γ-CD, and 4-tert -butylcalix[8]arene ionophores as sensing carriers were evaluated according the IUPAC guidelines. Table 2 shows the results. The least squares equations of the calibration graphs are constructed in the general form:
where E is the electrode potential and S is the slope of the calibration line (59.4 ± 1, 51.37 ± 1, and 56.5 ± 1 mV for sensors 1, 2, and 3, respectively); the intercept values were 220.45 ± 1, 216.58 ± 1, and 248.17 ± 1 for the three sensors, respectively.
Validation of the method
Limits of detection and quantification
The calibration plots of methylphenidate sensors were constructed by measuring the potential against the
(1)
logKApot,B= EB−EA
S +
1− ZA
ZB
logaA
(2) KApot,B=
a′
A−aA
aB
(3)
E(mV)=Slog[MP]+intercept
2 3 4 5 6 7 8 9 10 11 -20
-10 0 10 20 30 40
E, mV
pH claxirane
beta gama
negative logarithmic of methylphenidate concentration. Each point in the calibration plot was the average of five measurements [35]. The measured potential was plot-ted against the -log concentration to establish the cali-bration line; r2 (correlation coefficient) was determined for the plot. The calibration range was 1 × 10⁻³ to 10−6 M for sensors 1, 2, and 3 over the optimal pH range (pH 4–8). The lower limit of detection (LOD) and quantifica-tion (LOQ) were calculated according the IUPAC guide-lines [33]. The LOD values were 7 × 10⁻⁶, 7.5 × 10⁻⁶, and 7 × 10⁻⁶ M for the three sensors (1, 2, and 3, respec-tively), whereas the LOQ was 8 × 10⁻⁶ M for all sensors (Fig. 4).
Accuracy
The accuracy of the investigated sensors was expressed as the recovery (%) and was computed by calculating the measured concentration relative to the actual concentra-tion in an acetate buffer (pH 5). The recovery was calcu-lated according to Eq. (4):
The average recoveries (accuracies) within the same day (intra-day) of 26.09 μg/mL methylphenidate were 100.74%, 100.26%, and 101.48% for sensors 1, 2, and 3, respectively (Table 3). The average recoveries over differ-ent through diverse days (inter-day) were 97.43%, 97.1%, and 100.23% for sensors 1, 2, and 3, respectively (Table 4).
Precision
The precision of the developed methods was tested [35] by performing the analysis on the same day and over dif-ferent days for 26. 9 μg/mL methylphenidate (repeated five times within one day and within three days, respec-tively). The five repeated concentrations were used to calculate intra-day (through day) and inter-day preci-sion. The intra-day precision values (expressed as % RSD) were 2.39%, 2.19%, and 2.33% for sensors 1, 2, and 3,
(4) Recovery(%)=
Measured concentration Added concentration
×100%
0 20 40 60 80 100 120 140 160 180 200
-30 -20 -10
0
10 20 30 40 50 60 70 80 90
B-CD 1x10⁻³M
1x10⁻⁴M
1x10⁻⁵M
E, mv
time, sec
0 20 40 60 80 100 120 140 160 180 200
-40 -30 -20 -10 0 10 20 30 40 50 60
gama_CD
1x10⁻⁵M 1x10⁻⁴M 1x10⁻³ M
E, mV
time, sec
0 20 40 60 80 100 120 140 160 180 200
-40 -30 -20 -10 0 10 20 30 40 50 60
Clixarene
1x10⁻⁵M 1x10⁻⁴M 1x10⁻³M
E, mV
time, sec
respectively, whereas inter-day precision was assessed as 2.47%, 2.26%, and 2.34% for sensors 1, 2, and 3, respec-tively. All precision values were within the acceptable range, and the results are summarized in Table 4; all results are in the acceptable range.
Ruggedness and robustness
The ruggedness of the method [35] was assessed by measuring different concentrations by two different analysts and instruments on different days. The % RSD
values were < 3%, representing that the developed meth-ods are very rugged. The measured data also demonstrate that the suggested procedure is highly accurate. Changes of up to 10% from the optimum measuring conditions did not affect the response. The optimum pH value was 5 and the methods were highly robust in the optimum pH range (4–8). As presented in Table 5, the suggested procedure is highly ruggedness. On the other hand, the robustness of the investigated sensors was assessed dur-ing the day and different days at the optimum condition of the investigated sensors. The recovery during the day was 100.74%, 100.26%, 101.33% whereas RSD was 2.38%, 2.18%, and 2.21% for sensor 1, 2, and 3, respectively. Whereas the recovery during different days was 98.33%, 97.1%, 99.23%, while RSD was 2.5%, 2.4% and 2.7%, respectively. Results of ruggedness and robustness of the methylphenidate sensors are presented in Table 5.
Application of methylphenidate‑PVC sensors
The application of methylphenidate-PVC sensors for the quantification of methylphenidate in its pharma-ceutical form was investigated by examining the recov-ery of a known concentration of methylphenidate in standard solutions. The assay of 2.69 to 2697.7 μg/mL methylphenidate solutions (five replicates for each) was examined using the sensors. The recovery data showed that these methods are accurate (Table 6). The appli-cability of the methylphenidate sensors for quantify-ing methylphenidate was further examined by studyquantify-ing the determination of an exact concentration of meth-ylphenidate in a synthetic laboratory powder tablet containing all tablet constituents. The accuracy using the sensors were 98.6%, 98.4% and 99.2% (with %RSD values of 1.80%, 2.23%, and 2.22%), respectively. The results confirmed that the proposed methods are highly accurate and precise. The final step was to assess the methylphenidate in its dosage form using the three sen-sors. The results are presented in Table 6. The results confirmed the precision and accuracy of the investi-gated methods. The results for the determination of methylphenidate in its dosage form were compared with the analysis results using published HPLC meth-odology [4] (Table 7). The data suggest that the sen-sors provide a high degree of accuracy and precision matching the performance of the HPLC method [4]. The accuracy of the three proposed methods and the reported HPLC method were compared using |t|2 for P = 0.05 and n = 5, resulting in |t|2 between 0.14 and 1.05. These values were lower than the tabulated value (|t|2 = 3.36) [35], indicating that the suggested sensors are as accurate as the reported HPLC method. The pre-cision of the sensors and the reported HPLC method were compared using two-tailed F test. The values for Table 2 Potentiometric selectivity coefficients of some
interfering ions, using methylpheinadte-PVC sensors
Sensor 1 (β-CD), Sensor 2 (γ-CD) and Sensor 3 (calaxirene)
Interferent, J KMPPot,B
Sensor 1 K
Pot MP,B
Sensor 2 K
Pot MP,B
Sensors 3
Na+ 1 × 10⁻³ 2 × 10⁻³ 1.8 × 10⁻³
K+ 2 × 10⁻² 2 × 10⁻³ 1.7 × 10⁻²
Ca2+ 1.9 × 10⁻³ 1.7 × 10⁻³ 2.0 × 10⁻³
Fe+ 2.0 × 10⁻³ 1.8 × 10⁻³ 1.9 × 10⁻³
Acetate 1.8 × 10⁻³ 1.8 × 10⁻³ 1.9 × 10⁻³
Phosphate 2 × 10⁻³ 1.7 × 10⁻³ 1.9 × 10⁻³
Citrate 2 × 10⁻³ 1.8 × 10⁻³ 2.0 × 10⁻³
benzoate 2 × 10⁻³ 1.8 × 10⁻³ 2.0 × 10⁻³
Caffeine 3.7 × 10⁻³ 4.0 × 10⁻³ 3.3 × 10⁻³
Glycine 2.8 × 10⁻² 2.7 × 10⁻² 2.8 × 10⁻² l‑Cysteine 2.7 × 10⁻² 2.8 × 10⁻² 2.7 × 10⁻²
Tryptophan 2 × 10⁻³ 2.1 × 10⁻³ 2.1 × 10⁻³
Starch 3.8 × 10⁻³ 4.8 × 10⁻³ 4.5 × 10⁻³
Magnesium stearate 3.8 × 10⁻³ 4.0 × 10⁻³ 3.5 × 10⁻³
Lactose monohydrate 3.9 × 10⁻³ 4.7 × 10⁻³ 3.5 × 10⁻³
Glucose 3.7 × 10⁻² 4.3 × 10⁻² 3.3 × 10⁻²
Microcrystalline cellulose 3.5 × 10⁻³ 4.7 × 10⁻³ 4.6 × 10⁻³
-6.0 -5.5 -5.0 -4.5 -4.0 -3.5 -3.0
-80 -60 -40 -20 0 20 40 60 80 100
E, mV
log[MP] gama
Beta claxi
a significant difference were in the range of 1.29–1.77, which is lower than the tabulated F value (6.38) [34]. These results indicate that the two methods are equally accurate. The proposed sensors was used for the assay of methylphenidate in urine samples with good accu-racy and precision. The results are presented in Table 8.
Conclusions
Three novel PVC membrane sensors for methylpheni-date were constructed, optimized and valimethylpheni-dated. The investigated sensors used β-CD, γ-CD or 4-tert-butyl-calix[8]arene as ionophores (electroactive materials), in the presence of DOP as a plasticizer and KTpClPB as an Table 4 Day to day reproducibility of methylphenidate using methylphenidate -PVC membrane sensors
n = 5
Sensor 1 (β-CD), Sensor 2 (γ-CD) and Sensor 3 (calaxirene)
Parameter Methylphenidate (26.9 μg/mL)
Within‑day Methylphenidate (26.9 μg/mL)Within‑days
Sensor 1 Sensor 2 Sensor 3 Sensor 1 Sensor 2 Sensor 3
Found, μg/mL 27.10 26.97 27.3 26.21 26.12 26.96
R, % 100.74 100.26 101.48 97.43 97.1 100.23
SD 0.65 0.59 0.63 0.65 0.59 0.63
RSD 2.39 2.19 2.31 2.47 2.26 2.34
Table 5 Ruggedness and Robustness of the methylphenidate sensors
a Comparison between two instrument (HANNA pH 211 and WTW pH/mV meter (model 523; 8120 Weilheim, Germany
Parameters Sensor 1 Sensor 2 Sensor 3
Recovery, % RSD, % Recovery, % RSD, % Recovery, % RSD, %
Operators 1 98.52 2.2 98.0 2.16 99.24 2.45
2 98.33 2.3 98.5 3.34 99.21 2.75
Instrument 1a 98.51 2.3 98.0 2.53 99.12 2.62
2 98.41 2.4 97.5 3.64 98.51 2.53
Change in day
Intra‑day 100.74 2.38 100.26 2.18 101.33 2.21
Inter‑day 98.33 2.5 97.1 2.4 99.23 2.7
Life time during
After 8 weeks 97.5 3.9 97.0 3.8 98.0 3.96
Table 3 Analytical parameters of methylphenidate-PVC sensors
Sensor 1 (β-CD), Sensor 2 (γ-CD) and Sensor 3 (calaxirene)
SE standard error
Parameter Sensor 1 Sensor 2 Sensor 3
Slope, (mV/decade) 59.4 ± 0.5 51.37 ± 0.5 56.5 ± 0.5
Intercept, mV 220.45 ± 0.5 216.58 ± 0.5 248.17 ± 0.5
Calibration range 8 × 10⁻⁶–1 × 10⁻³ 8.0 × 10⁻⁶–1 × 10⁻³ 8.0 × 10⁻⁶–1 × 10⁻³
STE YX 0.816 2.85 0.816
SE slope 0.5574 2.02 0.5574
SE Intercept 2.357 8.25 2.357
Correlation coefficient, (r2) 0.999 0.999 0.996
Lower limit of quantification (LOQ), M 8 × 10⁻⁶ 8 × 10⁻⁶ 8 × 10⁻⁶
Lower limit of detection (LOD), M 7.5 × 10⁻⁶ 7 × 10⁻⁶ 7 × 10⁻⁶
Response time for 1 × 10⁻³ M solution, (S) 25 ± 0.5 25 ± 0.5 25 ± 0.5
additive dispersed in a PVC matrix. The sensors dem-onstrate a fast, accurate, selective, and Near-Nernstian response over a wide methylphenidate concentration
range in the pH range between 4 and 8. The detec-tion of methylphenidate using the developed meth-ods showed high accuracy and precision. β-CD show the best near-Nernstian behavior (59.5 mV) compared with γ-CD (51.37 ± 0.5) and claxiraine (56.5 ± 0.5). The determination of methylphenidate using the developed sensors was comparable with reported HPLC method-ology. The developed sensors were successfully used to detect methylphenidate in bulk, its formulation, and urine and therefore the method can be used in routine quality-control laboratories and urine sample.
Supplementary information
Supplementary information accompanies this paper at https ://doi. org/10.1186/s1306 5‑019‑0634‑3.
Additional file 1. Raw data of calibration curve, pH and response time.
Abbreviations
β‑CD: β‑cyclodextrin; γ‑CD: γ‑cyclodextrin; KTpClPB: potassium tetrakis (4‑chlorophenyl)borate; PVC: polyvinyl chloride; DBP: dibutyl phthalate; DOP: dioctyl phthalate; o‑NPOE: o‑nitrophenyloctyl ether; THF: tetrahydrofuran; CDs: cyclodextrins.
Acknowledgements
The authors extend their appreciation to the Deanship of Scientific Research at King Saud University for funding the work through the research group project No. RGP‑1436‑024.
Authors’ contributions
HA coordinated the study and reviewed the manuscript, MAN coordinated the study and reviewed the manuscript, HIA read and editing the MS and GAEM proposed the study and experimental part. All authors read the manu‑ script and participated in presenting the results and discussion. All authors read and approved the final manuscript.
Funding
Deanship of scientific Research at King Saud University (RGP‑1436‑024)
Availability of data and materials
All data and material analyzed or generated during this investigation are included in this published article
Competing interests
The authors declare that they no competing interests.
Author details
1 Pharmaceutical Chemistry Department, College of Pharmacy, King Saud
University, P.O. Box 2457, Riyadh 11451, Saudi Arabia. 2 Micro‑analytical Lab,
Applied Organic Chemistry Department, National Research Center, Dokki, Cairo, Egypt.
Table 6 Determination of methylphenidate using the proposed PVC membrane sensors
R %: recovery %, SD; standard deviation, RSD %: relative standard deviation % Sensor 1 (β-CD), Sensor 2 (γ-CD) and Sensor 3 (calaxirene)
Added conc., μg/mL Sensors 1
2.69 26.9 269.7 2697.7
Measured 2.64 26.76 267.69 2695.1
R, % 98.14 99.47 99.25 99.90
SD 0.09 0.64 4.84 56.86
RSD, % 3.41 2.39 1.81 2.11
Sensor 2
Added Conc., μg/mL 2.69 26.9 269.7 2697.7
Measured 2.63 26.36 264.95 2663.9
R, % 97.76 97.99 98.23 98.72
SD 0.1 0.66 5.91 52.72
RSD, % 3.80 2.51 2.23 1.96
Sensor 3
Added conc., μg/mL 2.69 26.9 269.7 2697.7
Measured 2.64 26.36 265.17 2649.9
R, % 98.14 97.99 98.51 98.21
SD 0.1 0.64 5.89 50.1
RSD, % 3.78 2.43 2.22 1.89
Table 7 Determination of methylphenidate in some pharmaceutical preparations using the membrane sensors
R %: recovery %, SD; standard deviation, RSD %: relative standard deviation %
Preparation Parameter Sensor 1 Sensor 2 Sensor 3 HPLC
Synthetic form,
5 mg Measured 4.93 4.92 4.96 4.97
R, % 98.6 98.4 99.20 99.4
SD 0.09 0.11 0.11 0.13
RSD, % 1.83 2.23 2.22 2.61
Ritalin tablet (10 mg)
Measured 9.92 9.92 9.8 9.9
R, % 98.0 98.5 98 99
SD 0.19 0.19 0.22 0.25
RSD 1.9 1.95 2.26 2.55
Ttest 0.14 0.14 0.71
Ftest 1.73 1.73 1.29
Methylphenidate tablet (10 mg)
Measured 9.91 9.85 9.81 9.85
R, % 99.1 98.5 98.1 98.5
SD 0.18 0.19 0.22 0.24
RSD, % 1.81 1.93 2.24 2.44
Ttest 0.49 0.5 1.05
Ftest 1.19 1.5 1.77
Table 8 Determination of methylphenidate in spiking urine sample using the proposed sensors
Urine sample Sensor 1 Sensor 2 Sensor 3 HPLC
Recovery, % 98.5 98.0 97.5 99.0
SD 0.084 0.092 0.081 0.077
•fast, convenient online submission •
thorough peer review by experienced researchers in your field • rapid publication on acceptance
• support for research data, including large and complex data types •
gold Open Access which fosters wider collaboration and increased citations maximum visibility for your research: over 100M website views per year •
At BMC, research is always in progress.
Learn more biomedcentral.com/submissions
Ready to submit your research? Choose BMC and benefit from: Received: 13 June 2019 Accepted: 10 September 2019
References
1. Hunt RD (2006) Functional roles of norepinephrine and dopamine in ADHD. Medscape Psychiatry. 2006:11
2. Arnsten AF, Li B‑M (2005) Neurobiology of executive functions: cat‑ echolamine influences on prefrontal cortical functions. Biol Psychiat 57:1377–1384
3. Stahl SM (2013) Stahl’s essential psychopharmacology: neuroscientific basis and practical applications. Cambridge University Press, Cambridge 4. Pokkula S, Thota S, Kumar VR, Nagabandi VK (2014) Development and
validation of RP‑HPLC method for the determination of methylphenidate hydrochloride in API. Int J PharmTech Res 6:462–467
5. Kumar CN, Kannappan N (2015) J Chem Pharm Res 7:606–629
6. Stegmann B, Dörfelt A, Haen E (2016) Quantification of methylphenidate, dexamphetamine, and atomoxetine in human serum and oral fluid by HPLC With fluorescence detection. Ther Drug Monit 38:98–107 7. Zhu H‑J, Wang J‑S, Patrick KS, Donovan JL, DeVane CL, Markowitz JS
(2007) A novel HPLC fluorescence method for the quantification of meth‑ ylphenidate in human plasma. J Chromatogr B 858:91–95
8. Wada M, Abe K, Ikeda R, Kikura‑Hanajiri R, Kuroda N, Nakashima K (2011) HPLC determination of methylphenidate and its metabolite, ritalinic acid, by high‑performance liquid chromatography with peroxyoxalate chemiluminescence detection. Anal Bioanal Chem 400:387–393 9. Waybright VB, Ma SH, Schug KA (2016) Validated multi drug determina‑
tion using liquid chromatography with tandem mass spectrometry for the evaluation of a commercial drug disposal product. J Sep Sci 39:1666–1674
10. Josefsson M, Rydberg I (2011) Determination of methylphenidate and ritalinic acid in blood, plasma and oral fluid from adolescents and adults using protein precipitation and liquid chromatography tandem mass spectrometry‑a method applied on clinical and forensic investigations. J Pharm Biomed Anal 55:1050–1059
11. Paterson SM, Moore GA, Florkowski CM, George PM (2012) Determination of methylphenidate and its metabolite ritalinic acid in urine by liquid chromatography/tandem mass spectrometry. J Chromatogr B 881:20–26 12. Marchei E, Farrè M, Pellegrini M, Rossi S, García‑Algar Ó, Vall O et al (2009)
Liquid Chromatography‑electrospray ionization mass spectrometry determination of methylphenidate and ritalinic acid in conventional and non‑conventional biological matrices. J Pharm Biomed Anal 49:434–439 13. Zhu H‑J, Patrick KS, Markowitz JS (2011) Enantiospecific determination
of dl‑methylphenidate and dl‑ethylphenidate in plasma by liquid chro‑ matography–tandem mass spectrometry: application to human ethanol interactions. J Chromatogr B 879:783–788
14. Aboul‑Enein HY, Ali I, Laguerre M, Felix G (2002) Molecular modeling of enantiomeric resolution of methylphenidate on cellulose tris benzoate chiral stationary phase. J Liquid Chromatogr Rel Technol 25:2739–2748 15. Aboul‑ Enein HY, Ali I (2002) Normal phase chiral HPLC of methylphe‑
nidate: comparison of different polysaccharide‑ based chiral stationary phases. Chirality 14:47–50
16. AlRabiah H, Abounassif M, Al‑Majed A, Mostafa G (2016) Comparative investigation of β‑and γ‑cyclodextrin as ionophores in potentiometric based sensors for naltrexone. Int J Electrochem Sci 11:4930–4942 17. Alrabiah H, Al‑Majed A, Abounassif M, Mostafa GA (2016) Ionophore‑
based potentiometric PVC membrane sensors for determination of phenobarbitone in pharmaceutical formulations. Acta Pharmaceutica. 66:503–514
18. Badawy SS, Youssef AF, Mutair AA (2004) Construction and performance characterization of ionselective electrodes for potentiometric determina‑ tion of phenylpropanolamine hydrochloride applying batch and flow injection analysis techniques. Anal Chim Acta 511:207–214 19. Rezk MS, El Nashar RM (2013) Dissolution testing and potentiometric
determination of famciclovir in pure, dosage forms and biological fluids. Bioelectrochemistry 89:26–33
20. Saber AL (2013) A PVC membrane sensor for potentiometric determina‑ tion of atorvastatin in biological samples and pharmaceutical prepara‑ tions. Electroanalysis 25:2707–2714
21. Hassan SS, Ghalia MA (2003) Amr A‑GE, Mohamed AH: new lead (II) selec‑ tive membrane potentiometric sensors based on chiral 2, 6‑bis‑pyridine‑ carboximide derivatives. Talanta 60:81–91
22. Ishimatsu R, Izadyar A, Kabagambe B, Kim Y, Kim J, Amemiya S (2011) Electrochemical mechanism of ion–ionophore recognition at plasticized polymer membrane/water interfaces. J Am Chem Soc 133:16300–16308 23. Ganjali M, Norouzi P, Rezapour M: Encyclopedia of sensors, potentiomet‑ ric ion sensors. Stevenson Ranch: American Scientific Publisher (ASP); 2006, vol. 8, p. 197–288
24. Ganjali MR, Norouzi P, Rezapour M, Faridbod F, Pourjavid MR (2006) Supra‑ molecular based membrane sensors. Sensors. 6:1018–1086
25. Steed JW, Turner DR, Wallace K (2007) Core concepts in supramolecular chemistry and nanochemistry. Wiley, New York
26. del Valle EM (2004) Cyclodextrins and their uses: a review. Process Bio‑ chem. 39:1033–1046
27. Link S, van Veggel F, Reinhoudt DN (2000) Sensor functionalities in self assembled monolayers. Adv Mater. 12:1315–1328
28. Bakker E, Telting‑Diaz M (2002) Electrochemical sensors. Anal Chem 74:2781–2800
29. Chen L, Zhang J, Zhao W, He X, Liu Y (2006) Double‑armed calix [4] arene amide derivatives as ionophores for lead ion‑selective electrodes. J Elec‑ troanal Chem 589:106–111
30. Zareh MM, Malinowska E (2007) Phosphorated Calix6arene derivatives as an ionophore for atropine‑selective membrane electrodes. J AOAC Int. 90:147–152
31. Challa R, Ahuja A, Ali J, Khar R (2005) Cyclodextrins in drug delivery: an updated review. AAPS PharmSciTech 6:E329
32. O’Neil MJ (2013) The Merck index: an encyclopedia of chemicals, drugs, and biologicals. RSC Publishing, New York, p 1132
33. Buck RP, Lindner E (1994) Recommendations for nomenclature of ion selective electrodes (IUPAC Recommendations 1994). Pure Appl Chem 66:2527–2536
34. Umezawa Y, Bühlmann P, Umezawa K, Tohda K, Amemiya S (2000) Potentiometric selectivity coefficients of ion‑selective electrodes. Part I. Inorganic cations (technical report). Pure and Applied Chemistry. 72:1851–2082
35. Miller JN, Miller JC (2005) Statistics and chemometrics for analytical chemistry. Pearson Education, London
Publisher’s Note
![Fig. 1 Chemical structure of a methylphenidate, b β ‑CD, c γ‑CD, and d 4‑tert‑butylcalix[8]arene](https://thumb-us.123doks.com/thumbv2/123dok_us/371150.2034279/2.595.60.540.89.409/fig-chemical-structure-methylphenidate-cd-tert-butylcalix-arene.webp)