M E T H O D O L O G Y
Open Access
Development and application of a high
throughput carbohydrate profiling technique for
analyzing plant cell wall polysaccharides and
carbohydrate active enzymes
Xiaofei Li
1, Peter Jackson
1, Denis V Rubtsov
1, Nuno Faria-Blanc
1, Jenny C Mortimer
1, Simon R Turner
2,
Kristian B Krogh
3, Katja S Johansen
3and Paul Dupree
1*Abstract
Background:Plant cell wall polysaccharide composition varies substantially between species, organs and
genotypes. Knowledge of the structure and composition of these polysaccharides, accompanied by a suite of well characterised glycosyl hydrolases will be important for the success of lignocellulosic biofuels. Current methods used to characterise enzymatically released plant oligosaccharides are relatively slow.
Results:A method and software was developed allowing the use of a DNA sequencer to profile oligosaccharides derived from plant cell wall polysaccharides (DNA sequencer-Assisted Saccharide analysis in High throughput, DASH). An ABI 3730xl, which can analyse 96 samples simultaneously by capillary electrophoresis, was used to separate fluorophore derivatised reducing mono- and oligo-saccharides from plant cell walls. Using electrophoresis mobility markers, oligosaccharide mobilities were standardised between experiments to enable reproducible oligosaccharide identification. These mobility markers can be flexibly designed to span the mobilities of oligosaccharides under investigation, and they have a fluorescence emission that is distinct from that of the saccharide labelling. Methods for relative and absolute quantitation of oligosaccharides are described. Analysis of a large number of samples is facilitated by the DASHboard software which was developed in parallel. Use of this method was exemplified by comparing xylan structure and content inArabidopsis thalianamutants affected in xylan synthesis. The product profiles of specific xylanases were also compared in order to identify enzymes with unusual oligosaccharide products.
Conclusions:The DASH method and DASHboard software can be used to carry out large-scale analyses of the compositional variation of plant cell walls and biomass, to compare plants with mutations in plant cell wall synthesis pathways, and to characterise novel carbohydrate active enzymes.
Keywords:DNA-sequencer, Cell wall, Glycosyl hydrolases, Glycosyl transferases
* Correspondence:[email protected] 1
Department of Biochemistry, Building O, Downing Site, University of Cambridge, Cambridge CB2 1QW, UK
Full list of author information is available at the end of the article
Background
The plant cell wall is a complex structure, consisting of polysaccharides, lignin and protein, and forms the major-ity of biomass on the planet. Enzymatic saccharification of cell wall polysaccharides (lignocellulosic biomass) is likely to be an excellent source of sustainable energy, particularly when fermented to produce liquid biofuels [1]. A major challenge for producing biofuels cost-effectively is the efficiency of hydrolysis of polysaccharides to fer-mentable sugars. This requires knowledge both of the composition and structure of the biomass, and also the manufacture of effective glycosyl hydrolase (GH) cocktails. The major polysaccharide of the cell wall is the semi-crystalline glucan, cellulose. In addition, there are hemi-celluloses (such as xylan and xyloglucan) and pectins (e.g. polygalacturonan and rhamnogalacturonan I) which coat the cellulose fibrils. There is large variability in the struc-ture of these polymers and in the composition of biomass from different plant organs, genotypes, species and between crops grown at different times [2], and therefore it will be important to be able to study the composition of biomass and the sugars released by GH cocktails in relatively high throughput and with simple and robust equipment.
Currently, many GH enzymes are assessed for their saccharification efficiency by colourimetric assays that quantify total sugars released, such as the dinitrosalicylic acid (DNS) assay, or 3-methyl-2benzothiazolinonehydrazone (MBTH) [3,4]. These methods support a high-throughput (HT) assay but do not provide detailed information on the sugars released. Alternatively, the released sugars can be structurally characterised individually e.g. by liquid chro-matography (LC) or mass spectrometry (MS), but these methods (as discussed below) are labour-intensive and un-suitable for screening a large number of samples [5].
Analysis of cell wall polysaccharides is also a challen-ging task due to their heterogeneity in monosaccharide composition, linkage and glycoside sequence. A variety of techniques have been applied to the problem. For ex-ample, Fourier-Transform Infrared analysis, FT-IR, to image intact cell walls, can identify broad architectural alterations in cell walls [6]. However, the disadvantage of this method is that it provides little detailed informa-tion about changes to the structure of individual poly-saccharides. More commonly, sequence and structural information is obtained by extraction and separation of polymers and fragmentation of the polymers to oligo-saccharides. Compositional information is obtained by complete hydrolysis of the polymers to monosaccharides [7]. However, the fractionating process is time consuming, and the resulting oligosaccharide fractions are still com-plex mixtures, often confounding analysis using NMR and MS.
Another approach is to use specific GHs to digest the plant polysaccharide of interest to produce oligosaccharides
which retain enough structural linkage information to de-termine the polysaccharide fine structure. For example, high performance anion exchange chromatography with pulsed amperometric detection (HPAEC-PAD) has been applied successfully to separate oligosaccharides [8]. HPAEC-PAD uses high ionic eluents that make on-line MS identification of oligosaccharides difficult. In addition, HPAEC-PAD can quantify oligosaccharides only if standards are available. Hydrophobic Interaction (HILIC)-HPLC coupled with matrix-assisted laser desorption/ ionization-time-of flight/time-of-flight (MALDI-TOF/TOF) tandem MS has successfully been used to elucidate the structure of isomeric arabinoxylan oligosaccharides [8,9]. However, whilst HILIC coupled with MALDI-TOF/TOF MS can characterize unknown oligosaccharides, it can-not provide quantitative information without isotopic labelling [10].
Some of these disadvantages were overcome by the de-velopment of the PACE (Polysaccharide Analysis by Carbohydrate gel Electrophoresis) method, in which the reducing end of plant polysaccharide-derived oligosaccha-rides (released by hydrolases or other carbohydrate active enzymes) are labelled with a fluorophore by reductive amination, and then separated by polyacrylamide gel electrophoresis [11]. The method is robust and simple re-quiring little specialist equipment, but PACE is a relatively low throughput method requiring considerable user time.
An additional electrophoretic analytical technique uses capillary electrophoresis with laser-induced fluorescence (CE-LIF). CE-LIF is a powerful technique offering high detection sensitivity and good resolving capacity for the analysis of 9-aminopyrene-1, 4, 6-trisulfonate (APTS) la-belled carbohydrates [12-15]. The method provides a possibility for quantification of carbohydrates by adding internal standards. Although numerous researchers have developed and used the method e.g. [16-20], it has sig-nificant limitations in terms of throughput.
Here, we present a high throughput method for quan-titative analysis of plant cell wall polysaccharides using a 96 capillary array DNA sequencer (ABI 3730xl). We call this method DNA sequencer-Assisted Saccharide analysis in High throughput (DASH). In order to demonstrate the use of DASH for comparison of polysaccharide structures in plant biomass samples, the xylan structure ofArabidopsis
xylan synthesis mutants was analysed. Additionally, DASH was used to investigate the substrate specificity of GHs, and to classify them by their product profiles.
Results and discussion
Oligosaccharide separation using a capillary DNA sequencer
We first investigated the capability of CE-LIF in the ABI 3730xl DNA sequencer to resolve oligosaccharides pre-pared from plant cell wall polysaccharides. β-1,4 xylan oligosaccharides with degree of polymerization (DP) 1 to 6 were mixed with a dextran (α-1,6 glucan) ladder, and labelled with a single APTS at their reducing end. After dilution of samples to ~1 pmol in a 96-well microtitre plate, the samples were electrophoresed in parallel. The injection and running conditions were as described in Table 1. The APTS labelled oligosaccharides were detected in the blue channel of the DNA sequencer. As previously reported for separation of starch and protein N-glycans [21,25], the elec-tropherogram traces demonstrated a good separation of xylan oligosaccharides (Figure 1A). Xylan oligomers were also well resolved from the dextran (Glc) oligomers. Oli-gosaccharides with higher DPs have lower electrophoretic mobility, but unlike liquid chromatography separations, they remain widely spaced (Figure 1A). In a 50 minute electrophoresis (8000 datapoints), the largest dextran oligosaccharide detected had a DP of 16. Dextran oligo-saccharides with DP up to 35 were detected by using double the electrophoresis run time (Figure 1B), illustrat-ing the flexibility of the method in targeting
oligosaccharides with a wide range of sizes. The presence of nuisance peaks at the beginning of traces (up to ap-proximately 900 datapoints) that arise due to unreacted APTS or other labelling reaction artefacts, do not inter-fere with monosaccharide or oligosaccharide peaks, the first of which appears at around 1000 datapoints (Figure 1A).
Oligosaccharide fluorescence quantitation and detection limits
The relative quantity of different APTS labelled oligosac-charides within a sample can be determined by the rela-tive fluorescence intensity of the corresponding peaks, if the oligosaccharides are equally efficiently labelled with APTS. The fluorescence detection system has an upper
Table 1 Data acquisition settings for DASH
Name Value
Oven temperature 30°C
Current stability 30μA
Prerun voltage 15 kV
Prerun time 30 s
Injection voltage 2 kV
Injection time 20 s
Voltage number of steps 10
Voltage step interval 20 s
Data delay time 500 s
Run voltage 15 kV
Run time 50 (or 100) min
Ramp delay 1 s
1 2 3 4 5 6 7
0 X1
RFU
3.5
3
2.5
2
1.5
1
0.5 G
G2
G12 G16
Datapoints
A
0.7 0.8 0.9 1.0 1.1 1.2 1.3 1.4 1.5 0
0.5 1 1.5 2 3 4
G16 3.5
2.5 G14
G19
RFU
B
G25 G22
G29
G35
X2
G8 X3
G3G4
X4 X5
G5 X6
G6
Datapoints
x103
x104
x103
x103
Figure 1Separation of APTS-labelled oligosaccharides by CE in
an ABI 3730xl DNA sequencer. (A)Electropherogram trace (50 min)
limit of 35,000 relative fluorescence units (RFU) above which the response is saturated (data not shown). To de-termine the lower fluorescence unit limit for reproducible quantitation of oligosaccharides, a dextran ladder com-prising a range of different quantities was analysed. To obtain comparable values between different CE traces, the peak area ratio and the peak height ratio between all adjacent DP peaks (Pn-1/Pn) were determined with
DASH-board software (see methods). The variation in these ra-tios between 12 samples run in parallel was determined, and the coefficient of variation (CV) was calculated for oligosaccharides with a range of abundances (Figure 2). Peaks with a height over 400 RFU and peak area over 24,000 RFU2were highly reproducible with a CV of less than 5%. Peaks with values lower than these resulted in lower reproducibility. Using standard oligosaccharides of known quantity, the quantity of oligosaccharide in the sample corresponding to the minimum RFU was deter-mined to be approximately 50 fmol. The method is
therefore highly sensitive. Moreover, below this limit of re-producible quantitation, the smallest detectable peak was about 50 RFU in height, corresponding to approximately 6 fmol.
Linearity of saccharide derivatisation with APTS
APTS derivatisation must be proportional to oligosaccharide quantity in order to ensure reproducible and accurate quan-titation. Carbohydrates with reducing ends could be com-pletely derivatised with APTS through reductive amination. However, in practice the reaction may not go to comple-tion, and the rate of labelling for different saccharides may vary, perhaps because different reducing carbohydrates have variations in the proportion or rate of interconver-sion between open versus closed ring-structures [26]. It has also been reported that insufficient APTS in the label-ling reaction may cause preferential derivatisation of cer-tain saccharides [27]. These issues may lead to different labelling efficiencies in a mixture of saccharides.
Therefore the linearity of saccharide derivatisation with the APTS fluorophore was investigated. Derivatisation protocols based on the method of Jackson [28] were optimised to ensure maximum saccharide labelling (data not shown), and the resulting labelling protocol is de-scribed in materials and methods. Figure 3 shows the rela-tionship between maltose quantity and peak area (relative to a constant pre-labelled standard) . Keeping the APTS quantity constant at 200 nmol, with increasing sugar quantities in the labelling reaction, the peak area increased linearly until the sugar quantity reached about 200 nmol (R2 = 0.99). For greater oligosaccharide quantities, it is likely that saturation occurred due to the decrease in available APTS. Therefore, in the labelling protocol the quantity of all reducing sugars must be less than 200 nmol. Unknown amounts of reducing sugars can be determined relative to quantitation standards (QS) labelled together with these sugars. However, even in the presence of excess
120
100
80
60
40
20
0
0 2 4 6 8 10 12
Peak Heights (RFU)
Coefficient of Variation (Pn-1/Pn; %)
250
200
150
Peak Areas (RFU2)
100
50
0
A
B
400 RFU
24,000 RFU2
x103
x103
Coefficient of Variation (Pn-1/Pn; %) 0 50 100 150 200 250 300
Figure 2Reproducibility of quantitation of oligosaccharides in
parallel capillaries. (A)Peak height measurements are highly
reproducible.(B)Peak area measurements are highly reproducible. Below approximately height 400 RFU or area 20000 RFU2, the
measurements are less reproducible.
10 20 30 40 50 60
40 120
0 200 280 360 440 520
Maltose quantity (nmol)
Relative Peak Area
APTS, we found that labelled xylo-oligosaccharides gave more fluorescence than corresponding quantities of gluco-oligosaccharides (Additional file 1: Figure S1). Therefore the difference in labelling efficiency between sample and QS saccharides should be taken into account in quantitation calculations. Ideally, the QS should have the same reducing end saccharide as the analysed sugars to ensure equivalent labelling and accurate quantitation.
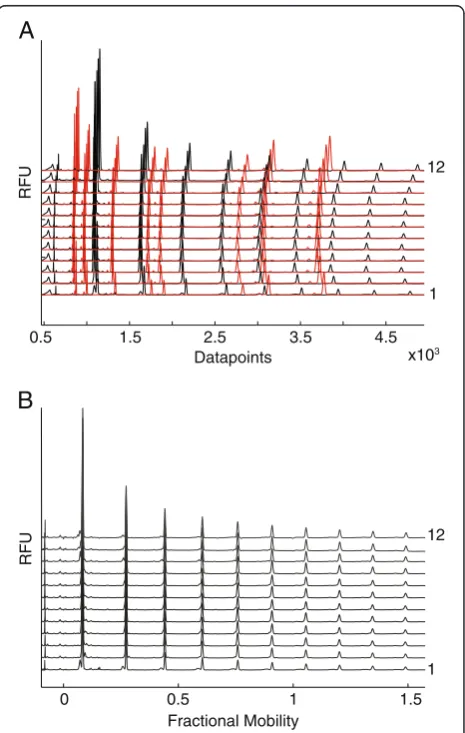
Mobility markers can be used to align traces
The mobilities of APTS-labelled saccharides, when electro-phoresed simultaneously in separate capillaries, show small but significant variations. Consequently, fluorescence peaks of a specific analyte may be detected at substantially differ-ent trace data points. This prevdiffer-ents confiddiffer-ent iddiffer-entification of saccharides when using the peak data point. Moreover, in addition to variation in absolute elution time (shifts be-tween traces), variation is also observed in the difference between elution times of pairs of analytes (for example through compression of regions of traces). In order to overcome these problems mobility markers (MMs) can be introduced to normalize the electropherogram traces. APTS-tagged glycan mobility markers that bracket the region of interest have been explored previously by vari-ous groups, but the traces are not aligned with sufficient accuracy for confident assignment of all analytes [15,29]. Trace alignment would be improved by employing markers throughout the region of interest, but there is potential co-migration of analytes with the APTS-tagged mobility marker sugars. To calibrate precisely oligosaccharide mo-bility data, we developed a new type of MM, using the ability of the ABI 3730xl system and similar DNA se-quencers to detect multiple (usually five) colour dyes in a single capillary. Firstly, the MMs introduced here were la-belled with the fluorophore DY-481XL, which has a fluor-escence emission at a much longer wavelength (650 nm) than APTS (512 nm). The fluorescence of both can be easily resolved spectrally by the DNA sequencer and en-sures effectively no detection of either fluorophore in the detection channel of the other fluorophore. Secondly, the fluorophore is conjugated to amino acids or short peptides that have different migration times. Targeted selection of different peptides allows the position of the MMs to be tuned to span the migration of the oligosaccharide analytes under study.
To investigate the accuracy of trace alignment, eight MMs labelled with DY-481XL were selected to span dex-tran oligosaccharides DP1 to DP6. These were added to each APTS labelled glycan sample prior to electrophoresis. The MMs and APTS-labelled sugars were monitored in two different channels, shown with red and black colours respectively in Figure 4A. The eight MMs have a range of different mobilities allowing accurate alignment along the entire saccharide profile. Alignment of oligosaccharide
traces was carried out with the DASHboard software. After alignment, the oligosaccharide mobilities are expressed as a fractional mobility value, where zero is the mobility of the fastest MM and one is the mobility of the slowest MM. The alignment of the traces substantially reduced the variations in oligosaccharide mobility in parallel ca-pillaries (Figure 4B). The fractional mobility of some oli-gosaccharides is shown in Additional file 2: Table S1.
Polysaccharide analysis ofArabidopsiscell walls
Enzymatic digestion is a useful tool for elucidation of structural information and for quantitating polysaccha-rides and oligosacchapolysaccha-rides [11]. To investigate whether DASH could allow reliable quantitation of polysaccharides in complex mixtures derived from the plant cell wall, we analysed the structure and quantity of xylan inArabidopsis
0.5 1.5 2.5 3.5 4.5
Datapoints
0.5 1 1.5
Fractional Mobility 0
A
B
RFU
RFU
1 12
1 12 x103
Figure 4Normalization of oligosaccharide mobility using internal markers with spectral properties distinct from
APTS-labelled oligosaccharides. (A)Dextran ladder (black) and
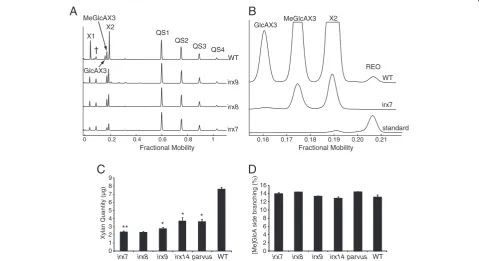
xylan synthesis mutants [30]. A number of proteins have been identified as putative glycosyltransferases (GTs) in xylan synthesis. IRX9 and IRX14 are involved in xylan backbone synthesis [30,31]. IRX7, IRX8 and PARVUS are required, in an unknown manner, for synthesis of a short xylan reducing end oligosaccharide (REO) [30-32]. Cell wall (100μg) was pre-treated with alkali to make the xylan more accessible to hydrolytic enzymes. The enzyme-accessible xylan was then completely digested by adding excess GH family 10 (GH10) β-xylanase (CjXyn10A), and the released xylo-oligosaccharides quantifed by DASH, using QS. The total reducing sugar quantity in each sample was below 200 nmol, to ensure reproducible derivatisation as described above.
Figure 5A shows the profile of wild-type (WT) and threeirxmutants. The traces of digested WT xylan revealed four abundant enzyme-specific peaks. The products of the GH10 enzyme digestion of Arabidopsis glucuronoxylan are well known [30]. The peaks on DASH were therefore easily identified as Xyl, (Xyl)2, glucuronic acid (GlcA)
(Xyl)3 and 4-O-methyl glucuronic acid (MeGlcA) (Xyl)3.
There was relatively little background in the region of Xyl, (Xyl)2allowing analysis of monosaccharides and small
oli-gosaccharides without sample clean-up. In contrast to
PACE, it was possible to resolve GlcA(Xyl)3and MeGlcA
(Xyl)3oligosaccharides (together named [Me]GlcA(Xyl)3).
This is noteworthy as the two structures only differ in the presence of a 4-O-methyl ether leading to a size difference of only 14 Da. The CjXyn10A fingerprint of the irx mu-tants show only three major products: Xyl, (Xyl)2 and
MeGlcA(Xyl)3. Unmethylated GlcA is absent, which is
consistent with previous data from MS [30]. Also
consist-ent with other studies, peak heights and areas are reduced in the mutants compared to WT suggesting lower levels of xylan [30,31]. In addition, a low abundance oligosac-charide can be detected migrating at fractional mobility 0.207. Co-migration with a standard showed the oligosac-charide to be the REO of xylan (Figure 5B). Consistent with previous data, this oligosaccharide was absent in the three mutants irx7, irx8and parvus (Figure 5B and data not shown), [30,31]. The ability to detect the REO, which is present at one copy per xylan polysaccharide molecule, demonstrates the sensitivity of the DASH technique.
The absolute quantity of xylan in five mutants was calcu-lated by using internal quantitative standards (Figure 5C). As expected, all mutants show a large decrease in xylan quantity compared to the WT. The [Me]GlcA branching frequency was calculated and found not to differ signifi-cantly between the mutants and WT plants (Figure 5D), again consistent with previous reports [30].
Xylan Quantity (µg)
B
A
7 9
WT
irx7 irx8 irx9 irx14 parvus irx7 irx8 irx9 irx14 parvus WT
0 1 2 3 4 5 6 8
0 2 4 6 8 10 12 14 16
[Me]GlcA side branching (%)
0.16 0.17 0.18 0.19 0.20 0.21
standard WT
irx7
Fractional Mobility MeGlcAX3 X2 GlcAX3
REO
D
C
0 0.2 0.4 0.6 0.8 1
WT
irx9
irx8
irx7
QS1 QS2
QS3 QS4 X1
X2
GlcAX3 MeGlcAX3
Fractional Mobility
†
** *
* *
Figure 5Analysis of xylan structure and quantity by DASH.Stem cell wall xylan of Wild type (WT) and mutantArabidopsis irx7,irx8,irx9, irx14
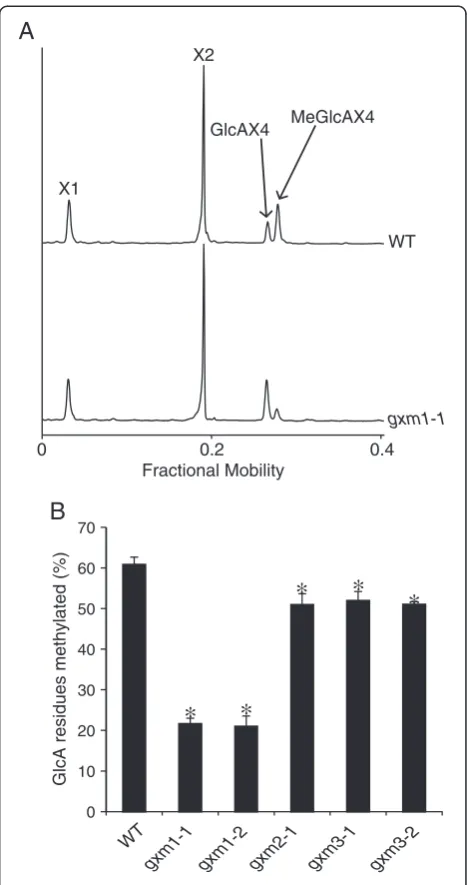
To further illustrate the power of DASH to resolve closely migrating oligosaccharides, we characterised further mutants in three closely related proteins in the DUF579 family. We previously found some members of this putative methyltransferase family to be localised in the Golgi appar-atus [33]. Three DUF579 proteins, related to but distinct from IRX15 and IRX15L, are co-expressed with xylan syn-thesis enzymes [33,34]. One of these, GXM1, was recently shown to be a xylan GlcA methyltransferase [35]. The structure of xylan in this mutant was investigated by DASH using excess GH family 11 (GH11)β-xylanase (NpXyl11A). As shown in Figure 6A, the digestion profile of WT and
gxm1traces presents Xyl, (Xyl)2, GlcA(Xyl)4and MeGlcA
(Xyl)4. As expected, the proportions of GlcA(Xyl)4 and
MeGlcA(Xyl)4were significantly altered in gxm1
com-pared to WT. To investigate whether GlcA methylation is dependent on additional DUF579 proteins, the struc-ture of enzyme-accessible xylan was investigated in mu-tants of the three DUF579 proteins gxm1, gxm2 and
gxm3. Using peak areas of the GH11-released substituted xylan oligosaccharides, the percentage of methylated GlcA residues was calculated in two independent alleles for each mutant (Figure 6B; we were unable to obtain a second null allele for gxm2). All mutants showed decreased methyla-tion in comparison to WT, which has 61% of GlcA meth-ylated. gxm1 has a reduction of methylation to 21% of GlcA (a reduction of 65% compared to WT), which is similar to previously obtained data by 1H NMR spectros-copy [35].gxm2 andgxm3 each have a small but signifi-cant decrease in methylated GlcA to 51% (a reduction of 16% compared to WT). These figures are consistent with a recent examination of one allele of the mutants by NMR [36] and confirmed the reproducible and quantitative na-ture of the DASH analysis.
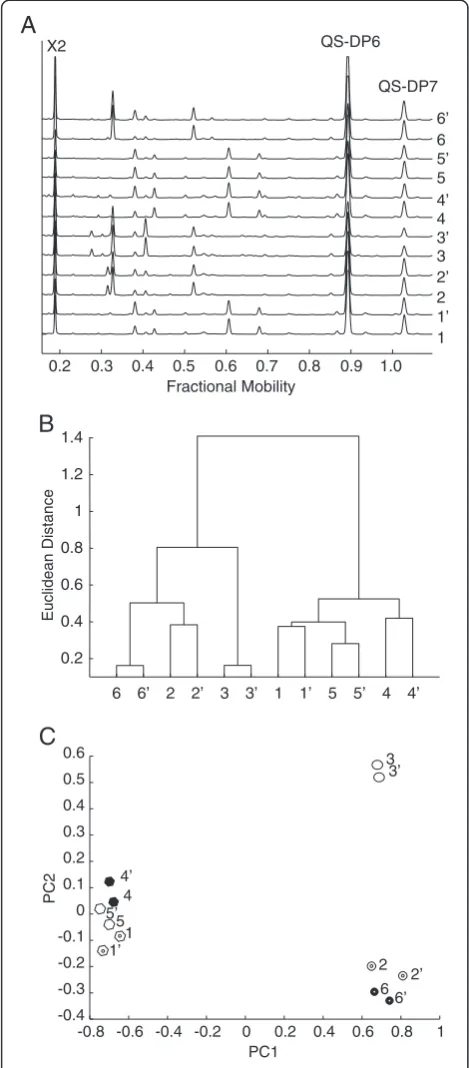
Screening novel hydrolytic enzymes
Fingerprinting of polysaccharide hydrolase product pro-files may reveal differences in enzyme activity. We in-vestigated whether the technique could reveal product differences between related xylanase enzymes. Figure 7A shows aligned traces of duplicate digests of wheat flour arabinoxylan (WAX) with six different hydrolytic en-zymes. The traces show that the enzymes released several arabinoxylan oligosaccharides. The oligosaccharides were quantified using two QS (DP6, DP7). The enzyme prod-ucts were grouped by hierarchical clustering of these oligosaccharide abundances (Figure 7B). Pairs of duplicate digests clustered together. Based on the pattern of oli-gosaccharides released after digestion, the hydrolytic en-zymes were clearly separated in two different groups. These groups correspond to enzymes from CAZy family GH10 (Enzymes 2, 3, 6) and GH11 (Enzymes 1, 4, 5). Principal component analysis (PCA) of the same data also resolved these two groups along PC1 (Figure 7C).
However, PC2 additionally separated GH10 enzyme 3 from the other GH10 enzymes, indicating that the en-zyme produced different oligosaccharide products.
Conclusion
DASH profiling of plant cell wall polysaccharides is a fast method to detect and quantify oligosaccharides released
∗
∗
∗
∗
∗
WT
gxm1-1 gxm1-2 gxm2-1 gxm3-1 gxm3-2
GlcA residues methylated (%)
0 10 20 30 40 50 60 70
X1
MeGlcAX4 GlcAX4
X2
A
B
WT
gxm1-1
Fractional Mobility
0 0.2 0.4
Figure 6Identification of xylan glucuronoxylan
O-methyltransferases (GXM) by DASH.Stem cell wall xylan of
Wild type (WT) andgxmmutants was hydrolysed withNpXyn11A. (A)Aligned electropherograms ofNpXyn11A digests of WT and
gxm1AIR show altered proportions of methylated and unmethylated GlcAX4.(B)Proportion of MeGlcA substitution of
from plant biomass by hydrolytic enzymes. DASH can provide absolute quantitation of products and information on the identity of oligosaccharides. The sensitivity of DASH is at the fmol level, requiring only a fewμg of cell wall material, making microanalysis of different plant tissues feasible. A drawback of oligosaccharide mobility variation from capillary to capillary and from run to run has been resolved by using adjustible mobility markers. The markers developed here enable the standardisation of mobility from different experiments and equipment, without interfering with APTS-labelled sugar mobilities or their detection. Identification of peaks from aligned DASH traces is more accurate, which is essential for identification of peaks which migrate closely together. The tailor-made software package DASHboard ensures quick and flexible analysis of the data generated.
Validation of DASH as a method for analysing plant cell wall mutants was performed using a set of known xylan synthesis mutants, and the results were consistent with published data. DASH was then used to quantify the importance of methyltransferases that methylate GlcA on xylan. This was only possible due to the high reproduci-bility in separation and migration of GlcA and MeGlcA substituted xylo-oligosaccharides by DASH using the MMs. DASH was also validated as a high-throughput method for characterisation and classification of enzymes based on their products, here shown for different xylanases. All in all, DASH in combination with the DASHboard data analysis allows the identification of differences in charide patterns derived from different cell wall oligosac-charides and products of diverse hydrolases to be analysed in high throughput with high reproducibility.
Identification of unknown oligosaccharide peaks could involve comigration studies with standards or determin-ation of oligosaccharide sensitivity to diagnostic glycosi-dases. In the future, a DASH oligosaccharide mobility library will be established, to assist in the automatic identification of oligosaccharides from plant biomass. Data will be transferrable between research groups, due to the consistency in mobility provided by the MMs.
Methods
Reagents
Endo-β-1,4-xylanases in CAZy family GH10 (CjXyn10A fromCellvibrio japonicusandCmXyn10A fromCellvibrio mixtus) and GH 11 (NpXyn11A from Neocallimastix patriciarumandEvXyn11 from an uncultured bacterium) were a generous gift from Professor Harry Gilbert and Dr David Bolam (University of Newcastle, Newcastle-upon-Tyne, UK). Endo-β-1,4-xylanases NZGH10 and NZGH11 were a generous donation from Novozymes A/S (Bagsvaerd, Denmark). 8-Aminopyrene-1,3,6-trisulfonic acid, trisodium salt (APTS) was supplied by (Biotium, Cambridge Bio-Science, Cambridge, UK). The malto-oligosaccharides
QS-DP6
QS-DP7
1 1’ 2 2’ 3 3’ 4 5 5’
4’ 6 6’ X2
6 6’ 2 2’ 3 3’ 1 1’ 5 5’ 4 4’ 0.2
0.4 0.6 0.8 1 1.2 1.4
Euclidean Distance
-0.8 -0.6 -0.4 -0.2 0 0.2 0.4 0.6 0.8 1 -0.4
-0.3 -0.2 -0.1 0 0.1 0.2 0.3 0.4 0.5 0.6
1 1’
6’ 6
3 3’
4 4’
5’5
2’ 2
Fractional Mobility
B
C
A
0.2 0.3 0.4 0.5 0.6 0.7 0.8 0.9 1.0
PC1
PC2
Figure 7Quantitative analysis of oligosaccharides released by
wheat arabinoxylan hydrolysis with different xylanases. (A)Aligned
DP4-7 (maltotetraose (Glc-4), maltopentaose (Glc-5), maltohexaose (Glc-6) and maltoheptaose (Glc-7)), man-nose, cellobiose, Dextran 10 and sodium cyanoborohydride (NaCNHB3) were supplied by Sigma-Aldrich Co. Ltd
(Dorset, UK). The xylo-oligosaccharides (DP1-6) and wheat arabinoxylan (WAX) were supplied by Megazyme (Megazyme International Ireland, Bray, Ireland). Hi-Di™ formamide was supplied by Applied Biosystems (Life technologies, Paisley, UK). A set of 7 amino acids and peptides was selected for use as components of the elec-trophoretic mobility standards used in this study as fol-lows, listed in order of decreasing electrophoretic mobility of their fluorophore derivatives; Asp-Asp-Asp-Asp (Bachem AG, Bubendorf, Switzerland), Asp-Asp-Asp (Bachem), Glu-Glu (Sigma-Aldrich), Cysteic acid (Sigma-Aldrich), L-2-Aminoadipic acid Aldrich), Glycine (Sigma-Aldrich), Gly-Gly-Gly (Sigma-Aldrich). The fluorophore for the mobility standards, DY-481XL-NHS ester, was obtained from Dyomics Gmbh, Jena, Germany.
Plant material
Arabidopsis thaliana material used was as follows: wild type (WT; ecotype Col0); irx7, irx8, irx9, irx14, and
parvus as described in [30]; gxm1-1 (SALK_018081),
gxm2-1 (SALK_084669) and gxm3-1 (SALK_050883) as described in [34]. Seeds of T-DNA insertion lines GK-677C12_023105 (gxm3-2) and SALK_087114 (gxm1-2) were obtained from the Nottingham Arabidopsis Stock Centre, homozygous lines isolated, and confirmed as null mutants as described in [30]. Plants were grown on soil (Levington M3) in a growth room (21°C, 100μmol m−2s−1, 16 h light/8 h dark, 60% humidity). Basal stem material was harvested once the stem had at least 10 siliques (6–7 weeks after germination) andwere incubated in 96% (v/v) ethanol (70°C, 30 mins) to inactivate enzymes.
The stems were ground to a homogenised powder using a ball mixer mill (Glen Creston Ltd, Midddlesex, UK), and used to prepare alcohol insoluble residue (AIR). The solid matter was collected by centrifugation (10 mins, 4,000 x g), and washed using the following steps: 100% (v/v) ethanol, twice with chloroform:methanol (2:1 (v/v)), fol-lowed by successive washes with 65% (v/v), 80% (v/v) and 100% (v/v) aqueous ethanol. The pellet was then air dried at 40°C overnight.
Enzymatic hydrolysis of the cell wall extract for DASH fingerprinting
AIR (100 μg) was treated with 4 M NaOH (20 μL) for 1 h at room temperature (approx. 22°C) before adjusting the pH to pH 5–6 with 1 M HCl. Enzyme digests were performed in 500 μl 0.1 M ammonium acetate pH 6.0, and enzyme quantity was adjusted to ensure complete hydrolysis. The mixtures were boiled for 30 min to stop the reaction.
Quantitative standards
The QS were prepared by combining maltotetraose (QS1), maltopentaose (QS2), maltohexaose (QS3) and maltoheptaose (QS4) in the molar ratios, 20:15:8:3. A total of 46 nmol of the 4 saccharides were added, in aqueous solution to the sample (e.g. enzyme digests). The mixtures were dried using a centrifugal vacuum evaporator CVE prior to label-ling with APTS.
Mobility markers
The mobility standards were prepared from an initial set of 26 labelled amines, either amino acids or peptides that were each derivatised separately through their primary amino groups with the fluorophore DY-481XL-NHS ester (Additional file 3: Figure S2). Each amine served to modu-late the electrophoretic mobility of each fluorescent de-rivative of which it comprised. The resulting fluorescent derivatives had net charges ranging from −1 to −5 and molecular weight from 75.07 to 478.37. From these, seven standards (see Reagents) were selected to provide a set with a range of mobilities that extended from faster-than to slower-than any of the APTS-labelled saccharides analysed in this work. One additional mobility marker was not comprised by an amino acid or peptide but was a by-product of the labelling reaction. Other amines can be used to prepare mobility standards suitable for other investigations.
A 10 mM solution of each amine was prepared in 0.1 M NaHCO3. A 0.4 mM solution of the fluorophore
DY-481xl-NHS ester was freshly prepared in dimethylsulfoxide. The mixture of DY-481xl-NHS ester (2.5 μl) and each amine (2.5μl) was incubated for 60 min at room temp (22°C) in the dark and shaken vigorously for 10 sec every 5 min. Unreacted amines in the mixture were not detected by the DNA analyser. Each amine was labelled in a separate reac-tion. The reaction mixtures were each diluted with 0.5 mL water and stored as stock solutions at −20°C. The final working solution was a dilution of 10μl of the stock with 390μL water.
The samples were tested individually in the DNA se-quencer to determine the peak heights by drying 2μL and 5μL final working solution from each in a 96-well micro-titre plate using a CVE. The samples were dissolved in 20μL formamide and analysed using the red channel of the DNA sequencer. The peak profiles for each of the se-lected standards was examined and the individual concen-trated standards solutions mixed in appropriate amounts so that the peak heights of all the standards were approxi-mately the same. The same volume of the mix of stan-dards was added to each sample.
APTS labelling and analysis of the labelled saccharides
A fresh solution of 0.1 M NaCNBH3 was prepared in
water. The dried QS and oligosaccharide sample mixture were combined with 10 μL APTS and 10 μL NaCNBH3
solutions. Samples were mixed well, centrifuged briefly to bring the reaction mix to the tip of the tube and incu-bated in a (CVE) at 37°C for 6 h without vacuum.
The labelling reaction mixtures were diluted with water: for a reaction containing 100 nmol of total saccharide a dilution of 104-fold was typical. Multiple different dilu-tions were tested to ensure that low abundance saccha-rides were detectable. Typically, a volume containing approximately 1 pmol of treated saccharide was placed in a well of a 96-well microtitre plate suitable for use with a DNA sequencer. The electrophoresis mobility marker solution (10μL; preparation is described below) was added to each sample in the 96-well plate and dried in a CVE. Hi-Di™ formamide (20 μL, Invitrogen) was added to each sample well and the plate was shaken vig-orously for 1 h to solubilise the labelled saccharides. The plate was used directly for sample analysis in an ABI 3730xl 96-sample DNA sequencer using the stand-ard DNA analysis buffer system, and the settings described in Table 1. If necessary the fluorescence detection system can be calibrated to ensure that no fluorescence from the mobility standards (red channel) is detected in the blue channel used for the detection of the APTS-labelled sac-charides and vice-versa. With standard DNA detection parameters there was no cross-over between the red and the blue channels.
Screening hydrolytic enzymes
WAX (30μg) was incubated overnight with the endo-β -1,4-xylanases in 500μl 0.1 M ammonium acetate pH 6.0. The digestions were stopped by boiling for 30 minutes, and a reduced set of QS added (QS6 and QS7 only, due to co-migration of QS4 and QS5 with xylanase-digestion products of WAX). Following drying by CVE, the samples were derivatised with APTS, diluted and analysed using an ABI 3730xl DNA sequencer.
Data analysis and the DASHboard software
DASH data generated by the DNA sequencer (.fsa file format) were processed in DASHboard software, which was written and developed using MATLAB (Mathworks Inc). The DASHboard software tool is designed to com-plement the profiling technique and perform essential data processing tasks such as reading the results of the scan, visualisation, peak quantification and export to Excel (.xls format) for further analysis. DASH files were loaded into DASHboard for data visualisation of the fluorescence peak profiles of the CE separations. DASHboard was used to align the peak profiles using the mobility standards that were present in every sample. Therefore, the
profiles of the APTS-labelled saccharides in any sample could be overlaid exactly.
Quantitation of APTS-labelled saccharides was carried out using internal quantitative standards and analysis with the DASHboard software. A standard curve of peak areas versus the corresponding molar quantity of each APTS-labelled QS was used to determine the quantity of each APTS-labelled oligosaccharide.
For example, to calculate theArabidopsisxylan quantity from a GH10 xylanase digestion, where the identity of all oligosaccharides is known, it was assumed that the xylanase digestions had gone to completion. Therefore, all the xylan was present as Xyl, (Xyl)2, GlcA(Xyl)3and MeGlcA(Xyl)3.
Xylose present in the digested xylan was the sum of the quantity of each of these digestion products multiplied by the number of xylose residues present in each structure: total Xyl = ((Xyl)1 x 1 + (Xyl)2 x 2 + GlcA(Xyl)3 x 3 +
MeGlcA(Xyl)3x 3).
Statistical analysis was also performed in DASHboard. Hierarchical clustering and PCA approaches were used to analyse rapidly cell wall data for classification and characterisation.
The DASHboard software tool will be made available on request.
Additional files
Additional file 1: Figure S1.Labelling efficiency of various
monosaccharide and oligosaccharides. 100 nmol of each saccharide was labelled with APTS and the fluorescence detected of the labelled saccharides is expressed relative to glucose. n=3, ±SD.
Additional file 2: Table S1.Fractional mobilities (FM) of some common monosaccharides and oligosaccharides used in the study of plant secondary cell walls. The samples are as follows: G1-G12–acid hydrolysed dextran (α1,6-linked Glc), X1-6 - (β1,4-linked Xyl), M1-6 - (β 1,4-linked Man). Xylo-oligosaccharides carryingα1,2 [Me]GlcA are well-characterised products of glucuronoxylan digestion with xylanases in CAZy families GH10 and GH11.
Additional file 3: Figure S2.Structure of DY-481XL fluorophore label of MMs.
Abbreviations
AIR:Alcohol insoluble residue; APTS: 8-aminopyrene-1, 4, 6-trisulfonate; CAZy: Carbohydrate active enzyme database; CE-LIF: Capillary electrophoresis with laser-induced fluorescence; CVE: Centrifugal vacuum evaporator; DASH: DNA sequencer-Assisted Saccharide analysis in High throughput; DP: Degree of polymerization; DNS: Dinitrosalicyclic acid; FT-IR: Fourier-Transform Infrared analysis; GH: Glycosyl hydrolase; Glc: Glucose; GlcA: Glucuronic acid; HPAEC-PAD: High performance anion exchange chromatography with pulsed amperometric detection; HT: High-throughput; IRX: Irregular xylem; LC: Liquid chromatography; MALDI-TOF/TOF: Matrix-assisted laser desorption/ionization-time-of flight/time-of-flight; MBTH: 3-methyl-2benzothiazolinonehydrazone; MeGlcA: 4-O-methyl glucuronic acid; MM: Mobility markers; MS: Mass spectrometry; NP-HPLC: Normal phase-HPLC; PACE: Polysaccharide Analysis using carbohydrate gel electrophoresis; PCA: Principal component analysis; QS: Quantitation standards; RFU: Relative fluorescence units; WAX: Wheat arabinoxylan; WT: Wild type; Xyl: Xylose.
Competing interests
Authors’contributions
XL and PJ carried out the method optimisation and prepared most of the data. DVR wrote the DASHboard software. NFB identified and analysed the GXM mutant plants. JCM contributed to method optimisation. ST contributed the IRX and GXM mutant candidates. PD, KSJ and KBK co-supervised the work. XL, JCM, PJ and PD wrote the paper. All authors read and approved the final manuscript.
Acknowledgements
We thank John Lester and the Biochemistry Dept Sequencing Facility, University of Cambridge for use of the DNA sequencer, and Nadine Anders for comments on the manuscript.
The work presented in this paper was supported by grants from the BBSRC: BB/G016240/1 BBSRC Sustainable Energy Centre Cell Wall Sugars Programme (BSBEC), and by Novozymes A/S. NFB is supported by the Portuguese Foundation for Science and Technology.
Author details
1
Department of Biochemistry, Building O, Downing Site, University of Cambridge, Cambridge CB2 1QW, UK.2Faculty of Life Sciences, Michael Smith Building, Oxford Road, Manchester M13 9PT, UK.3Novozymes A/S, Krogshoejvej 36, Bagsvaerd 2880, Denmark.
Received: 11 March 2013 Accepted: 28 June 2013 Published: 3 July 2013
References
1. Pauly M, Keegstra K:Plant cell wall polymers as precursors for biofuels. Curr Opin Plant Biol2010,13:305–312.
2. Pauly M, Keegstra K:Physiology and metabolism‘Tear down this wall’. Curr Opin Plant Biol2008,11:233–235.
3. Gomez L, Whitehead C, Barakate A, Halpin C, McQueen-Mason S:
Automated saccharification assay for determination of digestibility in plant materials.Biotechnology for Biofuels2010,3:23.
4. Sengupta S, Jana ML, Sengupta D, Naskar AK:A note on the estimation of microbial glycosidase activities by dinitrosalicylic acid reagent.Appl Microbiol Biotechnol2000,53:732–735.
5. Vinzant TB, Adney WS, Decker SR, Baker JO, Kinter MT, Sherman NE, Fox JW, Himmel ME:Fingerprinting Trichoderma reesei hydrolases in a commerical cellulase preparation.Appl Biochem Biotechnol2001,91–3:99–107. 6. Pauly M, Keegstra K:Cell-wall carbohydrates and their modification as a
resource for biofuels.Plant J2008,54:559–568.
7. Fry SC:The Growing Plant Cell Wall: Chemical and Metabolic Analysis.2nd edition. Caldwell, New Jersey: The Blackburn Press; 2000.
8. Anders N, Wilkinson MD, Lovegrove A, Freeman J, Tryfona T, Pellny TK, Weimar T, Mortimer JC, Stott K, Baker JM,et al:Glycosyl transferases in family 61 mediate arabinofuranosyl transfer onto xylan in grasses. Proc Natl Acad Sci USA2012,109:989–993.
9. Maslen SL, Goubet F, Adam A, Dupree P, Stephens E:Structure elucidation of arabinoxylan isomers by normal phase HPLC-MALDI-TOF/TOF-MS/MS. Carbohydr Res2007,342:724–735.
10. Ridlova G, Mortimer JC, Maslen SL, Dupree P, Stephens E:Oligosaccharide relative quantitation using isotope tagging and normal-phase liquid chromatography/mass spectrometry.Rapid Commun Mass Spectrom2008,
22:2723–2730.
11. Goubet F, Jackson P, Deery MJ, Dupree P:Polysaccharide analysis using carbohydrate gel electrophoresis: A method to study plant cell wall polysaccharides and polysaccharide hydrolases.Anal Biochem2002,
300:53–68.
12. Evangelista RA, Liu MS, Chen FTA:Characterization of 9-Aminopyrene-1,4,6-Trisulfonate-Derivatized Sugars by Capillary Electrophoresis with Laser-Induced Fluorescence Detection.Anal Chem1995,67:2239–2245. 13. Khandurina J, Olson NA, Anderson AA, Gray KA, Guttman A:Large-scale
carbohydrate analysis by capillary array electrophoresis: part 1. Separation and scale-up.Electrophoresis2004,25:3117–3121.
14. Chen FT, Evangelista RA:Analysis of mono- and oligosaccharide isomers derivatized with 9-aminopyrene-1,4,6-trisulfonate by capillary electrophoresis with laser-induced fluorescence.Anal Biochem1995,
230:273–280.
15. Westphal Y, Schols HA, Voragen AGJ, Gruppen H:MALDI-TOF MS and CE-LIF Fingerprinting of Plant Cell Wall Polysaccharide Digests as a Screening Tool for Arabidopsis Cell Wall Mutants.J Agric Food Chem2010,58:4644–4652. 16. Guttman A:High-resolution carbohydrate profiling by capillary gel
electrophoresis.Nature1996,380:461–462.
17. Garcia-Perez I, Whitfield P, Bartlett A, Angulo S, Legido-Quigley C, Hanna-Brown M, Barbas C:Metabolic fingerprinting of Schistosoma mansoni infection in mice urine with capillary electrophoresis.Electrophoresis2008,29:3201–3206. 18. Morell MK, Samuel MS, O’Shea MG:Analysis of starch structure using
fluorophore-assisted carbohydrate electrophoresis.Electrophoresis1998,
19:2603–2611.
19. Bharadwaj R, Chen Z, Datta S, Holmes BM, Sapra R, Simmons BA, Adams PD, Singh AK:Microfluidic glycosyl hydrolase screening for biomass-to-biofuel conversion.Anal Chem2010,82:9513–9520.
20. Bauer S, Vasu P, Persson S, Mort AJ, Somerville CR:Development and application of a suite of polysaccharide-degrading enzymes for analyzing plant cell walls.Proc Natl Acad Sci USA2006,103:11417–11422. 21. Ruhaak LR, Hennig R, Huhn C, Borowiak M, Dolhain RJ, Deelder AM,
Rapp E, Wuhrer M:Optimized workflow for preparation of APTS-labeled N-glycans allowing high-throughput analysis of human plasma glycomes using 48-channel multiplexed CGE-LIF.J Proteome Res2010,
9:6655–6664.
22. Lee KJ, Jung JH, Lee JM, So Y, Kwon O, Callewaert N, Kang HA, Ko K, Oh DB:
High-throughput quantitative analysis of plant N-glycan using a DNA sequencer.Biochem Biophys Res Commun2009,380:223–229. 23. Laroy W, Contreras R, Callewaert N:Glycome mapping on DNA
sequencing equipment.Nat Protoc2006,1:397–405.
24. Khandurina J, Blum DL, Stege JT, Guttman A:Automated carbohydrate profiling by capillary electrophoresis: a bioindustrial approach. Electrophoresis2004,25:2326–2331.
25. Murray S, McKenzie M, Butler R, Baldwin S, Sutton K, Batey I, Timmerman-Vaughan GM:Quantitative, small-scale, fluorophore-assisted carbohydrate electrophoresis implemented on a capillary
electrophoresis-based DNA sequence analyzer.Anal Biochem2011,
413:104–113.
26. Ikeda T, Senda M:Polarographic Study of Monosaccharides in Unbuffered Solution and Its Application to the Determination of the Mutarotation Rate Constants.Bull Chem Soc Jpn1973,46(7):2107–2111.
27. Kabel MA, Heijnis WH, Bakx EJ, Kuijpers R, Voragen AG, Schols HA:Capillary electrophoresis fingerprinting, quantification and mass-identification of various 9-aminopyrene-1,4,6-trisulfonate-derivatized oligomers derived from plant polysaccharides.J Chromatogr A2006,1137:119–126. 28. Jackson P:The use of polyacrylamide-gel electrophoresis for the
high-resolution separation of reducing saccharides labelled with the fluorophore 8-aminonaphthalene-1,3,6-trisulphonic acid. Detection of picomolar quantities by an imaging system based on a cooled charge-coupled device.Biochem J1990,270:705–713.
29. Khandurina J, Anderson AA, Olson NA, Stege JT, Guttman A:Large-scale carbohydrate analysis by capillary array electrophoresis: part 2. Data normalization and quantification.Electrophoresis2004,25:3122–3127. 30. Brown DM, Goubet F, Vicky WWA, Goodacre R, Stephens E, Dupree P,
Turner SR:Comparison of five xylan synthesis mutants reveals new insight into the mechanisms of xylan synthesis.Plant J2007,52:1154–1168. 31. Pena MJ, Zhong RQ, Zhou GK, Richardson EA, O’Neill MA, Darvill AG, York WS,
Ye ZH:Arabidopsis irregular xylem8 and irregular xylem9: Implications for the complexity of glucuronoxylan biosynthesis.Plant Cell2007,19:549–563. 32. Persson S, Caffall KH, Freshour G, Hilley MT, Bauer S, Poindexter P, Hahn MG,
Mohnen D, Somerville C:The Arabidopsis irregular xylem8 mutant is deficient in glucuronoxylan and homogalacturonan, which are essential for secondary cell wall integrity.Plant Cell2007,19:237–255.
33. Nikolovski N, Rubtsov D, Segura MP, Miles GP, Stevens TJ, Dunkley TP, Munro S, Lilley KS, Dupree P:Putative glycosyltransferases and other plant golgi apparatus proteins are revealed by LOPIT proteomics.Plant Physiol
2012,160:1037–1051.
34. Brown D, Wightman R, Zhang ZN, Gomez LD, Atanassov I, Bukowski JP, Tryfona T, McQueen-Mason SJ, Dupree P, Turner S:Arabidopsis genes IRREGULAR XYLEM (IRX15) and IRX15L encode DUF579-containing proteins that are essential for normal xylan deposition in the secondary cell wall.Plant J2011,66:401–413.
Arabidopsis glucuronoxylan is catalyzed by a domain of unknown function family 579 protein.Proc Natl Acad Sci USA2012,109:14253–14258. 36. Lee C, Teng Q, Zhong R, Yuan Y, Haghighat M, Ye ZH:Three Arabidopsis
DUF579 domain-containing GXM proteins are methyltransferases catalyzing 4-o-methylation of glucuronic acid on xylan.Plant Cell Physiol
2012,53:1934–1949.
doi:10.1186/1754-6834-6-94
Cite this article as:Liet al.:Development and application of a high throughput carbohydrate profiling technique for analyzing plant cell wall polysaccharides and carbohydrate active enzymes.Biotechnology for Biofuels20136:94.
Submit your next manuscript to BioMed Central and take full advantage of:
• Convenient online submission
• Thorough peer review
• No space constraints or color figure charges
• Immediate publication on acceptance
• Inclusion in PubMed, CAS, Scopus and Google Scholar
• Research which is freely available for redistribution