JIEM, 2015 – 8(3): 877-893 – Online ISSN: 2013-0953 – Print ISSN: 2013-8423 http://dx.doi.org/10.3926/jiem.1397
Influence of Management Behavior on the Skilled Labor
Migrations’ Unsafe Behavior
Shu Chen
1,2, Yue Wang
1, Yuzhu Yang
1, Xiazhong Zheng
1,21
Hubei Key Laboratory of Construction and Management in Hydropower Engineering,
China Three Gorges University (P.R. China)
2
College of Hydraulic & Environmental Engineering, China Three Gorges University (P.R. China)
[email protected], [email protected], [email protected], [email protected]
Received: January 2015 Accepted: May 2015
Abstract:
Purpose:
The purpose of this study was to summarize safety management of manager into
two aspects (design behavior and management behavior) and to figure out the different impact
these two behaviors might have.
Design/methodology/approach:
In order to verify the reasonableness of the assumptions,
expert investigation was used by the means of semi-structured interview. And the Structural
Equation Modeling (SEM) is estimated using 850 individual questionnaire responses from five
companies in the form of Likert-type scale. What’s more, taking the measurement error causing
by common method biases into consideration, Univariate Testing was taken to measure the
deviation effect.
Findings:
The results obtained with this description showed that certain measures should be
adopt by managers to develop purposively the safety knowledge and safety motivation of the
skilled labor migrations (SLMs).
Practical implications:
As the unsafe behavior of SLMs is the most important accident
reason, this paper may help reduce the incidence of accidents.
Originality/value:
The conclusion that managers’ management behavior can definitely affect
skilled labor migrations’ unsafe behavior and skilled labor migrations’ internal factors can also
influence their own unsafety behavior in turn will certainly provide the beneficial reference
views on the management behavior.
Keywords:
unsafe behavior, management behavior, skilled labor migrations, SEM
1. Introduction
With individual project construction’s subcontracting to other construction team, skilled labor migrations (SLMs) is becoming the most important construction factor in the engineering construction (EC). Due to the highly risky working place, low level of education, poor technical quality, safety consciousness and poor self-defense capability, casualties continue to occur (Chen, Yu, Zheng & Chen, 2014). According to the accident investigation, the unsafe behavior of SLMs is the most important accident reason in EC (Chen, Yu & Wu, 2014). Thus, SLMs’ unsafe behavior management has been recognized as the fundamental way for the prevention and conformity of EC (Cao & Xu, 2010).
Influence on single or partial management factors of people's unsafe behavior, which has gained increasingly greater importance in recent years, is one of the subjects of many studies. However, systematic study of the various management factors on the human impact of unsafe behavior remains scarce. What’s more, there haven’t been any studies researching on the influence on the SLMs' unsafe behavior of a variety of management factors. Yet, in order to promote good management of the SLMs’ managers on unsafe behavior, it is of great significance to study on the characteristics on which various safety managements may influence. Therefore, this study will summarize various EC safety management into two aspects (design behavior and managerial behavior of manager), and empirically research on the different impact path and characteristics which these two different behavior of manager effects on SLMs’ unsafe behavior. Eight hypotheses will be presented in this paper about the relationships among design behavior and managerial behavior of manager as well as safety knowledge, safety motivation, compliance behavior and participatory behavior of SLMs. Research variables and measurement scale will be established by referencing related research widely. The SLMs in Xiangjiaba Hydropower Station will be selected as the respondents to answer the questionnaire designed in the form of Likert-type scale. On the base of that, theoretical model will be established using SEM to verify the correctness of assumptions. The eight hypotheses will be tested by variables statistics, reliability analysis, and model testing, which will certainly provide a new perspective for further research on managerial behavior. In summary, the hypotheses verified in the following part of this paper will certainly provide the beneficial reference views on the management behavior.
2. Influence Analysis
Unsafe behavior of SLMs is influenced by instinct characteristics and managerial behavior. The combined effect of these two factors can create different benefits.
2.1. Instinct Characteristics
their own behavior. Various management practices managers implemented on the SLMs are all achieved by affecting safety knowledge and motivation of the SLMs.
2.2. Management Performance
There exist a variety of managerial behavior factors that can influence people's unsafe behavior. Some research institutions and scholars have classified and summarized management behavior affecting people's unsafe behavior. The International Atomic Energy Agency (IAEA) described the management behavior and summarized them into 6 aspects (including decision-making, planning, organization, management, clarify the ambiguity, and work related or unrelated activities). However, many scholars summarized all kinds of management behavior into two aspects: firstly, a suitable method for designing security processes and procedures should be adopt; and secondly, the process control for operations should be effective (Kirwan, 2007).
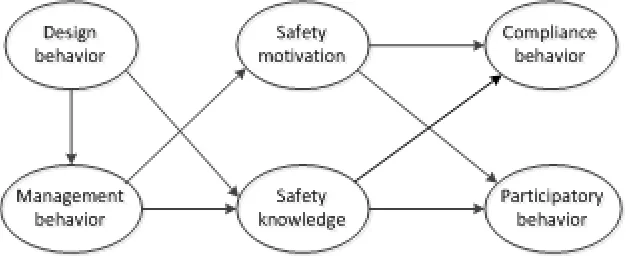
Based on the studies mentioned above, manager behavior that influences the SLM’s unsafe behavior can be divided into two aspects (design behavior and management behavior). Design behavior provides experience, knowledge, and action plans of SLMs by making various safety norms, procedures, plans, programs and systems for the SLMs. Management behavior is the results that managers influence the SLMs’ behavior directly in accordance with their design behavior. The design behavior of manager is the foundation for their implementing management behavior. Hypothesis is put forward according to above analysis.
H1 Design behavior of managers has a significant positive impact on their management behavior.
2.3. Management Influence
guiding and supervising daily work activities of employees) (Aksorn & Hadikusumo, 2008). Hypothesis is put forward according to above analysis.
H2 Design behavior of manager has a significant positive impact on safety knowledge of the SLMs.
Management behavior of managers can affect the safety motivation of employees. Creating a safe atmosphere and strengthening the supervision are important factors affecting staff’s auto-report behavior (Probst & Estrada, 2010). The higher commitment the manager can provide, the more security responsibility the employee feel, the less unsafe behavior they will choose, and thus a higher level of safety performance they will act (Yule, Flin & Murdy, 2007). Hypothesis is put forward according to above analysis.
H3 Management behavior of managers has a significant positive impact on the safety motivation of the SLMs.
Management behavior of managers can also affect the safety knowledge of workers. Inadequate training is the main factor causing the malpractice (Vredenburgh, 2002). The most important purpose of safety management is to adopt some management to influence employees' safety attitudes and behavior. Empirical research showed that training is the most important management factor affecting employee’s safety knowledge and motivation (Vinodkumar & Bhasi, 2010). Hypothesis is put forward according to above analysis.
H4 Management behavior of managers has a significant positive impact on safety knowledge of the SLMs.
working partners, improving the degree of initiative as well as improving the level of safety in the workplace (Neal, Griffin & Hart, 2000). Structural behavior and interactive behavior are similar with compliance behavior and participatory behavior. Certainly, in a recent study, three indicators have been applied to measure employees' unsafe behavior, but they are mainly developed according to the two indicators mentioned above (Larsson, Pousette & Törner, 2008; Pousette, Larsson & Törner, 2008). Given this, compliance behavior and participatory behavior can be applied to describe and measure the unsafe behavior of the SLMs.
As previously mentioned, insecurity behavior is the results choosing intentionally or unintentionally by the SLMs according to the circumstances. Their behavior is inevitably affected by their own internal factors, namely affected by their safety knowledge and safety motivation. The risk perceiving of employees is one of the inherent factors affecting their choice of unsafe behavior (Rundmo, 2000). The level of behavior risk of workers can be effectively reduced by raising risk awareness of workers (Inoue, Gotoh, Ishigaki & Hasegawa, 1999). Due to the fact that the influence of the safety motivation and knowledge is obvious, hypothesis is put forward.
H5 Safety knowledge of SLMs has a significant positive impact on the participatory behavior of SLMs.
H6 Safety knowledge of SLMs has a significant positive impact on the compliance behavior of SLMs.
H7 Safety motivation of SLMs has a significant positive impact on the participatory behavior of SLMs.
H8 Safety motivation of SLMs has a significant positive impact on the compliance behavior of SLMs.
Figure 1. Path Diagram of the Theoretical Model
3. Methods
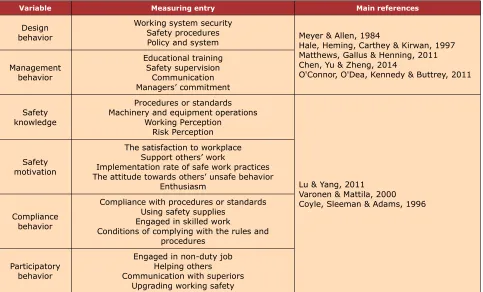
3.1. Assessment Measures
Variable Measuring entry Main references
Design behavior
Working system security Safety procedures
Policy and system Meyer & Allen, 1984Hale, Heming, Carthey & Kirwan, 1997 Matthews, Gallus & Henning, 2011 Chen, Yu & Zheng, 2014
O'Connor, O'Dea, Kennedy & Buttrey, 2011 Management behavior Educational training Safety supervision Communication Managers’ commitment Safety knowledge
Procedures or standards Machinery and equipment operations
Working Perception Risk Perception
Lu & Yang, 2011 Varonen & Mattila, 2000 Coyle, Sleeman & Adams, 1996 Safety
motivation
The satisfaction to workplace Support others’ work
Implementation rate of safe work practices The attitude towards others’ unsafe behavior
Enthusiasm
Compliance behavior
Compliance with procedures or standards Using safety supplies
Engaged in skilled work
Conditions of complying with the rules and procedures
Participatory behavior
Engaged in non-duty job Helping others Communication with superiors
Upgrading working safety
Table 1. Research Variables and Measurement Scale
3.2. Method Designs
First of all, pre-survey was taken using the scales designed on the basis of practical situation. Then, the initial analysis as well as optimization and improvement of the scale was advanced using the data collected through the pre-survey. Last, formal scale could be determined after the work mentioned above. Besides, in order to obtain the accurate and effective data during the investigation, several measures were adopted. For example, Likert-type scale was used to design the questionnaire, two stage method was adopted to collect the data, SPSS 17.0 was applied to analyze reliability and validity of the entire scale, AMOS 7.0 was applied to analyze the relationship between the variable, and SEM was set to assess the fit of and compare the skilled labor migrations’ unsafe behavior model. What’s more, taking the measurement error causing by common method biases into consideration, Univariate Testing was taken to measure the deviation effect.
3.3. Data Collection and Sample Analysis
selected as the respondents to answer the questionnaire described in neutral. Besides, the questionnaire was handed over in random and filled willingly. Moreover, the result of the questionnaire was not distinguished between right and wrong but only used for research, which was attached at the bottom of the questionnaire.
At meantime, two stage methods were adopted to collect the data. One construction team was selected at the first stage, and four construction teams were chosen at the second stage to answer the question put forward at the questionnaire such as digging in, transportation, geological survey and so on. The results are showed in the Table 2.
The number of questionnaires
Number of questionnaires
recovered
Recovery
rate Effective number ofquestionnaires
Valid recovery
rate
Invalid number of questionnaires
850 778 91.53% 691 81.29% 87
Table 2. List of the research questionnaires recovery profile
Taking the measurement error caused by common method biases into consideration, Univariate Testing was taken to measure the deviation effect. Through the analysis of the factors not rotated, the explained variance of the deposition of the first principal component was 0.29. Furthermore, the variance explained of the five factors above was 0.69. It could be determined that the common method bias does not have a serious impact on the path coefficients between the variables.
4. Results and Discussion
This section presents the results of the statistical analysis of the data obtained from the survey. First, SPSS 17.0 and AMOS 7.0 software will be applied for statistical processing of the data collected, including reliability and validity analysis on scale as well as confirmatory factor analysis. Then the model will be tested consisting of the degree of absolute adaptation and the degree of increment adaptation. On the base of that, the eight hypotheses were tested.
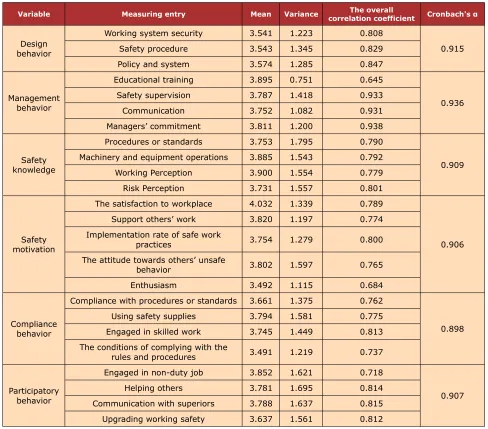
4.1. Reliability Analysis
educational training, safety supervision, communication, managers’ commitment. Besides, the scores of each variable and the overall correlation coefficient were in an appropriate range. Therefore, the scale’s consistency and reliability was suitable. The data of the variables’ basic statistics and reliability analysis in the survey are shown in Table 3.
Variable Measuring entry Mean Variance correlation coefficientThe overall Cronbach's α
Design behavior
Working system security 3.541 1.223 0.808
0.915
Safety procedure 3.543 1.345 0.829
Policy and system 3.574 1.285 0.847
Management behavior
Educational training 3.895 0.751 0.645
0.936
Safety supervision 3.787 1.418 0.933
Communication 3.752 1.082 0.931
Managers’ commitment 3.811 1.200 0.938
Safety knowledge
Procedures or standards 3.753 1.795 0.790
0.909 Machinery and equipment operations 3.885 1.543 0.792
Working Perception 3.900 1.554 0.779
Risk Perception 3.731 1.557 0.801
Safety motivation
The satisfaction to workplace 4.032 1.339 0.789
0.906
Support others’ work 3.820 1.197 0.774
Implementation rate of safe work
practices 3.754 1.279 0.800
The attitude towards others’ unsafe
behavior 3.802 1.597 0.765
Enthusiasm 3.492 1.115 0.684
Compliance behavior
Compliance with procedures or standards 3.661 1.375 0.762
0.898
Using safety supplies 3.794 1.581 0.775
Engaged in skilled work 3.745 1.449 0.813 The conditions of complying with the
rules and procedures 3.491 1.219 0.737
Participatory behavior
Engaged in non-duty job 3.852 1.621 0.718
0.907
Helping others 3.781 1.695 0.814
Communication with superiors 3.788 1.637 0.815 Upgrading working safety 3.637 1.561 0.812
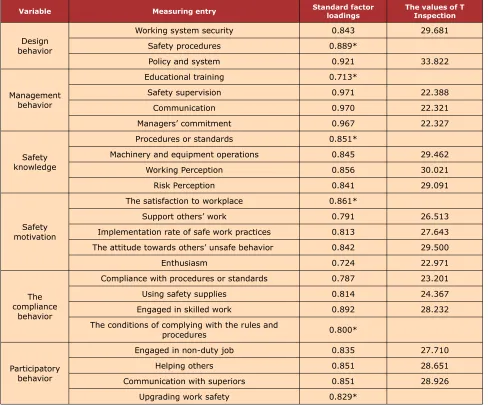
Table 3. Variables Statistics and Reliability AnalysisConfirmatory factor analysis
entries needn’t do the path coefficient significant test. Therefore, standard errors are not exist and the same as T inspection. The analysis data showed that the standard factor loadings of every measuring entry are greater than, or close to 0.700. The non-fixed measuring entry are also much larger than 0.050. The threshold of the significant level was 1.960 indicating well explain for the measured variables.
Variable Measuring entry Standard factorloadings The values of TInspection
Design behavior
Working system security 0.843 29.681
Safety procedures 0.889*
Policy and system 0.921 33.822
Management behavior
Educational training 0.713*
Safety supervision 0.971 22.388
Communication 0.970 22.321
Managers’ commitment 0.967 22.327
Safety knowledge
Procedures or standards 0.851*
Machinery and equipment operations 0.845 29.462
Working Perception 0.856 30.021
Risk Perception 0.841 29.091
Safety motivation
The satisfaction to workplace 0.861*
Support others’ work 0.791 26.513
Implementation rate of safe work practices 0.813 27.643 The attitude towards others’ unsafe behavior 0.842 29.500
Enthusiasm 0.724 22.971
The compliance
behavior
Compliance with procedures or standards 0.787 23.201
Using safety supplies 0.814 24.367
Engaged in skilled work 0.892 28.232
The conditions of complying with the rules and
procedures 0.800*
Participatory behavior
Engaged in non-duty job 0.835 27.710
Helping others 0.851 28.651
Communication with superiors 0.851 28.926
Upgrading work safety 0.829*
Table 4. Results of Confirmatory Factor Analysis
4.2. Model Testing and Calculation
The degree of absolute adaptation of the integrated model was measures by 2/df, RMSEA, GFI
Fit Index 2/df RMSEA GFI SRMR NFI NNFI CFI
Statistics 3.857 0.071 0.911 0.043 0.948 0.944 0.952
Criterion 2 < 2/df < 5 < 0.080 > 0.900 < 0.080 > 0.900 > 0.900 > 0.900
Table 5. Goodness-of-Fit Indices of the Model
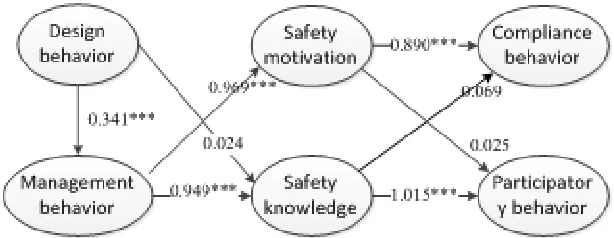
Path coefficients among theoretical models calculated on the basis of the sample data were shown in Figure 2. And *** stands for P < 0.001. Figure 2 showed that the path coefficients were notable in the level of P < 0.001 among design behavior ==> management behavior, management behavior ==>Safety knowledge, management behavior safety motivation, safety motivation ==> the compliance behavior and safety knowledge participatory behavior.
Figure 2. Research Variables and Measurement Scale
4.3. Hypothesis Testing and Offending Estimates
• H1 is proper. It indicates that managers’ design behavior has a significant positive
impact on management behavior.
• H2 is not passing the inspection. The possible reason is that only by using management
behavior can managers’ design behavior have a significant impact on the safety knowledge.
• H3 is appropriate. It shows that managers’ management behavior has an obvious
positive effect on safety motivation.
• H4 is proper. The safety knowledge is proved to be significantly effected by managers’
management behavior.
• H5 is appropriate which indicates that safety knowledge has a significant positive impact
• H6 is not passing the inspection. The possible reason is that the SLMs who master
safety knowledge well are easy to build a "self-righteous" working procedures or rules through their learnings on the job, thus not consisting with work procedures, standards, procedures offered by managers.
• H7 is not passing the inspection. Probably due to the fact that the SLMs who possess
higher safety motivation doesn’t wish to help others or communicate with others.
• H8 is right since the fact that compliance behavior is proved to be significantly effected
by safety motivation.
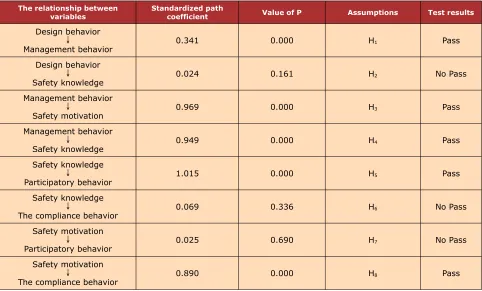
Path coefficients of the theoretical model and hypotheses test are shown in Table 6. Removing the above path not passing inspection, the modified model also has an excellent overall degree of adaption, and path coefficients among variables are roughly equal.
The relationship between
variables Standardized pathcoefficient Value of P Assumptions Test results
Design behavior
Management behavior 0.341 0.000 H1 Pass
Design behavior
Safety knowledge 0.024 0.161 H2 No Pass
Management behavior
Safety motivation 0.969 0.000 H3 Pass
Management behavior
Safety knowledge 0.949 0.000 H4 Pass
Safety knowledge
Participatory behavior 1.015 0.000 H5 Pass
Safety knowledge
The compliance behavior 0.069 0.336 H6 No Pass
Safety motivation
Participatory behavior 0.025 0.690 H7 No Pass
Safety motivation
The compliance behavior 0.890 0.000 H8 Pass
5. Conclusions and Contributions
This paper summarized various EC safety management into two aspects (design behavior and managerial behavior of manager), and empirically researched on the different impact path and characteristics which these two different behavior of manager effects on SLMs’ unsafe behavior. Eight hypotheses were presented. And they were ultimately tested by variables statistics and reliability analysis, confirmatory factor analysis as well as model testing and calculation. On the basis of the relevant literatures and dissertate mentioned above, three clear conclusions are stated as follows:
• Managers’ management behavior has a significant positive impact on SLMs’ safety knowledge and safety motivation. It is the direct management factor affecting choice of SLMs to unsafe behavior.
• Managers’ design behavior has a significant positive impact on management behavior, but it must be accompanied by the necessary management behavior to affect SLMs’ safety knowledge or motivation.
• SLMs’ safety motivation has a significant positive impact on the compliance behavior. SLMs’ safety knowledge has a significant positive impact on participatory behavior. Specifically, SLMs’ compliance behavior is mainly affected by safety motivation. But SLMs’ participatory behavior is mainly affected by safety knowledge.
Although the results of the study can effectively provide a correct guidance for managers to guide SLM's behavior to reduce accidents, the study still remains some drawbacks. One of the most important limitations to be highlighted is that SLMs selected to fill in the questionnaire were not classified appropriately according to their workplace due to both the time and funding limitations of this study. Second, management behavior, which has been divided into design behavior and management behavior, has not been classified into specific acts In a further improved research, SLMs’ behavior will certainly be regiment according to their workplace, and so does management behavior.
Acknowledgements
References
Aksorn, T., & Hadikusumo B.H.W. (2008). Critical success factors influencing safety program performance in Thai construction projects. Safety Science, 46(4), 709-727.
http://dx.doi.org/10.1016/j.ssci.2007.06.006
Cacciabue, P.C., & Vella, G. (2010). Human factors engineering in healthcare systems: The problem of human error and accident management. International Journal of Medical Informatics, 79(4), e1-e17. http://dx.doi.org/10.1016/j.ijmedinf.2008.10.005
Cao, Q., Li, K., & Li, J. (2011). Impact of Manager's Behavior on Coalminer's Unsafe Behavior.
Journal of Management Science, 24(6), 69-78.
Cao Q-R., & Xu, Z-Q. (2010). The behavioral causation chain of coal production accidents and its prevention and control measures. China Safety Science Journal, 20(9), 127-131.
Chen S., Yu, D., & Wu, L-M. (2014). Fatigue risk fuzzy evaluation for high risk operations based on G1 method. Journal of Safety Science and Technology, 10 (04), 90-95.
Chen, S., Yu, D., & Zheng, X-Z. (2014). Maturity Evaluation on Safety Standardization in Hydropower Construction: Methodology and Case Study. Engineering Letters, 22(4), 194-201.
Chen, S., Yu, D., Zheng, X-Z., & Chen, A-H. (2014). Study on synergistic emergency response to major events. China Safety Science Journal, 24(1), 156-162.
Cheyne, A., Cox, S., Oliver A., & Tomas, J.M. (1998). Modelling safety climate in the prediction of levels of safety activity. Work & Stress, 12(3), 255-271.
http://dx.doi.org/10.1080/02678379808256865
Coyle, I.R., Sleeman, S.D., & Adams, N. (1996). Safety climate. Journal of Safety Research, 26(4), 247-254. http://dx.doi.org/10.1016/0022-4375(95)00020-Q
Hale, A.R., Heming, B., Carthey J., & Kirwan, B. (1997). Modelling of safety management systems. Safety Science, 26(1), 121-140. http://dx.doi.org/10.1016/S0925-7535(97)00034-9
Inoue, K., Gotoh, E., Ishigaki, I., & Hasegawa, T. (1999). Factor analysis of risk-taking behavior in forest work. Journal of Forest Research, 4(3), 201-206. http://dx.doi.org/10.1007/BF02762249
Kath, L.M., Magley V.J., & Marmet, M. (2010). The role of organizational trust in safety climate's influence on organizational outcomes. Accident Analysis & Prevention, 42(5), 1488-1497. http://dx.doi.org/10.1016/j.aap.2009.11.010
Kirwan, B. (2007). Safety informing design. Safety Science, 45(1–2), 155-197.
Larsson, S., Pousette, A., & Törner, M. (2008). Psychological climate and safety in the construction industry-mediated influence on safety behavior. Safety Science, 46(3), 405-412.
http://dx.doi.org/10.1016/j.ssci.2007.05.012
Lu, C-S., & Yang, C-S. (2011). Safety climate and safety behavior in the passenger ferry context. Accident Analysis & Prevention, 43(1), 329-341.
http://dx.doi.org/10.1016/j.aap.2010.09.001
Matthews, R.A., Gallus, J.A., & Henning R.A. (2011). Participatory ergonomics: Development of an employee assessment questionnaire. Accident Analysis & Prevention, 43(1), 360-369.
http://dx.doi.org/10.1016/j.aap.2010.09.004
Meyer, J.P., & Allen, N.J. (1984). Testing the "side-bet theory" of organizational commitment: Some methodological considerations. Journal of applied psychology, 69(3), 372.
http://dx.doi.org/10.1037/0021-9010.69.3.372
Neal, A., Griffin, M.A., & Hart, P.M. (2000). The impact of organizational climate on safety climate and individual behavior. Safety Science, 34(1-3), 99-109. http://dx.doi.org/10.1016/S0925-7535(00)00008-4
O'Connor, P., O'Dea, A., Kennedy, Q., & Buttrey S.E. (2011). Measuring safety climate in aviation: A review and recommendations for the future. Safety Science, 49(2), 128-138.
http://dx.doi.org/10.1016/j.ssci.2010.10.001
Oliver, A., Cheyne, A., Tomas, J.M., & Cox, S. (2002). The effects of organizational and individual factors on occupational accidents. Journal of Occupational and Organizational psychology, 75(4), 473-488. http://dx.doi.org/10.1348/096317902321119691
Pousette, A., Larsson, S., & Törner, M. (2008). Safety climate cross-validation, strength and prediction of safety behavior. Safety Science, 46(3), 398-404.
http://dx.doi.org/10.1016/j.ssci.2007.06.016
Probst, T.M., & Estrada, A.X. (2010). Accident under-reporting among employees: Testing the moderating influence of psychological safety climate and supervisor enforcement of safety practices. Accident Analysis & Prevention, 42(5), 1438-1444.
http://dx.doi.org/10.1016/j.aap.2009.06.027
Rundmo, T. (2000). Safety climate, attitudes and risk perception in Norsk Hydro. Safety Science, 34(1-3), 47-59. http://dx.doi.org/10.1016/S0925-7535(00)00006-0
Vinodkumar, M.N., & Bhasi, M. (2010). Safety management practices and safety behaviour: Assessing the mediating role of safety knowledge and motivation. Accident Analysis & Prevention, 42(6), 2082-2093. http://dx.doi.org/10.1016/j.aap.2010.06.021
Vinodkumar, M.N., & Bhasi, M. (2011). A study on the impact of management system certification on safety management. Safety Science, 49(3), 498-507.
http://dx.doi.org/10.1016/j.ssci.2010.11.009
Vredenburgh, A.G. (2002). Organizational safety: which management practices are most effective in reducing employee injury rates? Journal of safety Research, 33(2), 259-276.
http://dx.doi.org/10.1016/S0022-4375(02)00016-6
Yule, S., Flin, R., & Murdy, A. (2007). The role of management and safety climate in preventing risk-taking at work. International Journal of Risk Assessment and Management, 7(2), 137-151. http://dx.doi.org/10.1504/IJRAM.2007.011727
Zheng, X-Z., Chen, Q-L., Chen, S., & Hu, B-F. (2011). Safety Assessment Method for Hydropower Construction Based on Rough Set. China Safety Science Journal, 21(1), 82-86.
Journal of Industrial Engineering and Management, 2015 (www.jiem.org)
Article's contents are provided on a Attribution-Non Commercial 3.0 Creative commons license. Readers are allowed to copy, distribute and communicate article's contents, provided the author's and Journal of Industrial Engineering and Management's names are included.