52
ECONOMIC IMPACT OF FAIR-TRADE CERTIFICATION ON SMALL-SCALE
COFFEE PRODUCERS IN ETHIOPIA
Fikadu Gutu BULGA
Jimma University, Ethiopia
Wondaferahu Mulugeta DEMISSIE
Jimma University, Ethiopia
Sisay Tolla WHAKESHUM
Jimma University, Ethiopia
Received: May 02, 2020 Accepted: May 22, 2020 Published: June 01, 2020
Abstract
:Exporting attracts attention as an international sales activity, which has been studied by the country’s economic managements, firm In Ethiopia coffee production is one of the most important sectors of livelihood, and the largest portion of coffee production comes from smallholder farmers. Small-scale coffee farmers producing for fair-trade market outlets are commonly considered to benefit from enhanced prices and established market channels. Nevertheless, some empirical studies are validating this conception adversely. This study, consequently, tried to assess the impact of fair-trade certification on the economy of small-scale coffee producers using both descrip-tive and econometrics techniques for the selected 383 respondents in Jimma zone of south west Ethiopia. According to the finding of the study; educational level, status of household head, fair-trade membership position, market and infrastructure access variables are statisti-cally significant and determine income of smallholder coffee farmers positively. Logistic regression result indicates that, the coefficient (or parameter estimate) for the variable fair-trade membership position is 3.383. This means that for every one-unit increase in fair-trade membership, we expect a 3.383 increase in the log-odds of the income increment, keeping all other independent variables constant. Therefore, leeway of fair-trade certification ought to be reflected as one of poverty and susceptibility reduction implements among economic strategists and practitioners.
Keywords:
Fair-trade certification, Coffee, Economic Impact, Ethiopia
1.
Introduction
Coffee is a global commodity with trade networks spreading wide-reaching. International exchange markets in New York and London largely determine coffee prices, making it diffi-cult for producing countries, except for major producers such as Brazil and Vietnam, to influence world price formation. The international nature of coffee marketing and sales directly exposes coffee producers in developing countries to international price fluctuations (Kodama, 2007).
53
trading system by establishing a fair price for goods and direct mar-ket access for farmers. It guarantees prices to cover the coffee producers’ costs of produc-tion, which in turn enables improvement of their livelihood: the overall aim being social and economic development of the community.
The magnitudes and values of fair-trade certification for coffee producers and their organizations have been analysed in numerous studies. Thorough case studies from coffee cooperatives in Costa Rica (Ronchi, 2002), Nicaragua (Bacon, 2005) and Mexico (Jaffee, 2014) confirm that fair-trade certification reinforced producer organizations and advocate that fair-trade tenets improved returns to smallholder coffee makers, positively affected their eminence of life and reinforced the power of local organizations. Additional lessons revealed that fair-trade arrangements enhanced the welfare of small-scale coffee producers and their families, primarily due to enhanced access to credit services and outer funds, and above through training and refining product organization (Murray et al., 2006). In Ethiopia coffee has been utilized as a drink and food for numerous hundred, if not thou-sands, of years. Henceforth, Ethiopia can be reflected as the natural and cultural home of coffee. Nowadays, an estimated 525,000 hectares (5,250 km2) of coffee are engrained in Ethiopia; nonetheless the tangible area is most likely in excess of 20,000 km2. Coffee deliv-ers Ethiopia with its furthermost noteworthy agricultural commodity, backing around one quarter of its entire export retributions (Minten et al., 2014).
In the context of fair-trade certification, Ethiopian government ratified the Cooperative Proclamation No. 147/1998 that identified clear goals, objectives and also their authorities (FDRE, 2008). From the Federal Democratic Republic of Ethiopia (FDRE) proclamation, it is possible to understand how the government wants to support a more advantageous legal background for the formation of Ethiopian cooperatives. The main goals of proclamations were to include socio-economic and other motives that require joint actions for attaining a common target. However, the extent to which the cooperatives in Ethiopia have been able to attain these goals has not been adequately analyzed. In addition, the actual extent of the cooperative movement is unknown and not assessed and valuated in general sequence. For that reason, this study collected basic evidences from 383 respondents to assess economic impacts of fair-trade certification on smallholders coffee producers which are members of cooperative union in Ethiopia. Indeed, the main objective of this study was to analyze the economic impact of fair-trade certification among smallholder coffee producers in case of Jimma zone of south west Ethiopia using both descriptive and econometrics techniques. And the result of the study revealed that educational level, status of household head, fair-trade membership position, market and infrastructure access variables manage income of smallholder coffee planters positively.
2. Methods of the Study
2.1. Sources and Type of DataThis study was conducted based on both primary and secondary data. The primary data were collected by face to face interviews using structured questionnaire. The questionnaire included both closed and open ended questions. The closed-ended questions were used to collect background information about the respondent. It covered the personal information, institutional (cooperative union), economic, social structure, and regional infrastructure development. Secondary sources were included unpublished and published materials about fair-trade certification activities.
2.2. Study Design and Period
54
2.3. Sample Size Determination and Sampling TechniquesMulti-stage sampling techniques were employed to determine sample size. The researchers applied lottery method to select certified and non-certified from each selected cooperative unions from four selected coffee cooperative unions in Ethiopia. After researchers determined total sample of cooperatives from both certified and non-certified; the selection criteria of farmers was based on the membership registry book of each cooperative.
The sample size was determined by the following formula (Noel, et al, 2012).
Where, is the total population, is the required sample size, margin of error, is the confidence level. And n=383 for total population (N) =8934.
2.4. Data Analysis
Data were coded, checked for completeness and entered into a computer. Then, coded data were analysed using STATA software package version 13.0 for regression analysis. The empirical analysis of this study was conducted using both descriptive statistics and logistic regression analysis. Assessing the impact of Fair-trade certification on increasing farmer’s income at household level of respondents and cooperative union requires adjustments to control for differences between membership and non-membership to evaluate the economic impact. The impact of fair-trade certification on respondents was assessed based on the independent variables indicated below. The variables used in regression are respondent age, total farmland, membership status of fair-trade certificate, amount of coffee land, households’ headship status. The functional relationship between the probabilities of income increment impact at household level and explanatory variables are specified as:
Let Yij be the ith farmers response for component indicate income increasing status (a binary outcome, 1= alone, 0=otherwise) for small household farmers in the jth cooperative.
𝑙𝑜𝑔 𝑃𝑗
1−𝑃𝑗= 𝛽0+ 𝛽1𝑋1+ 𝛽2𝑋2+ ⋯ + 𝛽𝑘𝑋𝑘……….. (2)
where is the population proportion of income increment mainly at household level in the jth cooperative, ith farmers response for the components index of economic impact of fair-trade certification, are households socio-economic characteristics of the study subjects or independent variables and are their associated regression coefficients or parameter to be studied. To analyse studies that involve qualitative choice, especially to evaluate dichotomous variables most studies employed logit and probit model. The logit and probit formulations are quite comparable, for this study Logit model has got advantage over probit in the analysis of dichotomous outcome variable in that, it is extremely flexible and easily used model from mathematical point of view (Hosmer et al.,2013). Finally, the question of income increment at household level is expressed in dichotomous form. Thus, a farmer whose income is increased is assigned a value of 1, otherwise 0.
3. Result and Discussions
3.1. Economic Impact of Fair-Trade Certification on Small-Holder Coffee Producers and Cooperatives According to the result of the table 3.1 below, Fair-trade certification status has improved annual income of the certified small household coffee producer farmers. Interviews were conducted with a total of 383 small household coffee producers farmers involved in this study. As it has shown in the table, of those 383 producers, 116 (30.3%) belonged to a Fair-trade certified cooperatives, while 267(59.7%) were from non-members
As it has indicated from the study survey, nearly most of respondents reported as they have an average 0.5hector of coffee farm and respond that their income increases since the last three years. Within these cooperatives both fair-trade certified and non- Certified, the size of individual coffee farms varied between 0.5 and 4.5hector; nearly (4) 4.6% of the coffee farmers had more than 4.5 hector of coffee farms. Based on the information, out of total coffee producers 170(44.4%) respond that their income increases while the remaining 213(54.6%) were report that their annual income was not increasing in the last three harvest-ing year
55
Table 3. 1. Percentage Distribution of Farmers’ Income Status from Coffee (n=383)
Characteristics Is there any change in your annual income from coffee production in recent years?
Yes No Total
Variables Responses Number % Number % Numbe
r %
Educational level of household head
No
education 36 9.4 172 44.9 208 54.3
Read and
write 134 35 41 10.7 175 45.7
Total 170 44.4 213 55.6 383 100
Fair-trade certificate membership status
Yes 110 28.7 6 1.6 116 30.3
No 60 15.7 207 54 267 59.7
Total 170 44.4 213 55.6 383 100
Household headship status
Female 8 2.1 77 20.1 85 22.2
Male 162 42.3 136 35.5 298 77.8
Total 170 44.4 213 55.6 383 100
Credit
Opportunity Yes No 56 114 14.6 29.8 52 161 13.6 42 108 275 28.2 79.8
Total 170 44.4 135 55.6 383 100
Access to
Market Yes No 155 15 40.5 3.9 25 188 6.5 49.1 180 203 47 53
Total 170 44.4 213 55.6 383 100
Source: Study Survey 2017
Similarly, only 6(1.6%) certified cooperative members replied that income were not increas-ing; while 207(54%) from non-certified member of coffee cooperative reported that their annual income was not increasing in the last three years. This shows that there was a differ-ence between those certified and non-certified cooperatives in terms of income. Even if there is a remarkable difference between fair-trade certified and non-certified members of coffee producer cooperatives regarding to their income; the coverage of fair-trade certificate mem-bership status is still very low when compared to the numbers of household coffee producers in the study area. Of total respondents or households, 108 (28.2%) reported that they have gotten credit opportunity and 275(79.8%) of them were reported that, otherwise. Producing coffee is not enough for farmers; the case is very worth for small household coffee producer in developing countries. Because they produce coffee with many challenges and also with many hopes of income for their household. Next issue to production of coffee was market access. According to the respondents, 180(47%) said that the access to market was good and 203(53%) were reported that, access to market is not easy for them.
3.1.1. Relationship between Credit Opportunity and Fair-Trade Certification
56
Our finding is in agreement with the study conducted by many scholars. For example, in a study by Mendez et al. (2010) of 469 coffee producers in Central America and Mexico, fair-trade farmers had higher reported access to credit (42%) than conventional coffee farmers (34%). This could be related to the fact that the fair-trade social premium finances credit funds that are run by cooperatives to make credit available to producers (ibid.p.2) and Ruben et al (2009)). These funds are particularly useful in so far as banks often fail to provide credit to small-scale producers in most of developing countries like Ethiopia.
Table 3.1.1 Relationship between Credit Opportunity and Fair-Trade Membership Status (n=383) Responses Fair-trade Membership Status Total
Characteristics No Yes
Credit Opportunity
No Number Percent 203 72 275
within Credit Opportunit y
73.8 26.2 100
Percent of
Total 53 18.8 71.8
Yes Number Percent 64 44 108
within Credit Opportunit y
59.3 40.7 100
Percent of
Total 16.7 11.5 28.2
Total Number 267 116 383
Percent within Credit Opportunit y
69.7 30.3 100
Total Percent of
Total sample
69.7 30.3 100
Source: Survey Study, 2017
Our finding was in agreement with the study conducted by Murray et al (2006). The study result of Murray et al., (2003), shows that, some cooperatives in Mexico have taken a slice of the fair-trade premium and invested it in small, cooperatives administered credit funds that can be accessed by members for small emergencies. It is possible to conclude that ac-cess to credit gives farmers increased opportunities for productivity investments and helps them avoid predatory lending at exorbitant rates. And also, there is a remarkable differences between fair-trade certified cooperative and non-certified. Demand for coffee is higher when it was the product of fair-trade certified members of cooperative than non-certified.
3.2. Logistic Regression Results
3.2.1. The Economic Impact of Fair -trade certificate on Smallholder Coffee Producer farmers
57
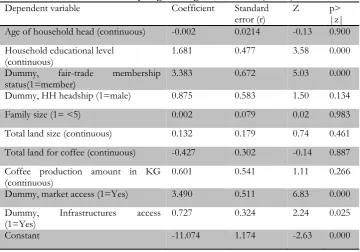
increase in fair trade membership, we expect a 3.383 increase in the log-odds of the income increment, keeping all other independent variables constant. The coefficient (or parameter estimate) for the variable market access is 3.49. This indicates that for every one-unit increase in market access, it is expected that a 3.49 increase in the log-odds of the in-come increment, keeping all other independent variables constant. And the result shows that, the probability of income augmentation has a direct relationship with explanatory variables. The coefficient (or parameter estimate) for the variable of infrastructure access to farmers is 0.727. This means that households those have a better infrastructural access, we expect a 0.727 increase in the log-odds of the Income Increment, holding all other independent vari-ables constant.
Table 3.2.1: Binary Logistic Regression Result (n=383)
Source: Study survey, 2017
Generally, our finding is in agreement with the study conducted in other countries or there is similar income growth reported from other studies. A separate study in Nicaragua found that farmers averaged $0.56/lb of coffee sold through a cooperative linked with the fair-trade certified organic market, compared to $0.40/lb for their conventional market counterparts (Bacon, 2008). Fair-trade-associated cooperative farmers in Costa Rica received incomes that were 39% higher on average than farmers not involved with fair-trade (ibid.p.2). Also our finding is in agreement with the study conducted by many other scholars. For example, the study conducted by Mendez et al. (2010) shows that, within a sample of 469 coffee producers in Central America and Mexico for the 2003/2004 harvest, the researchers constructed an average price measure using farm gate prices received from different markets (organic, certified fair-trade, and conventional) weighted by the percentage of the harvest sold at that price to reflect the prices that farmers obtain at the farm gate. The authors find that fair- trade certified farmers received $0.17 more per pound of coffee sold while fair-trade/Organic certified farmers received $0.38 more per pound of coffee sold compared to non-certified farmers.
3.2. Fair-Trade Certification Impact on Infrastructure Development in the Study Area
The coefficient (or parameter estimate) for the variable fair-trade membership status is 0.751. This shows that for every one-unit increase in fair-trade membership, we expect a 0.751 increase in the log-odds of the infrastructure
Dependent variable Coefficient Standard
error (r) Z p> |z| Age of household head (continuous) -0.002 0.0214 -0.13 0.900 Household educational level
(continuous) 1.681 0.477 3.58 0.000
Dummy, fair-trade membership
status(1=member) 3.383 0.672 5.03 0.000
Dummy, HH headship (1=male) 0.875 0.583 1.50 0.134
Family size (1= <5) 0.002 0.079 0.02 0.983
Total land size (continuous) 0.132 0.179 0.74 0.461
Total land for coffee (continuous) -0.427 0.302 -0.14 0.887 Coffee production amount in KG
(continuous) 0.601 0.541 1.11 0.266
Dummy, market access (1=Yes) 3.490 0.511 6.83 0.000
Dummy, Infrastructures access
(1=Yes) 0.727 0.324 2.24 0.025
58
development, keeping all other independ-ent variables constant. One objectives of fair-trade certification is related to development of infrastructure. This infrastructure is funded from what we call social premium. The Social premium has typically been invested in other funds for community projects or to enhance the capacities of the cooperatives, unions and its members. Surprisingly, most of farmers from non-certified cooperative member have the information that those fair-trade certified cooperatives have got fair-trade premium each year and they shared the social projects equally which has been built by the premium. As mention at the first line of this paragraph, fair-trade certification program touch its goal by using income/payment from social premi-um. For example, according to Kenter coffee producer cooperative union, 32 water pumps were built by the union for the surrounding community. In addition, the cooperative union also built one library in Bilida kebele. For more details, see the following figure.
Figure 3.2. Local infrastructure built by Kenter Coffee Producer Farmers’ Cooperative Un-ion
4. Conclusion and Policy Implications
4.1. ConclusionThe core of the research design was a cross-sectional based survey focused to identify the impact of fair-trade certification on the income of small-scale coffee producers. This study was adopted a combination of research tools, both quantitative and qualitative. This in-volved a long paper-based questionnaire applied to stratified random samples within the research sites and interviews with fair- trade members and non-members of fair-trade in accordance with a set of analytical criteria, so as to allow for more detailed and different kinds of evidence.
59
variables constant. In addition, the coefficient (or parameter estimate) for the variable educational level status of household head is 1.681. The coefficient (or parame-ter estimate) for the variable market access is 3.49, keeping all other independent variables constant. The result shows that the probability of income increment has a direct relationship with explanatory variables. Also, the coefficient (or parameter estimate) for the variable of infrastructure access to farmers is 0.727. This means that households those have a better infrastructural access, we expect a 0.727 increase in the log-odds of the income increment, holding all other independent variables constant. Also, this study finding shows that, the coverage of fair-trade certificate membership status is still very low when compared to the numbers of household coffee producers in the study area.
4.2 Policy Implications
Based on the finding of the research, the researchers forward the following policy implica-tion for optimal exploitation of fair-trade certification, which will make smallholders farmers more beneficiary:
Fair-trade certification as a trade license has a promising result regarding to economic and infrastructural development advantages to small-scale coffee farmers in particular and the community in general. This particular research study result also shows that fair-trade certifi-cation has a great impact on small scale coffee farmer wellbeing in changing the livelihood of destitute coffee farmers and also improved the development infrastructures of communi-ty. Therefore, fair-trade certification should be considered as one of development riding forces and instruments among policy makers.
Regardless of the substantial impact of fair-trade certification, study revealed that the cov-erage of fair-trade certification was very low. Hence, main stakeholders such as government, non- government organization, coffee producers and buyers ought to work deeply to envel-op wide community as much as possible. Market access and credit opportunity matters the success of lifting poor small-scale farmers out of poverty. Therefore, financial bodies like formal and informal credit and saving institutions, market makers should further get in touch with small scale coffee farms. Educational level status has a positive and significant impact on the income of smallholder coffee farmers. So, government and NGOs should focus how to increase farmer’s access to functional adult literacy program.
References
Bacon, C., 2005. Confronting the coffee crisis: can fair trade, organic, and specialty coffees reduce small-scale farmer vulnerability in northern Nicaragua?. World development, 33(3), pp.497-511.
Bacon, C.M., Ernesto Mendez, V., Gómez, M.E.F., Stuart, D. and Flores, S.R.D., 2008. Are sustainable coffee certifications enough to secure farmer livelihoods? The millenium development goals and Nicaragua's Fair Trade cooperatives. Globalizations, 5(2), pp.259-274.
Fair Trade Foundation, 2012. Commodity briefing report on Fair trade and coffee Federal Cooperative Agency. Cooperative-Annual Magazine – June 2007, Federal Cooperative Agency, Addis Ababa.
Federal Democratic Republic of Ethiopia (FDRE), 2008. Coffee Quality Control and Marketing Proclamation, Addis Ababa
Hosmer Jr, D.W., Lemeshow, S. and Sturdivant, R.X., 2013. Applied logistic regression (Vol. 398). John Wiley & Sons.
Jaffee, D., 2014. Brewing justice: Fair trade coffee, sustainability, and surviv-al. Univ of California Press. Kodama, Y., 2007. New role of cooperatives in Ethiopia: the case of Ethiopian coffee farm-ers cooperatives. Méndez, V.E., Bacon, C.M., Olson, M., Petchers, S., Herrador, D., Carranza, C., Trujillo, L., Guadarrama-Zugasti,
C., Cordon, A. and Mendoza, A., 2010. Effects of Fair Trade and organic certifications on small-scale coffee farmer households in Central America and Mex-ico. Renewable Agriculture and Food Systems, 25(3), pp.236-251.
Minten, B., Tamru, S., Kuma, T. and Nyarko, Y., 2014. Structure and performance of Ethi-opia s coffee export sector (Vol. 66). Intl Food Policy Res Inst.
60
Noel Veraverbeke, Yilma Tefera, Legesse Negash, Zeytun Gashaw, Belay Birlie, 2012. Notes for the course Principles of Statistical Inference. North-South-South project in Biostatistics Series, Belgium.
Ronchi, L., 2002. The impact of Fair Trade on producers and their organizations: A case study with Coocafé in Costa Rica. Policy Research Unit. Sussex: University of Sussex.