Reputation, Corporate Social
Responsibility, and Financial
Performance of Banks
1
Reputation, Corporate Social Responsibility, and
Financial Performance of Banks
Christopher N.M. de Koning
1ABSTRACT
This paper investigates the effects of reputation and corporate social responsibility (CSR) on the financial performance of a global sample of banks. Firstly, reputation and CSR are found to be complements rather than substitutes. Reputation is found to increase return on equity, return on invested capital, and return on assets. CSR is found to be positively related to the above, as well as net interest income. Its relationship with the share price remains unclear. These relations are more pronounced for less reputable and less socially responsible banks, indicating a curvilinear relationship. It is further argued that investing in CSR poses a better opportunity for extracting economic value than reputation. The findings suggest that profits are earned on CSR and reputation, and thereby provide continued incentives for banks to maintain their status.
1.
Introduction
In capital markets, investment banks play an important role in bridging the gap between investors and entrepreneurs. They constitute the nexus of cash flows that facilitates a mutually beneficial relationship between lenders and borrowers, where lenders can extract economic rents in the form of interest in exchange for providing their excess capital where opportunities for economic growth exist. According to King & Levine (1993), these well-functioning financial institutions are the key to sustained prosperity. The intermediary function of banks, then, plays a crucial role in economic development. Fang (2005) argues the importance of this role is twofold. First, the bank’s specialization in sales and marketing of securities helps lower the issuer’s transactional costs. Second, investment banks can provide value through their role in lowering the issuer’s informational cost of capital. Investors, unsure of the actual state of affairs inside an issuing company, will discount their securities to account for the prevailing asymmetry in information. Subsequently, the intermediating bank is in a prime position to deliver economic value by reducing the information asymmetry and with it the cost of capital.
A problem arises, however, when investors cannot observe the rigor of the bank’s screening standards. Because underwriters have skewed incentives when it comes to marketing equity or debt, potential investors can never be certain of the validity of the information conveyed to them by the banks. To solve this problem, they turn to the bank’s “reputational capital” as a measure of the quality of the bank’s services. Banks build reputational capital by repeatedly interacting in the market, building a service history reflective of their product quality. As banks are repeated players in the underwriting industry, the present value of their future cash flows is dependent on how they are perceived by investors. Thus, if the cost of diminished reputation is greater than an increase in short-term profits resulting from opportunistic behavior, banks will find defrauding investors suboptimal. Subsequently, banks with high reputational capital perform high-quality services in fear of tarnishing their reputation.
1 Christopher N.M. de Koning received a bachelor’s degree in finance from Maastricht University in July 2017.
2
Marble
Research
Papers
However, the production of higher quality services requires banks to devote a larger amount of resources to it. This observation led Fang (2005) to inquire on the effect of reputation on financial performance. Previous research performed by i.e. Chemmanur & Fulghieri (1994), Fang (2005), and Ross (2010), shows that reputation allows a bank to charge higher fees and yields than less reputable banks. However, the revenue’s relationship with its the costs has yet been elusive.
The literature thus far is mainly concerned with reputation in the investment banking industry and defined it accordingly. A similar vein of research, and a hotly debated topic, studies corporate social responsibility (CSR) and its effect on financial performance. In this paper, CSR is defined according to McWilliams & Siegel’s (2001, p. 1) as “actions that appear to further some social good, beyond the interest of the bank and that which is required by law”. However, research on this relationship within the banking sector is scarce. CSR comprises and enhances the public’s perception of the bank (McWilliams & Siegel, 2001) and is thus a vital part of the bank’s reputation. Enhanced reputation influences financial performance as it attracts resources that serve as competitive advantage or acts as a safety net in bad times (Fombrun, Gardberg & Barnett., 2000; Peloza, 2006; El Ghoul, Guedhami, Kwok & Mishra, 2011). Hence, this paper argues that the construct of bank reputation comprises two dimensions: social reputation as a function of CSR engagement, and market reputation as a function of the bank’s intermediary service quality. Because social reputation and market reputation jointly constitute the concept of reputation, and because both affect financial performance, they should be considered in a joint context. Henceforth, “reputation” refers to market reputation, and “CSR” refers to social reputation.
Reputation lends credibility to the intermediary services in a business context, and CSR enhances the image of the bank in a public context. While theoretically the role of reputation is well established, the bulk of the literature focusses on its relationship with securities or clientele characteristics, particularly in the equity underwriting market within the boundaries of the United States. Its effect on financial performance has not yet been addressed. Moreover, reputation and CSR have not yet been related to financial performance in a joint context. Based on these gaps, this paper seeks to quantify the relationship between reputation, CSR, and financial performance of banks in a global context. Three main contributions to existing literature are made. First, this paper quantifies in detail the effects of both reputation and CSR on the financial performance of banks in a joint context. Second, because financial performance is based on a bank’s activities in multiple markets, traditional measures for reputation are not applicable. To solve this problem, a new measure for approximating reputation in a broader context is introduced. Third, a dataset consisting of relevant and globally dispersed banks is used to improve generalizability. This yields a more pragmatic and holistic framework and offers richer implications.
2.
Related literature
2.1
Reputation, certification, and the price premium
Reputation, Corporate Social
Responsibility, and Financial
Performance of Banks
3
without performing price adjustments. Secondly, the premium incentivizes the producer to maintain the high quality of its products and serves to compensate him for the investments required to build reputation. This argument can be generalized to financial markets where firms attempt to sell securities. However, it works at best imperfectly in a market where investors are uncertain about the credibility of information conveyed directly by firms. Firms attempting to sell securities have incentives to deliberately omit, or release at a later stage, adverse information about the prospects of the firm to raise extra cash. In other words, prices charged are not indicative of firm quality. This market imperfection leads investors to discount the firm’s securities to account for information asymmetry, and subsequently legitimizes the need for financial intermediaries.
How do intermediaries solve the credibility problem in face of the investors? Reputation has been proposed as a general solution to agency problems in contracting in numerous settings (Dennis & Mullineaux, 2000). Examples include audit quality (DeAngelo, 1981; Titman & Trueman, 1986), bond ratings (Wakeman, 1981), dividends (Easterbrook, 1984), initial public offerings (IPOs) (Beatty & Ritter, 1986; Carter & Manaster, 1990), seasoned equity offerings (Shadler & Manual, 1994) and bank loan announcements (Johnson, 1997; Bushman & Wittenberg-Moerman, 2012). In their influential paper, Booth & Smith (1986) lay the ground work for this, which they call the certification hypothesis. They model underwriter reputation as a “bond” which certifies that the issue price is consistent with inside information about the future earnings prospects of the firm. Hence, when low-risk firms seek to reveal their low-risk characteristics to the market, they will seek underwriters whose prestige they can “lease” to certify that prices reflect all inside information.
The upshot of this literature is that firms should be willing to pay a price premium for reputable underwriters to certify their equity issue and thus to diminish information asymmetry. Furthermore, this argument extends to all areas of financial intermediation which satisfies the requirement that quality is not ex ante observable, and thus where reputation leads to a reduction in information asymmetry. An important observation is that reputation is one of the most valuable assets of financial intermediaries (Fang, 2005). As they are repeated players in financial markets, their survival and future income is tied directly to their reputation. Consistent with the arguments above, if the present value of future income derived from their reputation is greater than the short-term profits earned by defrauding investors and sacrificing reputation, intermediaries will find defrauding their investors suboptimal.
The bulk of the empirical literature addresses reputation effects in the equity market, with a specific focus on IPOs. In contrast, a rather limited literature deals with the underwriting of corporate bond issues. The relationship between underwriter reputation and compensation is even less well documented (Fang, 2005). This is surprising since proceeds from the corporate bond issues are much larger than proceeds from IPOs (Livingston & Miller, 2000). However, in both areas the findings are supportive of what the theory would predict.
4
Marble
Research
Papers
asymmetry in the equity market, thereby lending support to the certification hypothesis. Underwriters with greater reputation charge higher fees and therefore have higher gross incomes than their less prestigious rivals, as consistent with reputational signaling theory. A finding that deserves special mention is that reputable banks will actively choose to underwrite high quality firms, and vice versa. Puri (1999) further builds on their findings. In her model, she finds that high reputation intermediaries have large incentives to maintain their reputation, which leads to higher certification standards and higher prices.
The earliest studies in the public debt market yielded few results when it comes to compensation structure as a function of reputation. This can be attributed to the relatively small employed sample sizes, and unsophisticated measures for reputation. For example, based on a sample of 285 bonds, Logue & Rogalski (1979) found no significantly different fees or interest rates between bonds underwritten by more and less prestigious banks, where prestige was defined by a minimum number of debt offerings. Later studies found a negative relationship between underwriter reputation and fees in the bond market (i.e., Livingston & Miller, 2000). These findings, however, are counter-intuitive given existing theoretical predictions that a fee premium is needed to induce high-quality information production. Fang (2005) attributes this to the non-random matching between issuer and underwriter, which had been determined by established literature. She formally illustrates Chemannur & Fulghieri’s (1994) findings that there is a selection-bias in the underwriting industry, where reputable banks can cherry-pick high quality firms based on their superior information gathering capabilities. After accounting for issuer-underwriter matching, she finds that reputable banks charge higher fees, a finding that is even more pronounced in the junk-bond category. She reaffirms existing the theory that banks are concerned with reputation maintenance and proactively seek to minimize reputational risk by seeking out the safest firms to underwrite, and thus that reputation is informative of issue quality.
The theoretical basis and empirical findings would thus suggest that the more reputable firms earn higher gross incomes than their less reputable counter-parts. Fang (2005, p. 2757) emphasizes, however, that it is yet unclear whether this leads to improved profits, stating “if banks were to sustain their reputational advantage, the process of doing so would likely be costly”. Indeed, the stricter evaluation standards discussed by Chemmanur & Fulghieri (1994) induce greater expense of resources. If improved quality does not require additional marginal resources, a new equilibrium point will exist where every bank would prefer providing the highest level of service quality. By proxy, reputation cannot be a competitive advantage, and thus has no effect on financial performance.
Reputation, Corporate Social
Responsibility, and Financial
Performance of Banks
5
2.2 Corporate social responsibility, reputation, and profitability
The previous segment discussed how reputation merits a price premium because the extent of reduced information asymmetry between the investor and the issuer is a function of intermediary reputation. This paper coins this concept “market reputation”. Within this framework, the bank represents the issuer vis-à-vis the investor which makes reputation mainly a business-to-business concern. Even though this bilateral relationship can involve extreme amounts of money and profitability2, it includes but a limited variety of stakeholders. How can banks enhance their image as perceived by the multitude of other stakeholders it deals with on a day to day basis, what effect on profitability does it yield, and how does this effect compare to reputation? Previous research has concluded that corporate social responsibility is a major signal used by firms to build social reputation (Fombrun et al., 2000). This paper defines CSR according to McWilliams & Siegel’s (2001, p. 1) definition as ‘’actions that appear to further some social good, beyond the interests of the firm and that which is required by law’’. For example, McWilliams and Siegel (2001) explain that firms actively supporting CSR are perceived as more reliable and, therefore, that their products are of higher quality. They further assert that the promotion of CSR by management is deemed a signal of recognition of multiple stakeholders, which is positively rewarded. While this reasoning spans multiple industries, Wu & Shen (2013) argue that CSR can be incorporated in banking theories by relating it to bank reputation.
However, whereas the literature on certification seems generally supportive of the positive effects of reputation on gross revenues, academics often offer contradictory conclusions about the profitability of CSR. The review of Margolis & Walsh (2003) of 127 studies relating CSR and financial performance shows that 54 studies revealed a positive relationship, 20 showed mixed results, 28 found insignificant relationships, and 7 found a negative relationship. However, studies of CSR and the financial performance in the banking industry is once again very scarce. To my knowledge, three studies exist that test this relationship which also show inconsistent results. Wu & Shen (2013) and Cornett, Erhemjamtsa & Tehranian (2014) found significant positive relationships between CSR and financial performance, whereas Chih, Chih & Chen (2010) found insignificant relationships. Reputation is not considered separately in all studies.
The inconclusive results prompt mixed views on the economic value of CSR. On the one hand, the negative view states that, fundamentally, the costs incurred by pursuing CSR strategies leads to competitive disadvantage (Waddock & Graves, 1997) because competitors do not bear these costs. Moreover, whereas the costs can be readily measured and are generally substantial (Wu & Shen, 2013), the benefits are rarely obvious. Peloza (2006) mentions that other researchers have adopted the view of CSR as an operating license. Due to peer pressure and legitimacy concerns, firms enter a vicious cycle of increasingly costly CSR activities simply to match the competitors’. This leads to lowered financial performance across the industry with no potential for differentiation between firms. He further argues that superficial CSR is viewed negatively by the market. This implies that CSR needs to be an integrative part of a business’ strategy, as management cannot discern wise CSR investments otherwise. The gist of this view is that, at best, insignificant findings are expected to be found. Indeed, Chih et al. (2010) failed to find a significant relationship. To generalize the effects of CSR on financial performance, the
2In a leveraged buyout (LBO) attempt in the 1980s, then-leading LBO specialist Kohlberg Kravis Roberts &
6
Marble
Research
Papers
mutual funds industry has been greatly researched. If CSR is expected to be positively related to financial performance, ethical mutual funds should outperform normal funds based on this. Again, mixed results are found. For example, Bauer, Koedijk & Otten (2005) find no empirical outperformance of ethical mutual funds on an international level.
In contrast, a positive view of CSR sees many benefits, both qualitative and quantitative, and both for incremental gains and mitigated losses (Fombrun et al., 2000; Peloza, 2006; Koh, Qian & Wang, 2014; Kim, Kim & Qian, 2015). Widely cited qualitative benefits are related the stakeholder management. Waddock & Graves (1997) argue that CSR strengthens a firm’s competence to build and sustain diverse stakeholder relationships. Excellent community relations lead to high level of legitimacy from the community (Fombrun et al., 2000). Improved employee welfare can attract greater talent, retain them for longer and enhance morale, productivity and satisfaction (Waddock & Graves, 1997; Dhaliwal, Li, Tsang & Yang, 2011; Kim et al., 2015). Sustainable practices and improved government relationships can further be expected to reduce legislation and compliance costs (Dhaliwal et al., 2011), provide tax-breaks and better access to production sites (Waddock & Graves, 1997) and overall reduced restriction of operations (Peloza, 2006). Stakeholder management thus induces sincere commitment from stakeholders (McWilliams & Siegel, 2001). A sustainable reputation further brings brand equity and brand diversification (Wu & Shen 2013; El Ghoul et al., 2011), which increases and stabilizes sales (Dhaliwal et al., 2011), commands a price premium (McWilliams & Siegel, 2001; Martin, Petty & Wallace, (2009) and improves public opinion of the firm (Martin et al., 2009). Improved public opinion is crucial for the banking industry in the aftermath of the financial crisis and the greatly increased scrutiny by the media and academe (Martin et al., 2009; Wu & Shen, 2013; Cornett et al., 2014). Lastly, the firm’s reputational capital, generated by socially responsible activities, reduces losses in bad times (Fombrun et al., 2000; Kim et al., 2015) and works as an insurance policy (Peloza, 2006). Kim, Li & Li (2014) and Koh et al. (2014) empirically support this by finding that CSR leads to a lower risk of a stock price crash, and that it acts as a valuable ex ante insurance mechanics, respectively.
From a quantitative perspective, CSR increases transparency and thus reduces information asymmetry between the firm and the investors (Dhaliwal et al., 2011). Coupled with diversification, this reduces the cost of debt and equity capital of the firm (Dhaliwal et al., 2011; El Ghoul et al., 2011). Fatemi et al. (2015) empirically show that CSR has a positive effect on both the cash flows and risk profile of a firm. They caution, however, that this relationship is curved; as CSR expenditures moves past its optimal value, firm risk increases and firm value declines. Such a relationship was suggested by McWilliams and Siegel (2001). The recent boom in ethical investing (Martin et al., 2009; Dhaliwal et al., 2011) improves the liquidity of socially engaged firms.
Reputation, Corporate Social
Responsibility, and Financial
Performance of Banks
7
3.
Methodology
3.1
Measures of performance, independent, and control variables
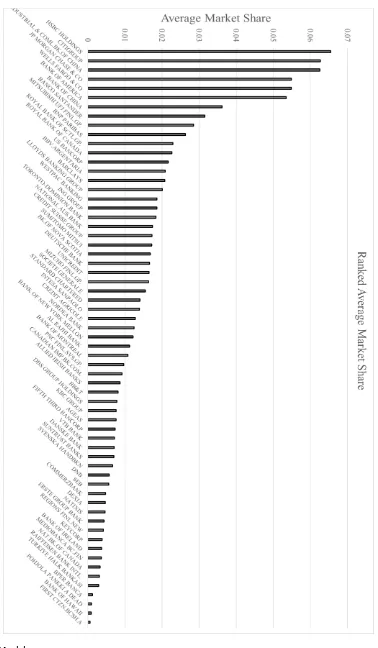
Empirical papers typically use the bank’s market share as a proxy for reputation3. The argument goes that market share captures the brand name and goodwill of the bank (see Fang (2005, p. 2734) for a detailed explanation). However, market share is limited to the market in which the share exists. As financial performance is the outcome of activities that take place in a plethora of markets (i.e., equity and debt underwriting, private banking), a similarly broad-based measure of reputation is required. This paper proposes to use market capitalization as an extension of the traditional market share measure to approximate reputation.
Market share and market capitalization employ the same logical benefit and flaw which are rooted in market share’s appeal as a reputation proxy. Conceptually, market capitalization, like market share, reflects the present value of future income. Stated differently, it reflects the revenue stream at stake from the bank’s operating activities. The shared flaw in this reasoning is that it assumes that cash flow size is an accurate measure of quality. Given the conceptual similarities, and the goal to proxy for banks’ reputation over multiple markets in which reputation plays a role, market capitalization is proposed applicable. To illustrate its mechanics, future cash flows due to reputation fluctuate as the bank interacts with its stakeholders, altering its reputation and thus the present value of cash flows captured by the market capitalization. Banks require larger compensation for the resources expended to produce higher quality services. However, when a bank is found to cut quality without adjusting the price, its reputation is tarnished, and investors are less inclined to do business with the bank. After all, they have paid an unfair price in the past. Loss of business is expected to be reflected in the present value of the bank. Similarly, a gain in quality attracts better clients (Chemannur & Fulghieri, 1994; Fang, 2005), which provide better business, especially in the presence of analyst coverage (Dhaliwal et al., 2011).
Two independent variables, market capitalization and Asset4’s equally weighted CSR rating, are used to account for the effects of reputation and CSR, respectively. CSR encompasses a broader range of business activities, not limited to investment banking and applicable to a larger sample of banks, which are expected to financially enhance transactions from the bank’s point of view. Hence, CSR might influence market capitalization. However, it is expected that the inclusion of both variables simultaneously reflects their individual effects to a sufficient degree of accuracy. The extent of this is further discussed in the following section.
To operationalize differential reputation in a global sample of banks, market capitalization is converted to market share on a per year basis for each bank. Market share is calculated as follows:
𝐸𝑞𝑢𝑎𝑡𝑖𝑜𝑛 1: 𝑀𝑎𝑟𝑘𝑒𝑡 𝑆ℎ𝑎𝑟𝑒
𝑖𝑡=
𝑀𝑎𝑟𝑘𝑒𝑡 𝐶𝑎𝑝𝑖𝑡𝑎𝑙𝑖𝑧𝑎𝑡𝑖𝑜𝑛
𝑖𝑡∑ 𝑀𝑎𝑟𝑘𝑒𝑡 𝐶𝑎𝑝𝑖𝑡𝑎𝑙𝑖𝑧𝑎𝑡𝑖𝑜𝑛
𝑖 𝑖𝑡 13
See for example, Megginson & Weiss (1991), and Beatty & Welch (1996) where market share is used in
8
Marble
Research
Papers
where market share for the ith bank in period t is the bank’s market capitalization in period t over the sum of all bank’s market capitalizations in that period.
The bulk of the existing literature utilizes the KLD database to construct a CSR index and measures CSR accordingly. However, there have been concerns in the past about the relativity that is present within their CSR constructs (Chatterji, Levine & Toffel, 2007). More specifically, KLD measures the strengths and weaknesses of firm’s behavior in various areas, where a strength is denoted by +1, and a weakness is denoted by -1. The final CSR measure is simply the sum of the strengths and weaknesses. This approach implies that different firms can have the same CSR score if they exhibit as many strengths as weaknesses. Instead of using the KLD database, this paper operationalizes CSR by using Thomson Reuter’s Asset4 equally weighted rating. Asset4 is a Swiss-based company that provides data on environmental, social and governance characteristics of firms. It is estimated that investors representing more than €2.5 Trillion in assets under management use Asset4 data (Cheng, Ioannou & Serafeim, 2013). Compared to the KLD database, Asset4 constructs more robust measures of CSR performance. Cheng et al. (2013) provide an excellent overview of the mechanics:
“Annually, 900 data points are used as inputs to a default equal-weighted framework to calculate […] four pillars: (1) environmental performance score; (2) social performance score; (3) governance performance score; (4) economic performance score. In year t, a firm receives a z-score for each of the pillars, benchmarking its performance against the rest of the firms based on all information available in fiscal year t-1; therefore, by construction [the CSR score] is lagged.”
As is evident, Asset4’s score is based on absolute measures, and companies are benchmarked against each other based on four overarching performance pillars. A possible reason this database has been neglected so far is the limited number of available ratings. A casual observation reveals that most banks have no rating before the year 2002, potentially restricting empirical research. However, the database has been updated annually since then, up to and including 2015.
Financial performance is measured along traditional lines in five ways: share price, net interest income (NII), return on equity (ROE), return on assets (ROA), and return on invested capital (ROIC). Share price reflects the present value of the bank on a per share basis. Moreover, it is affected by the bank’s cost of capital, which is shown to be influenced by the degree of engagement in CSR (Dhaliwal et al., 2011; El Ghoul et al., 2011). Wu & Shen (2013) showed that CSR is positively related to NII, which is a function of loan and deposit amounts, and their respective interest rates. In line with the benefits of CSR, they argue that reputation aids in brand differentiation and ultimately leads to competitive advantage as high-CSR banks, more so than non-CSR banks, can attract more customers due to the creation of brand name and sense of identity. This increases the loan and deposit amounts. Whereas Wu & Shen (2013) take the ratio of NII over the sum of NII and non-interest income, this paper takes the natural logarithm of NII. ROE, ROA, and ROIC, though computationally similar, reflect different aspects of the business. ROE denotes the returns available to equity investors, ROA reflects the efficiency of the underlying assets, and ROIC is a measure of the quality of investments made by the bank.
Reputation, Corporate Social
Responsibility, and Financial
Performance of Banks
9
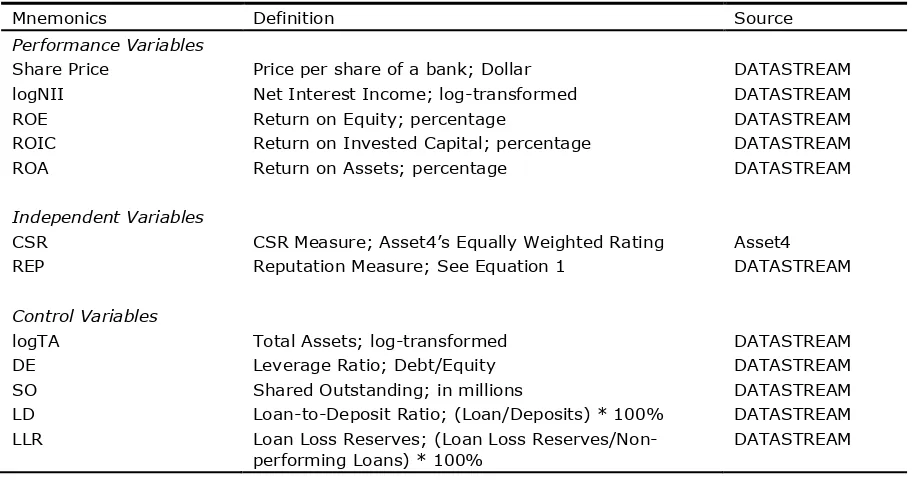
Shen (2013) further found the deposit ratio and loan loss reserves to be significant. The loan-to-deposit ratio reflects the type of business a bank focusses on, thus controlling for operational risk. Loan loss reserves control for clientele risk. Please refer to Table 1 for an overview of variables used and additional information.
Table 1: Variable Definitions
Mnemonics Definition Source
Performance Variables
Share Price Price per share of a bank; Dollar DATASTREAM
logNII Net Interest Income; log-transformed DATASTREAM
ROE Return on Equity; percentage DATASTREAM
ROIC Return on Invested Capital; percentage DATASTREAM
ROA Return on Assets; percentage DATASTREAM
Independent Variables
CSR CSR Measure; Asset4’s Equally Weighted Rating Asset4
REP Reputation Measure; See Equation 1 DATASTREAM
Control Variables
logTA Total Assets; log-transformed DATASTREAM
DE Leverage Ratio; Debt/Equity DATASTREAM
SO Shared Outstanding; in millions DATASTREAM
LD Loan-to-Deposit Ratio; (Loan/Deposits) * 100% DATASTREAM
LLR Loan Loss Reserves; (Loan Loss Reserves/Non-performing Loans) * 100%
DATASTREAM
3.2
The performance model
Substantial evidence exists that indicates an endogeneity problem in the data (Fang, 2005; Ross, 2010). One of the assumptions of ordinary least squares (OLS) regressions is that the data is independent. However, Fang (2005) and Ross (2010) show that, in fact, banks make systematic decisions regarding which clientele they serve, where highly reputable banks choose to serve a highly reputable clientele. Thus, the data is non-random, reputation is endogenous, and an omitted variable bias exists. Using OLS regressions could lead to the wrong conclusions. To account for some of the endogeneity concerns, the following fixed effects model is used:
𝑌
𝑖𝑡= 𝜇
0+ 𝛼
𝑖+ 𝛾
𝑡+ 𝛽
𝑖(𝑋
𝑖𝑡) + 𝜀
𝑖𝑡10
Marble
Research
Papers
𝑌
𝑖𝑡= 𝜇
0+ 𝛼
𝑖+ 𝛾
𝑡+ 𝛽
1𝐶𝑆𝑅
𝑖𝑡+ 𝛽
2𝑅𝐸𝑃
𝑖𝑡+ 𝛽
3𝑙𝑜𝑔𝑇𝐴
𝑖𝑡+ 𝛽
4𝐷𝐸
𝑖𝑡+ 𝛽
5𝑆𝑂
𝑖𝑡+ 𝛽
6𝐿𝐷
𝑖𝑡+ 𝛽
8𝐿𝐿𝑅
𝑖𝑡+ 𝜀
𝑖𝑡where Y is either of the financial performance measures, and ε ~ iddN(0, σ_ε2). CSR is Asset4’s CSR score, REP is the reputation proxy, logTA represents log-transformed total assets, DE is the leverage ratio, SO is the number of shares outstanding in millions, LD is the loan-to-deposit ratio, and LLR is loan loss reserves over nonperforming loans. The Hausman specification test (excluding time fixed effects) turned significant (p-value < 0.000) in four out of five regression specifications, further justifying the use of a fixed effects model.
4.
Descriptive statistics
All data is gathered from Thomson Reuter’s DATASTREAM database, which contains detailed information on equity metrics, including market capitalization and Asset4’s CSR ratings. Yearly panel data for 83 globally dispersed banks is collected over the period 2002-2015 as most data points are determined on an annual basis and CSR data prior to 2002 is mostly absent. After removing banks with less than eight observations on any independent variable, 63 banks remain. Dependent, independent and control variable observations are largely present across the whole sample. The final sample is an unbalanced panel dataset that contains 10,194 bank-year observations.
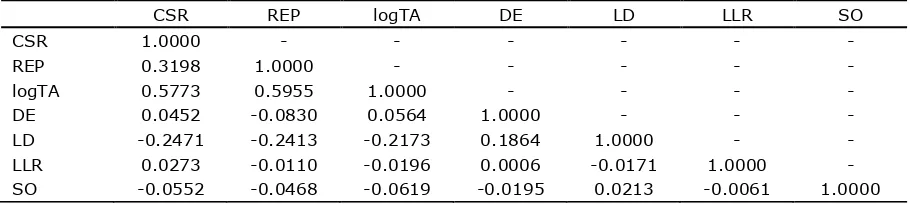
The correlation coefficients are reported in Table 2. The correlation between CSR score and market share is small at 0.32, indicating that the two independent variables exhibit individual movement patterns. Further, the table shows two coefficients above 0.5 between LogTA and CSR, and LogTA and market share. Multicollinearity, however, may not be a problem given the low correlations between all other variables.
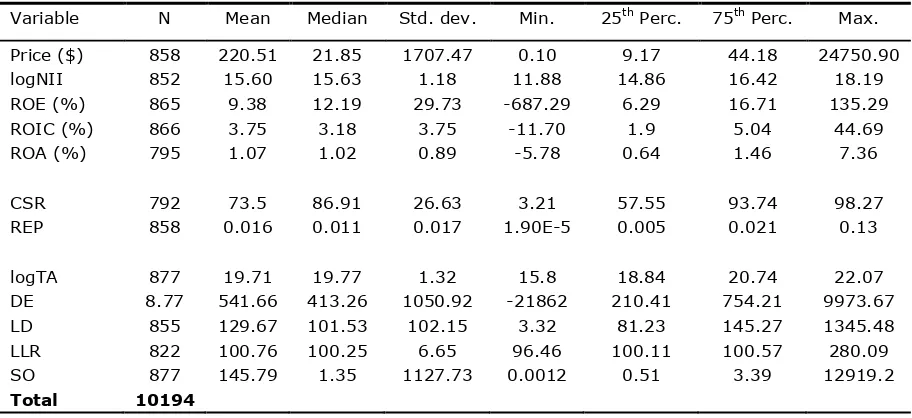
Table 3 provides the summary statistics for the full sample set across the dependent performance measures, independent variables, and control variables. With regards to the performance measures, the average value for the share price is $220.51 and the standard deviation is $1707.47, suggesting that extreme variation exists among the banks. This is caused by outliers such as a share price of close to $25,000. Similarly, high deviations exist for ROE, ROIC and ROA, which is most likely due to the impact of the financial crisis.
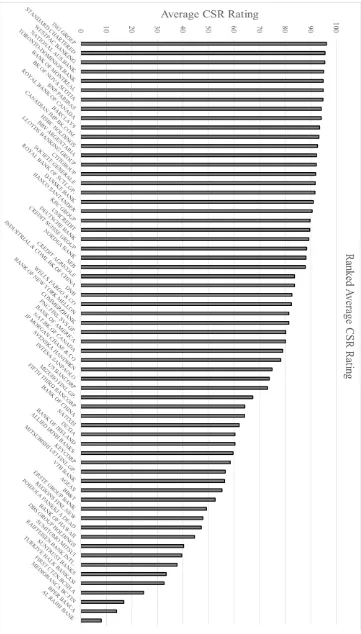
The sample averages for these measures are 9.38%, 3.75% and 1.07%, respectively. The Table shows that relatively less variation exists for NII, which does not show extreme outliers. The mean value for the CSR rating is 73.5 out of 100, but the median of 86.91 suggests that most ratings are in the upper range of the rating spectrum, with outliers at the bottom.
Table 2: Correlation Matrix
CSR REP logTA DE LD LLR SO
CSR 1.0000 - - - -
REP 0.3198 1.0000 - - - - -
logTA 0.5773 0.5955 1.0000 - - - -
DE 0.0452 -0.0830 0.0564 1.0000 - - -
LD -0.2471 -0.2413 -0.2173 0.1864 1.0000 - -
LLR 0.0273 -0.0110 -0.0196 0.0006 -0.0171 1.0000 -
Reputation, Corporate Social
Responsibility, and Financial
Performance of Banks
11
Table 3: Summary Statistics
Variable N Mean Median Std. dev. Min. 25th Perc. 75th Perc. Max.
Price ($) 858 220.51 21.85 1707.47 0.10 9.17 44.18 24750.90
logNII 852 15.60 15.63 1.18 11.88 14.86 16.42 18.19
ROE (%) 865 9.38 12.19 29.73 -687.29 6.29 16.71 135.29
ROIC (%) 866 3.75 3.18 3.75 -11.70 1.9 5.04 44.69
ROA (%) 795 1.07 1.02 0.89 -5.78 0.64 1.46 7.36
CSR 792 73.5 86.91 26.63 3.21 57.55 93.74 98.27
REP 858 0.016 0.011 0.017 1.90E-5 0.005 0.021 0.13
logTA 877 19.71 19.77 1.32 15.8 18.84 20.74 22.07
DE 8.77 541.66 413.26 1050.92 -21862 210.41 754.21 9973.67
LD 855 129.67 101.53 102.15 3.32 81.23 145.27 1345.48
LLR 822 100.76 100.25 6.65 96.46 100.11 100.57 280.09
SO 877 145.79 1.35 1127.73 0.0012 0.51 3.39 12919.2
Total 10194
Overall, banks seem to be very socially responsible based on these observations. The average bank occupied 0.016% of the sample’s total market accompanied with a high standard deviation, suggesting that a few banks stick out of the crowd market-share wise.
Asset size of the sample set ranges between approximately $7 million to $4.4 billion, based on the log-transformed measure for total assets. On average, banks had approximately 540 times more debt than equity outstanding, with high variation, and about half the banks lend more than their deposit values. The banks in the sample set show accurate loan loss reserve policies, with an average of around a 100% coverage ratio and a low standard deviation. The average number of shares outstanding is approximately 146 million, which ranges between 1200 and 13 billion shares.
12
Marble
Research
Papers
Reputation, Corporate Social
Responsibility, and Financial
14
Marble
Research
Papers
5.
Empirical findings
5.1
Baseline results
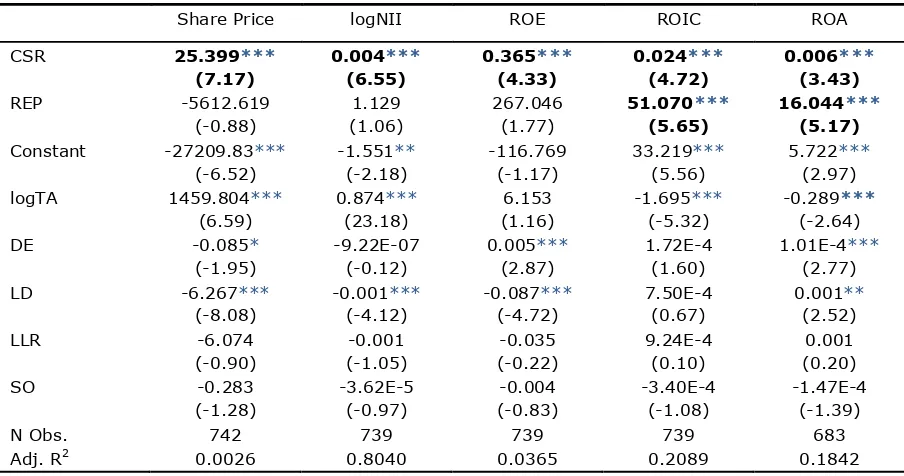
Table 4 represents the estimation results from the fixed effects performance regression over the full sample, where the dependent variables are share price, NII, ROE, ROIC, and ROA. The specifications control for bank and time fixed effects.
In column 1, the coefficient of CSR is positive and highly significant (25.399, p-value < 0.01), suggesting that, on average, firms with better CSR performance see their efforts positively reflected in the share price. The estimated relationship indicates that banks that increase their Asset4 rating by one point, keeping everything else constant, subsequently enjoy upward of a 25$ increase in share price on average. This finding is economically significant, as the median share price is far below 25$. The exact cause of this is likely to differ on an individual basis, as benefits of CSR can manifest themselves in numerous ways. Reputation has no significant effect on share price, suggesting that investors do not recognize reputation as a profit generator. Furthermore, firm size and loan-to-deposit are highly significant. The estimation suggests that a one percent increase in firm size is met with a 14.60$ increase in share price.
Alternatively, larger firms enjoy higher share prices, which makes intuitive sense; banks invest in assets that produce positive net present values. In contrast, an increase in loans underwriting relative to total deposits decreases the share price. On the one hand, loans generate interest income, a part of which can be expected with certainty and should be valued by the market as such. Under this assumption, we would expect a positive coefficient. On the other hand, the variable is likely proxying a business model that is inherently riskier. Banks that underwrite more loans relative to deposits are taking a leveraged position when channeling liquidity towards uncertain investments, which increases business risk. It appears the market takes the latter point of view and discounts shares accordingly. A cautionary note is required: out of all regression results, this estimation has the lowest R-squared at 0.0026. It is evident that a considerable amount of variance is not explained by the model and that additional control variables are required to make more pragmatic statements.
Reputation, Corporate Social
Responsibility, and Financial
Performance of Banks
15
Table 4 Performance Regression: Linear Baseline Specifications
Share Price logNII ROE ROIC ROA
CSR 25.399*** (7.17) 0.004*** (6.55) 0.365*** (4.33) 0.024*** (4.72) 0.006*** (3.43)
REP -5612.619
(-0.88) 1.129 (1.06) 267.046 (1.77) 51.070*** (5.65) 16.044*** (5.17)
Constant -27209.83*** (-6.52) -1.551** (-2.18) -116.769 (-1.17) 33.219*** (5.56) 5.722*** (2.97)
logTA 1459.804***
(6.59) 0.874*** (23.18) 6.153 (1.16) -1.695*** (-5.32) -0.289*** (-2.64)
DE -0.085*
(-1.95) -9.22E-07 (-0.12) 0.005*** (2.87) 1.72E-4 (1.60) 1.01E-4*** (2.77)
LD -6.267***
(-8.08) -0.001*** (-4.12) -0.087*** (-4.72) 7.50E-4 (0.67) 0.001** (2.52)
LLR -6.074
(-0.90) -0.001 (-1.05) -0.035 (-0.22) 9.24E-4 (0.10) 0.001 (0.20)
SO -0.283
(-1.28) -3.62E-5 (-0.97) -0.004 (-0.83) -3.40E-4 (-1.08) -1.47E-4 (-1.39)
N Obs. 742 739 739 739 683
Adj. R2 0.0026 0.8040 0.0365 0.2089 0.1842
*** P < 0.01; ** p < 0.05; * p < 0.10. Based on two-tailed tests, bank and time fixed effects. T-statistics are reported in parentheses.
In column three, ROE is used to test whether better CSR or reputation increases returns to equity holders. Again, CSR shows a high positive correlation with ROE (0.365, p-value < 0.01), suggesting that shareholder returns increase as banks become more socially responsible. However, shareholders only reap significant economic value if a considerable change in CSR rating occurs - the coefficient is less than 3% of the mean value and banks employ extremely low amounts of equity, and a 20-point increase (on a 100-point scale) would represent a change from the 25th to the 50th percentile. Moreover, there seems to be no difference in shareholder returns between less and more reputable banks, as indicated by the insignificance of the variable. Thirdly, consistent with the idea that risk increases reward, the leverage ratio is significantly and positively related to ROE. Even though the coefficient is small, the variable covers a tremendous range. The mean value reflects an ROE of nearly 3%, which is approximately equivalent to moving from the sample’s 25th to the 75th percentile of the leverage ratio. An increase in LD is found to reduce ROE, which is logical considering distributable funds are reinvested into risky endeavors. Its economic impact is negligible, however. Similar to the share price, this specification explains only a fraction of the variation.
16
Marble
Research
Papers
larger than moving from the 25th to the 75th percentile in market share. Regardless, in response to Fang’s (2005) inquiry, the findings suggest that a positive relationship exists between reputation and the ROIC and ROA measures for financial performance. Other significant relationships exhibit negligible effects.
5.2
Extended Analysis: Reputation and CSR Hierarchy
A potential concern for banks is the difference in difficulty of obtaining a better CSR rating compared to improving market share. Amassing reputation is a difficult task, both conceptually and practically. Conceptually, reputation is build up over years of successful operations and interactions with many different stakeholders. In contrast to CSR scores, which are published and relatively easily observable by outside investors, the derivation of reputation is only possible through experience; bank services are experience goods of which the quality cannot be known beforehand. Practically, for a bank to increase market share by a significant margin, it would have to convincingly signal that its reputational increases generate future profits, which would subsequently be reflected by the share price. The baseline findings, however, are not supportive of this. It seems, then, that the most feasible way of bettering financial performance within this framework is to focus on CSR. To further the analysis hereon, the dataset is split at the median of the reputation variable, and regressions similar to the baseline regression are performed. The main reason the median is chosen is to preserve the number of observations for each panel regression and because it is robust against outliers. Analysis of the underlying distribution of the CSR variable in the two subsamples reveals that the mean (standard deviation) of CSR in the lower half is equal to 61.64 (28.86), and 84.44 (18.62) in the upper half. Hence, the analysis effectively estimates the effects of CSR and reputation for less reputable, less socially responsible banks, and reputable, socially responsible banks. While this specification limits practical interpretations to these two regimes, it suggests a pattern in the effect of CSR and reputation between the regimes. Table 5 shows estimated coefficients, where panel A represents the lower regime and panel B represent the higher regime.
Three striking observations can be made from Table 5. (1) Reputation has become a significant predictor of every financial performance measure in both specifications. (2) CSR is a more significant and impactful enhancer of financial performance across all measures in the lower regime compared to the higher regime. (3) Factor loadings are universally larger in the lower regime. These findings suggest that less reputable banks enjoy greater overall benefits from improving their reputation in both the market and social environment. More specifically, CSR and reputation seem to be curvilinearly related to financial performance. Unreported analysis supports this suggested relationship4. More reputable banks can still enjoy improved financial performance due to enhanced reputation, but in a diminished sense, which is logical from an economic perspective. A set reputational improvement for less reputable banks cannot reasonably be expected to deliver the same results as for highly reputable banks. Looking at the coefficients, income generated through reputation is valued by the market as reflected by the positive and significant share price coefficient (lower: 381052.70, p-value < 0.01; upper: 2507.94, p-value < 0.01). Given the size of the factor loadings, this effect is economically very significant, despite the difficulty of obtaining reputation. Moreover, reputation has a stronger effect on NII than CSR. Even
4 Further analysis was performed on the distributions of CSR and reputation. Dummy variables representing
Reputation, Corporate Social
Responsibility, and Financial
Performance of Banks
17
though reputation theoretically should not influence the decision to use a bank’s deposit services, the effect of reputation18
Marble
Research
Papers
could spill over to the loans market in a similar way Chemmanur & Fulghieri (1994) and Fang (2005) found that banks can charge higher fees and yields on their services if they are more reputable. The results seem to indicate that reputation allows banks to either increase their deposit business or charge higher rates on deposits. This relationship might manifest itself through the mechanics of underwriting. More reputable banks can reduce information asymmetry between themselves and their clients more effectively than less reputable banks (Chemmanur & Fulghieri, 1994). This knowledge advantage allows the bank to dictate fairer term conditions on loans and deposits. Alternatively, as reputation attracts more clients (Chemmanur & Fulghieri, 1994), the increased savings and loans business might be a result of convenience from the client’s side. Lastly, reputation also increases shareholder returns, investment returns, and efficiency of assets. The interpretations of the coefficients are equivalent to those discussed in the baseline analysis.
6.
Robustness checks
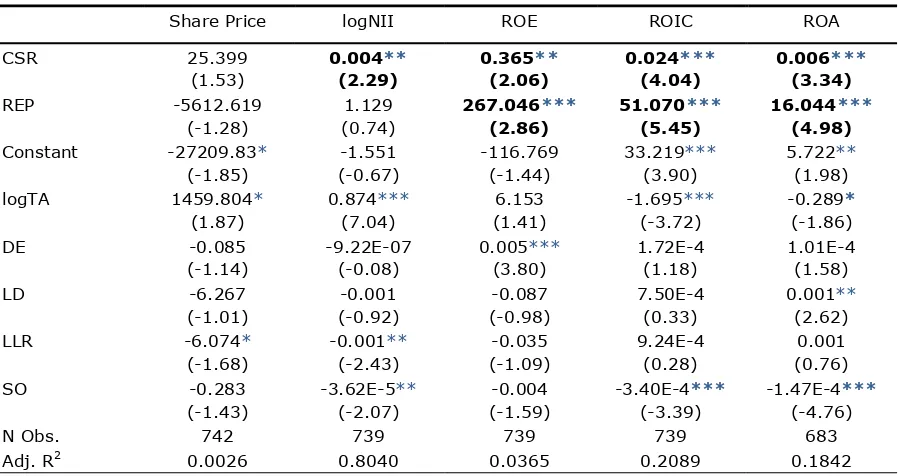
This section tests the robustness of the results against two different specifications5. Firstly, the endogeneity problem is further analyzed by clustering standard errors at the bank level. Secondly, the empirics are tested cross-sectionally based on recent data.
6.1
Clustered standard errors
Given the omitted variable bias problem due to endogeneity, the independently and identically distributed assumption of the error term ε might be violated. This section loosens the assumptions on within-cluster (group) correlation. More specifically, groups of banks within the sample might be affected uniformly by unobserved phenomena. Hence, dependence might exist in the standard errors. For example, possible within-cluster correlation of errors might be caused by types of business - investment banks face different conditions than commercial banks. Table 6 reports the findings based on bank and time fixed effects, as well as standard errors clustered at the bank- level. Largely consistent with the baseline analysis, CSR remains a significant predictor of financial performance measured by logNII, ROE, ROIC and ROA. It is, however, no longer significantly related to the share price. Combined with the hierarchy analysis, this result seems to suggest that CSR influences the share price of a certain subsample of banks that is represented by low reputation and CSR scores which reinforces concerns about omitted variables. In contrast, reputation has become a significant predictor of ROE, with great economic impact. The robustness estimation suggests that a modest increase in market share by 0.01-point increases ROE by approximately 2.67%, or 28% of the mean value. Overall, the results are robust against clustered standard errors.
5 A third robustness test was performed where the CSR and reputation variables were transformed to represent
Reputation, Corporate Social
Responsibility, and Financial
Performance of Banks
19
6.2
Cross-sectional validity
To validate the baseline results, an OLS regression is performed cross-sectionally on 2015 data, which was chosen because of its recency and relatively few missing observations. This robustness test strengthens the notion that the above specified findings are still relevant in a contemporaneous setting, rather than being an artefact of the past. Table 7 reports the findings on the cross-sectional regression, based on standard errors clustered at the bank level.
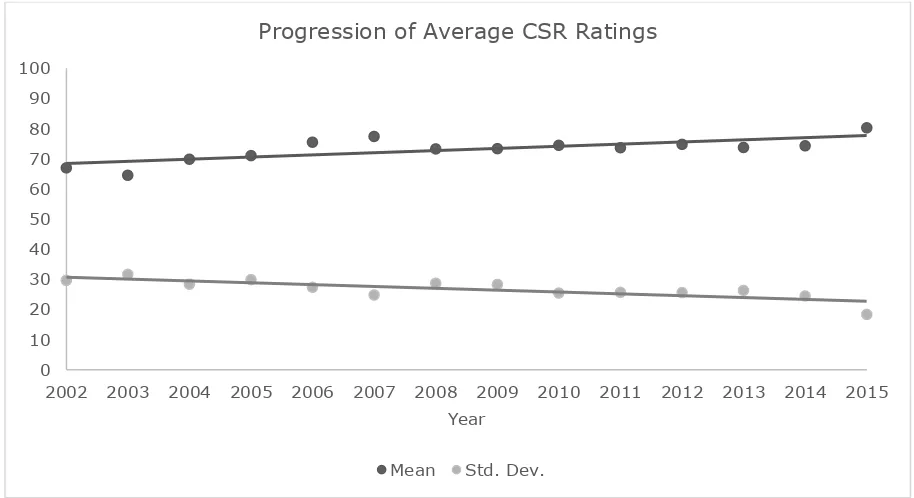
Two striking observations can be made. Firstly, reputation is highly positively correlated to financial performance across all specifications, with both statistical and economic significance. The interpretation of the coefficients is identical to the baseline regression. Compared to the baseline, the factor loadings are larger for the share price and logNII specifications, but smaller for ROE, ROIC, and ROA. For example, a 0.01-point increase enjoys a $7.27 share price increase on average. In current state of affairs, banks with greater reputation exhibit better financial performance. In contrast to previous findings, corporate social responsibility exhibits no effect on financial performance in the year 2015. The findings can be explained based on the progression of Asset4’s CSR scores awarded to the banks in the sample set. Figure 3 shows the average CSR scores over the period 2002-2015, as well as the standard deviation of the scores. Evident is the upward trend in average score, and downward trend in spread. Quantitatively, a significant time trend shows that mean CSR scores have been increasing by 0.71 points annually, whereas its standard deviation has been decreasing by 0.62 points annually. In other words, scores are becoming progressively higher and homogenous. This observation provokes the idea of CSR as an operating license, rather than competitive advantage. However, this result does not invalidate previous findings. The results in Table 7 are based on a single year’s observations – between 51 and 58 – compared to a full panel of data. Combined with the baseline results, however, it is supportive of the idea that increases in CSR scores lead to better financial performance, rather than the numerical value
Table 6 Robustness Check 1: Linear Cluster-Robust Standard Error Specifications
Share Price logNII ROE ROIC ROA
CSR 25.399
(1.53) 0.004** (2.29) 0.365** (2.06) 0.024*** (4.04) 0.006*** (3.34)
REP -5612.619
(-1.28) 1.129 (0.74) 267.046*** (2.86) 51.070*** (5.45) 16.044*** (4.98)
Constant -27209.83* (-1.85) -1.551 (-0.67) -116.769 (-1.44) 33.219*** (3.90) 5.722** (1.98)
logTA 1459.804*
(1.87) 0.874*** (7.04) 6.153 (1.41) -1.695*** (-3.72) -0.289* (-1.86)
DE -0.085
(-1.14) -9.22E-07 (-0.08) 0.005*** (3.80) 1.72E-4 (1.18) 1.01E-4 (1.58)
LD -6.267
(-1.01) -0.001 (-0.92) -0.087 (-0.98) 7.50E-4 (0.33) 0.001** (2.62)
LLR -6.074*
(-1.68) -0.001** (-2.43) -0.035 (-1.09) 9.24E-4 (0.28) 0.001 (0.76)
SO -0.283
(-1.43) -3.62E-5** (-2.07) -0.004 (-1.59) -3.40E-4*** (-3.39) -1.47E-4*** (-4.76)
N Obs. 742 739 739 739 683
Adj. R2 0.0026 0.8040 0.0365 0.2089 0.1842
20
Marble
Research
Papers
itself. This idea is appealing as it isolates the effect of CSR, rather than viewing it in conjunction with a business which is composed of many
*** P < 0.01; ** p < 0.05; * p < 0.10. Based on two-tailed tests, and standard errors clustered at the bank-level. T-statistics are reported in parentheses.
Figure 3: Progression of annual average Asset4 scores over the period 2002-2015. The average values are based on available observations.
0 10 20 30 40 50 60 70 80 90 100
2002 2003 2004 2005 2006 2007 2008 2009 2010 2011 2012 2013 2014 2015 Year
Progression of Average CSR Ratings
Mean Std. Dev.
Table 7 Robustness Check 2: Cross-Sectional Cluster-Robust Standard Error Specifications for 2015
Share Price logNII ROE ROIC ROA
CSR -0.098
(-0.23) 0.001 (0.46) 0.055 (1.18) -0.030 (-1.02) -0.003 (-0.97) REP 727.388***
(3.09) 11.151*** (4.59) 142.541** (2.62) 47.134*** (2.84) 13.686*** (4.34)
Constant 4355.946
(1.35) -22.596 (-0.50) -797.001 (-1.40) -500.057** (2.19) -76.495** (-1.98)
logTA -16.527**
(2.63) 0.765*** (13.03) -2.981*** (-3.04) -1.134*** (3.61) -0.184*** (-3.29)
DE 0.0187
(1.09) -0.001*** (-3.56) 0.003 (0.63) -0.001 (-0.53) -0.001* (-1.99)
LD -0.142*
(-1.81) 2.02E-4 (0.16) -0.012 (-0.43) 4.60E-4 (0.04) 0.006*** (4.04)
LLR -39.838
(-1.27) 0.231 (0.51) 8.575 (1.51) 5.274** (2.33) 0.806** (2.11)
SO -0.002***
(-3.68) 1.67E-5** (2.55) -0.001*** (-7.07) -3.22E-4*** (-5.80) -7.45E-5*** (-10.05)
N Obs. 58 58 57 57 51
Reputation, Corporate Social
Responsibility, and Financial
Performance of Banks
21
different facets. In other words, the Asset4 score is not ex ante indicative of financial performance. Any given business can enjoy better financial performance by improving its CSR, irrespective of the initial score.7.
Discussion and Conclusion
This article investigates whether reputation and CSR engagements affect bank’s financial performance on a global scale. Previous research established that reputable banks perform high quality services and cherry-pick more reputable clients which they charge higher fees (Carter & Manaster, 1990; Megginson & Weiss, 1991; Chemannur & Fulghieri, 1994; Livingston & Miller, 2000; Fang, 2005; Ross, 2010). However, the fees relationship with the cost of providing higher quality services remains obfuscated. To explicate the effects of reputation on financial performance, this paper finds that reputation increases financial performance as measured by ROE, ROIC, and ROA. In other words, more reputable banks earn higher returns for their shareholders, earn higher returns on their investments, and use their assets more efficiently. These findings materialize via endogenous issuer-underwriter matching as stipulated by Fang (2005) and as explained above – reputable clients pose better investment opportunities, creating larger profits available to shareholders and leading to more efficient institutions. This effect is curvilinear and contemporaneously relevant, implying that less reputable banks can extract greater benefits from improved reputation compared to the bulge bracket in current markets.
Previous research had not considered bank’s CSR policy and reputation in a joint context. Whereas reputation is a concern in business-to-business markets where information asymmetry plays a crucial role, CSR policy enhances the bank’s image as perceived from a public standpoint. Hence, reputation and CSR represent two sides of the same coin and should be considered simultaneously. Moreover, the effects of CSR on financial performance continues to be a hotly debated topic as no conclusive evidence is being found, especially in the banking sector. Although it has been argued in the past that CSR might impose unnecessary and readily visible costs to a firm (Waddock & Graves, 1997; Wu & Shen, 2013), and thus negatively impact financial performance, this paper provides evidence that the reverse is true: banks with better CSR enjoy better financial performance as measured by NII, ROE, ROIC and ROA. The effect on share price remains unclear, but the results suggest that less reputable and socially responsible banks see CSR efforts positively reflected in the share price. Moreover, like reputation, CSR stands in curvilinear relationship to financial performance, implying that socially less responsible banks enjoy greater benefits by improving CSR than more responsible banks. Finally, evidence is found that suggests the numerical CSR score is not the determinant of financial performance. Instead, CSR score improvements are financial performance drivers.
22
Marble
Research
Papers
both require banks to attract the necessary, scarce resources and develop competences to produce higher quality services or engage responsibly in more diverse stakeholder relationships. However, the speed at which resources are obtained and results reached differs. Competitors cannot feasibly observe the production of high quality services as these are based on tacit knowledge and intelligence. Additionally, attracting talent that is capable of improving the bank’s reputation is costly for non-reputable banks. In case the bank manages to adapt its capabilities to provide services equivalent to those of reputable competitors, convincing the market hereof remains complicated. The bank essentially produces experience goods, the quality of which cannot ex ante be observed, in a business-to-business market marked by a limited number of participating stakeholders. Further, Johnson (1997) and Livingston & Miller (2000) show that duration of issuer-underwriter relationship reduces issuance costs for repeat business. Hence, incumbent reputable firms need exorbitant incentives to switch from their current service provider, which allows for higher net proceeds and has an extended operating history, to the newly reputable bank. In contrast, the means to rebrand into a more socially responsible institution are, while difficult to obtain, more accessible from the bank’s point of view. Additionally, the outcome is more observable from investors’, researchers’ and the general public’s perspective. Firstly, competitors’ activity within the realm of CSR are readily observable through the media and detailed company reports, in contrast to proprietary business practices. Dhaliwal et al. (2011) empirically show that socially responsible firms have financial incentives to voluntarily disclose their CSR policies and activities. Secondly, high awareness exists amongst the public due to ongoing scrutiny of banks by the media (Cornett et al., 2014; Fatemi et al., 2015) and embeddedness of banks in their communities (Wu & Shen, 2013; Cornett et al., 2014). Early media and investor coverage, researchers’ attention, and public awareness speed up the dissemination of information through the marketplace. Lastly, CSR activities are not purely intangible. Tangible outcomes, such as community investments or charities, can be disclosed on an annual basis in detailed CSR reports, further increasing awareness. Note, however, that rebranding does not mean that the bank has developed the required competences to successfully and lucratively engage in CSR endeavors. Still, reducing information asymmetry between the bank and external stakeholders when it comes to social responsibility arguably poses less of a problem then when dealing in services in a cut-throat industry.
Additionally, this paper shows that the findings presented here can be generalized to a global scale. The banks included in the sample size were globally dispersed and characteristically heterogeneous. It further finds indications of the CSR-value curve as suggested by McWilliams & Siegel (2001), Koh et al. (2014), and Fatemi et al. (2015), who argued that a certain CSR investment optimum exists which maximizes firm value. The existence of such a curve would explain the differential effect of CSR on financial performance between less and more socially responsible banks. A similar reputation-value curve is not likely to exist given that reputation remained significant, unlike CSR.
Reputation, Corporate Social
Responsibility, and Financial
Performance of Banks
23
financial performance, as shown in this paper, it affects the market capitalization, or reputation, of banks, potentially confounding the research. If CSR worked through reputation, however, this would serve to reduce the significance of the CSR variable. As it remained significant at the 1% level in almost all specifications, there is strong reason to believe this paper yields pragmatic results on the effect of CSR and reputation on the financial performance of banks.Another limitation is causality. This paper did not explicitly test for causality, but instead turned to theory and previous research to justify the results. For example, Wu & Shen (2013) robustly showed that CSR is positively linked to financial performance, which is confirmed in this paper. However, no such research exists on the relationship between market reputation and financial performance of banks; this paper pioneered the empirics.
Finally, the models used in this paper generally exhibited low adjusted R-squared values, indicating that a large portion of variation is not explained by the model. This is caused by the inclusion of a limited number of control variables. The risk hereof is that stronger models would find different coefficients or significances for CSR and market reputation. However, during the analysis, each additional control variable served to increase the significance of CSR and reputation. Given the theory, the findings of this paper are assumed to hold in research going forward.
Based on the findings and limitations, this paper creates a few avenues for future research. Firstly, it commenced the exploration of the relationship between reputation and financial performance. While it found statistically significant findings, economic benefits seemed to be a function of the relative position and/or strategy of the bank in question. Another research avenue is to quantify in which settings reputation improves financial performance, and test for causality. Further, additional research is required to fully understand the effects of CSR on financial performance. A curvilinear relationship seems to exist, implying an investment optimum. Moreover, the findings suggest that CSR scores are not indicative of financial performance. Instead, score improvements are performance drivers. Additional research is required to explicate these mechanics.
Healthy financial institutions are key to sustained prosperity (King & Levine, 1993). In a global economy that has nearly fully recovered from the worst financial crisis since the 1930s, where banks have become a matter of great public scrutiny, and with a population that increasingly values transparent, sustainable and ethical business practices, this paper brings forth new managerial and academic insights. CSR is slowly becoming the basis of business. I suggest firstly, that banks can develop tangible benefits in the form of increased firm value and financial performance through CSR, especially when CSR is initially weak. Secondly, financial benefits can be expected to accrue to banks that can improve their reputation in financial markets. Stated differently, social responsibility and the production of high quality goods are good businesses.
References
Bauer, R., Koedijk, K., & Otten, R. (2005). International evidence on ethical mutual fund performance and investment style. Journal of Banking & Finance, 29(7), 1751-1767.
Beatty, R. P., & Ritter, J. R. (1986). Investment banking, reputation, and the underpricing of initial public offerings. Journal of financial economics, 15(1-2), 213-232.
Beatty, R. P., & Welch, I. (1996). Issuer expenses and legal liability in initial public offerings. The Journal
of Law and Economics, 39(2), 545-602.
Booth, J. R., & Smith, R. L. (1986). Capital raising, underwriting and the certification hypothesis. Journal of Financial Economics, 15(1), 261-281.
24
Marble
Research
Papers
Bushman, R. M., & Wittenberg-Moerman, R. (2012). The role of bank reputation in “certifying” future performance implications of borrowers’ accounting numbers. Journal of Accounting Research, 50(4), 883-930.
Carter, R., & Manaster, S. (1990). Initial public offerings and underwriter reputation. The Journal of Finance, 45(4), 1045-1067.
Chatterji, A. K., Levine, D. I., & Toffel, M. W. (2007). Do corporate social responsibility ratings predict
corporate social performance?. Division of Research, Harvard Business School.
Chemmanur, T. J., & Fulghieri, P. (1994). Investment bank reputation, information production, and financial intermediation. The Journal of Finance, 49(1), 57-79.
Cheng, B., Ioannou, I., & Serafeim, G. (2014). Corporate social responsibility and access to finance. Strategic Management Journal, 35(1), 1-23.
Chih, H. L., Chih, H. H., & Chen, T. Y. (2010). On the determinants of corporate social responsibility: International evidence on the financial industry. Journal of Business Ethics, 93(1), 115-135. Cornett, M. M., Erhemjamts, O., & Tehranian, H. (2014). Corporate social responsibility and its impact
on financial performance: Investigation of U.S. commercial banks. Unpublished manuscript.
DeAngelo, L. E. (1981). Auditor size and audit quality. Journal of accounting and economics, 3(3), 183-199.
Dennis, S. A., & Mullineaux, D. J. (2000). Syndicated loans. Journal of financial intermediation, 9(4), 404-426.
Dhaliwal, D. S., Li, O. Z., Tsang, A., & Yang, Y. G. (2011). Voluntary nonfinancial disclosure and the cost of equity capital: The initiation of corporate social responsibility reporting. The accounting review, 86(1), 59-100.
Dimson, E., Karakaş, O., & Li, X. (2015). Active ownership. Review of Financial Studies, 28(12), 3225-3268.
Easterbrook, F. H. (1984). Two agency-cost explanations of dividends. The American Economic Review, 74(4), 650-659.
El Ghoul, S., Guedhami, O., Kwok, C. C., & Mishra, D. R. (2011). Does corporate social responsibility affect the cost of capital?. Journal of Banking & Finance, 35(9), 2388-2406.
Fang, L. H. (2005). Investment bank reputation and the price and quality of underwriting services. The Journal of Finance, 60(6), 2729-2761.
Fombrun, C. J., Gardberg, N. A., & Barnett, M. L. (2000). Opportunity platforms and safety nets: Corporate citizenship and reputational risk. Business and society review, 105(1), 85-106.
Ioannou, I., & Serafeim, G. (2012). What drives corporate social performance? The role of nation-level institutions. Journal of International Business Studies, 43(9), 834-864.
Johnson, S. A. (1997). The effect of bank reputation on the value of bank loan agreements. Journal of Accounting, Auditing & Finance, 12(1), 83-100.
Kim, Y., Li, H., & Li, S. (2014). Corporate social responsibility and stock price crash risk. Journal of Banking & Finance, 43, 1-13.
Kim, K. H., Kim, M., & Qian, C. (2015). Effects of Corporate Social Responsibility on Corporate Financial Performance: A Competitive-Action Perspective. Journal of Management, 1-22.
King, R. G., & Levine, R. (1993). Finance and growth: Schumpeter might be right. The quarterly journal of economics, 717-737.
Klein, B., & Leffler, K. B. (1981). The role of market forces in assuring contractual performance. Journal of political Economy, 89(4), 615-641.
Koh, P. S., Qian, C., & Wang, H. (2014). Firm litigation risk and the insurance value of corporate social performance. Strategic Management Journal, 35(10), 1464-1482.
Livingston, M., & Miller, R. E. (2000). Investment bank reputation and the underwriting of nonconvertible debt. Financial Management, 21-34.
Logue, D. E., & Rogalski, R. J. (1979). Does it pay to shop for your bond underwriter. Harvard Business Review, 57(4), 111-117.
Margolis, J. D., & Walsh, J. P. (2003). Misery loves companies: Rethinking social initiatives by business. Administrative science quarterly, 48(2), 268-305.
Martin, J., Petty, W., & Wallace, J. (2009). Shareholder value maximization—Is there a role for corporate social responsibility?. Journal of Applied Corporate Finance, 21(2), 110-118.
McWilliams, A., & Siegel, D. (2001). Corporate social responsibility: A theory of the firm perspective. Academy of management review, 26(1), 117-127.
Megginson, W. L., & Weiss, K. A. (1991). Venture capitalist certification in initial public offerings. The Journal of Finance, 46(3), 879-903.
Peloza, J. (2006). Using corporate social responsibility as insurance for financial performance. California
Management Review, 48(2), 52-72.
Reputation, Corporate Social
Responsibility, and Financial
Performance of Banks
25
Ross, D. G. (2010). The “dominant bank effect:” How high lender reputation affects the information content and terms of bank loans. Review of Financial Studies, hhp117.
Schadler, F. P., & Manuel, T. L. (1994). Underwriter choice and announcement effects for seasoned equity offerings. Journal of Financial and Strategic Decisions, 7(2), 53-65.
Shapiro, C. (1983). Premiums for high quality products as returns to reputations. The quarterly journal of economics, 98(4), 659-679.
Titman, S., & Trueman, B. (1986). Information quality and the valuation of new issues. Journal of
Accounting and Economics, 8(2), 159-172.
Waddock, S. A., & Graves, S. B. (1997). The corporate social performance-financial performance link. Strategic management journal, 303-319.
Wakeman, L. M. (1981). The real function of bond rating agencies. Chase Financial Quarterly, 1(1), 18-26.