Please cite this article as: M. Kafi, J. Ranjbar, J. Khalilpour, S. Zarezade, A Novel Method for Detecting Targets on Inactive Radars Using an Adaptive Processing on the Ambiguity Function, International Journal of Engineering (IJE), IJE TRANSACTIONS C: ASPECTS Vol. 31, No. 6, (June 2018) 916-920
International Journal of Engineering
J o u r n a l H o m e p a g e : w w w . i j e . i rA Novel Method for Detecting Targets on Inactive Radars Using an Adaptive
Processing on the Ambiguity Function
M. Kafi*, J. Ranjbar, J. Khalilpour, S. Zarezade
Department of Electrical and Computer Engineering, Khatam Al Anbia University, Tehran, Iran
P A P E R I N F O
Paper history:
Received 10 November 2017
Received in revised form 23 December 2017 Accepted 04 Januray 2018
Keywords: Bistatic Passive Radar Ambiguity Function Delay
Doppler Noise
A B S T R A C T
In this paper a novel method for detecting targets in inactive radars is presented. In this method, the time history of cellsof the ambiguity function is used for detection. For this purpose, the cell history is considered as a random field. Then, using adaptive filter, the string time of the desired target are separated from the string time of noise and clusters in the environment. In order to evaluate the performance of the proposed method for an environment including three targets with simulated different distances and speeds, the results were compared with the other two methods at the same conditions. Based on the results obtained, this method has the ability to detect targets for SCNRs of up to -10 dB for all three values of the probability of false alarms. The obtained results also showed the superiority of the proposed method compared to other alternatives in such manner. Accordingly, the probability of detection for the proposed method at least 12.5 percent better than ACM and 8 percent better than NNTD. It also shows that for SCNRs larger than zero dB, this method has a 100% detection capability
doi: 10.5829/ije.2018.31.06c.08
1. INTRODUCTION1
Many radars use the two parameters delayed and Doppler shift signal to track and detect targets. For this reason, for each radar scan, an ambiguity function is created in terms of delay and Doppler parameters. There are recurring components of false targets and noise in the environment and radar receivers that cause disturbance in the radar system to detect the correct targets. Also, the difference in the power of returning signals from different targets also causes errors, and some of the ambiguity cells are mistakenly identified as targets. Other problems in the design of radar systems are the signal transmitted from the radar transmitter, which causes the radar to be detected and attacked by the targets. That's why today there are radars that, because they do not have a dedicated transmitter to send signals from the transmitters in the environment, are using a radar and are hardly under electronic warfare
*Corresponding Author Email: [email protected] (M. Kafi)
[1]. In this radar system, signals from the environment, such as analogue TV signals [2], FM radio [3], GSM [4] and satellite [5], are used. But the problem with this is that, since the signals used in these radars are not designed for radar purposes; they do not always have the proper ambiguity function. In this regard, commercial FM radio signals are one of the good signals, in addition to achieving the proper function, it is reasonable to make the cost of manufacturing such radar [6]. Therefore, due to existing problems, methods have been developed for studying the noise and clutter and multi-path signaling removal. One of the proposed methods is to create a model for the time history of each cell from the ambiguity function and obtain the threshold for that cell, which can be used to determine actual goals among the peaks in the ambiguity function [7-9]. In this paper, a new method for detecting targets from the peaks in ambiguity cells is presented in terms of noise and clutter conditions. In this method, by determining the correct assumption, the attribution of each cell from the ambiguity function to the target, noise or clutter is determined. In the following, the
proposed method and how to form a random signal for each cell by the function of ambiguity is expressed. In the second part, the performance of the proposed method is analyzed by simulating three goals in different conditions, with noise and clutter. Finally, in order to evaluate the performance of the proposed method, the results are compared with the other two methods at the same conditions.
2. PROPOSED METHOD
In this method, the time history of cells of the ambiguity function is used. First, a time series L of the function of ambiguity is considered. In this case, each cell has the following relationships:
𝐿𝑖𝑗𝑡= 𝐿𝑡(𝑖, 𝑗) 1 ≤ 𝑖 ≤ 𝐼 , 1 ≤ 𝑗 ≤ 𝐽 , 1 ≤ 𝑡 ≤ 𝑇 (1)
where, L_ijt is the domain of the i-th cell and the j-column in the t frame. It should be noted that the dimensions of the ambiguity function are I × J and T is the total number of frames. If we consider the time period of each cell in a time interval between the frames t and t + n + m:
𝑎(𝑙) = {𝐿(𝑡+𝑛)𝑖𝑗} = {𝐿𝑖𝑗𝑡, 𝐿𝑖𝑗(𝑡+1), … , 𝐿𝑖𝑗(𝑡+𝑛)} 𝑏(𝑙) = {𝐿(𝑡+𝑚+𝑛)𝑖𝑗} = {𝐿𝑖𝑗(𝑡+𝑚), 𝐿𝑖𝑗(𝑡+𝑚+1), … , 𝐿𝑖𝑗(𝑡+𝑚+𝑛)}
(2)
where, l is counter of the members of the two sets are a and b and both have n + 1 members. In this case, assuming m<n, it is clear that the above strings contain t + n members and m are different members. Accordingly, we define the dependence of the cell L(t + m
+ n) ij on the clutter and the noise with H0 and the
dependence of the cell on the target with H1.
𝐻0: 𝐿(𝑡+𝑚+𝑛)𝑖𝑗= |𝑐(𝑡+𝑚+𝑛)𝑖𝑗+ 𝑛(𝑡+𝑚+𝑛)𝑖𝑗| 𝐻1: 𝐿(𝑡+𝑚+𝑛)𝑖𝑗= |𝑔(𝑡+𝑚+𝑛)𝑖𝑗+ 𝑐(𝑡+𝑚+𝑛)𝑖𝑗+ 𝑛(𝑡+𝑚+𝑛)𝑖𝑗|
(3)
In the above equation, g represents the target, c represents the ambient clutter and n represents the sum of the noise in the L cell. In order to simplify these two sequences, we use a FIR finite element filtering technique. In this case, if we define the vector of the weights of this filter as follows:
𝛼
= [𝛼(−𝛽), … , 𝛼(0), … , 𝛼(𝛽)] (4)
The output of this filter, which is the same as the estimate b(𝑙), will be:
ˆ( ) ( ) ( )
r
b l r a l r
(5)In this case, the error between the actual and estimated values for b(𝑙) is defined as the error vector e = [e (1), e (2), ..., e (l), ..., e (t + n) Which is obtained as follows:
( ) ( ) ( ) ( )
r
e l b l r a l r
(6)As can be seen, if the value of α is well estimated, the error value is minimized. For this purpose, the Correntropy Cost Function has been used as a cost function for adaptive adaptation in the desired filter weights.
2
2
1
[ ] exp
2 2
x
C x E
(7)
With the (t + n) pair of samples a(𝑙) and b(𝑙) from Equation (2), the Correntropy vector of the error vector is estimated as follows:
2
2 1
1 1 ( )
ˆ[ ] exp
2 2 2
t k l e l C e t k
(8)By inserting the error section from Equation (6) into Equation (8), the relationship between the estimated cost function and the FIR filter weights is obtained as follows:
2 1
( ) ( ) ( )
1 1
ˆ[ ] exp
2 2 2
t k
r l
b l r a l r
C t k
(9)At the end, the value obtained for the estimated cost function determines that the cell L(t + m + n) ij is the only
strong combination of noise and clutter H0 (Equation
(10)) or is probably part of a real target that should be investigated at a later stage.
𝑟𝑒𝑗𝑒𝑐𝑡 (𝐻1) ≜ 𝐻0 : 𝑀𝑎𝑥 {𝐶̂[𝛼]} ≥ 𝛾
.
⇒
⇒ 𝐿(𝑡+𝑚+𝑛)𝑖𝑗=
|𝑔(𝑡+𝑚+𝑛)𝑖𝑗+ 𝑐(𝑡+𝑚+𝑛)𝑖𝑗+ 𝑛(𝑡+𝑚+𝑛)𝑖𝑗| (10)
𝐷𝑜 𝑛𝑜𝑡 𝑟𝑒𝑗𝑒𝑐𝑡 (𝐻1): 𝑜𝑡ℎ𝑒𝑟𝑤𝑖𝑠𝑒
Therefore, any cell that has succeeded in passing this criterion will be identified as the candidate for the existence of the target in those points. Now, in the second step, the real goals of the existing candidates must be identified. For this purpose, two different threshold values for the two neighborhoods of 3 × 3 and 5 × 5 are selected for the previous frame and the two frames before the desired frame. In this case, the cell that crosses both ends will be identified as part of a real target.
TABLE 1. Simulated tracks for three targets
Value Parameter value Parameter
52625
Number of simulated frames
%30
Maximumdiffrence betweenamplitude ofseveral targets in a
AF T1=0.23
T2=0.13 T3=0.24
Average change of delay per
frame
T1=1.32 T2=0.74 T3=0.93
Average change of Doppler per frame
2,-10 SCNR bound Delay=±3 Doppler=±3
Width of the peakof each target in AF delay and Doppler
Figure 1. Curve showing the objectives
Figure 2. Number of targets
Each frame of Figure 2 has an ambiguity function, which, in addition to the target, includes noise and clutter, and the objects in the frame are detected by the processing of this function.
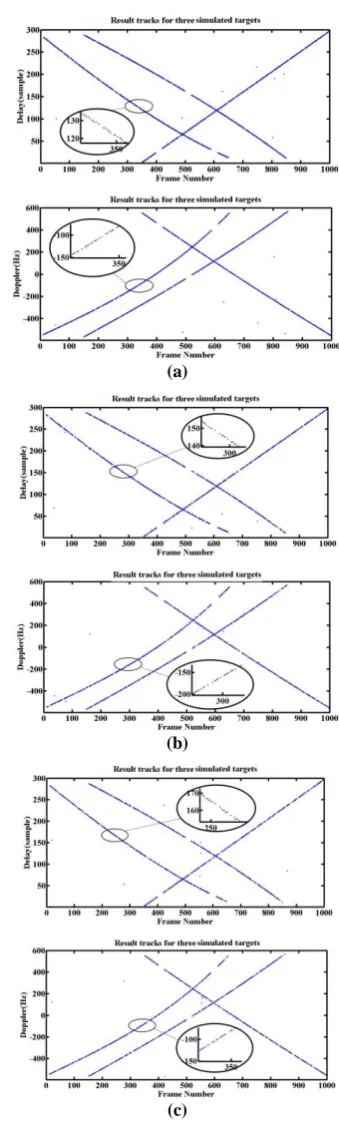
2. 2. Results Figures (3a), (3b) and (3c) are the simulated targets in Figure 1, which are detected by the proposed detector method, respectively, in -2, -4, and -6 dB.
(a)
(b)
(c)
Figure 3. Result tracks for three simulated targets
be Gets as the wrong warning. In the signal-to-noise ratio (-2 dB), the results of this method (Figure 3a) show that the number of peaks that are correctly detected is 1283 peaks of the total simulation peaks of 1509. Also, seven peaks have been mistakenly revealed. These results for the -4dB are 1086 and 7, respectively (Figure 3b), and for SCNR of -6dB, respectively, 1026 and 7 respectively (Figure 3c).
To further evaluate the performance of this method, simulations were performed in different SCNRs, and in each simulation the results were recorded and compared; using the two criteria for PD detection
probability and the Pfa false alarm probability, exposure
values and main simulation values are compared. The results obtained from these comparisons are shown in Figure 4.
3. CONCLUSION
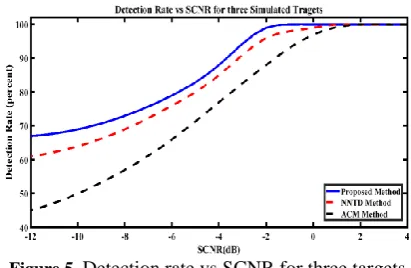
Based on the results obtained, this method has the ability to detect targets for SCNRs of up to -10 dB for all three values of the probability of false alarms. In addition, in order to better evaluate the performance of this method, the results of the detection of targets with the specifications listed in Table 1 for the proposed method and the two methods of NNTD are obtained in reference [8] and the ACM method in reference [10] and compared with each other ( Figure 5).
It should be noted that the graphs obtained for the probability of error warning 10-5 were obtained. As
shown in Figure 5, the proposed method has a much better performance than the ACM method, especially for negative SCNRs. Accordingly, for a -12dB SCNR, the probability of detection for the proposed method is 22% higher than the ACM method and 6% higher than the NNTD method.
Figure 4. Detection rate vs SCNR
Figure 5. Detection rate vs SCNR for three targets
It also shows that for SCNRs larger than zero dB, this method has a 100% detection capability.
4. REFERENCES
1. Zaimbashi, A., Sheikhi, A. and Derakhtian, M., "Evaluation of detection performance of passive bistatic radar detectors based on commercial fm radio signals", Vol. 1, No. 2, (2014), 23-34. 2. Howland, P., "Target tracking using television-based bistatic
radar", IEE Proceedings-Radar, Sonar and Navigation, Vol. 146, No. 3, (1999), 166-174.
3. Howland, P.E., Maksimiuk, D. and Reitsma, G., "Fm radio based bistatic radar", IEE Proceedings-Radar, Sonar and Navigation, Vol. 152, No. 3, (2005), 107-115.
4. Tan, D.K., Sun, H., Lu, Y., Lesturgie, M. and Chan, H.L., "Passive radar using global system for mobile communication signal: Theory, implementation and measurements", IEE Proceedings-Radar, Sonar and Navigation, Vol. 152, No. 3, (2005), 116-123.
5. Cherniakov, M., "Space-surface bistatic synthetic aperture radar-prospective and problems", International Radar Conference, (2002), 22-25.
6. Colone, F., O'hagan, D., Lombardo, P. and Baker, C., "A multistage processing algorithm for disturbance removal and target detection in passive bistatic radar", IEEE Transactions on Aerospace and Electronic Systems, Vol. 45, No. 2, (2009), 698-722.
7. Zaimbashi, A., Derakhtian, M. and Sheikhi, A., "Glrt-based cfar detection in passive bistatic radar", IEEE Transactions on Aerospace and Electronic Systems, Vol. 49, No. 1, (2013), 134-159.
8. Shojaedini, S.V., "A new method for joint estimation of delay and doppler from ambiguity function: Combination of stochastic process and spatial processing for noise and clutter suppression",
International Journal of Electronics, Vol. 101, No. 4, (2014), 569-583.
9. Musicki, D., Suvorova, S., Morelande, M. and Moran, B., "Clutter map and target tracking", in Information Fusion, 2005 8th International Conference on, IEEE. Vol. 1, (2005), doi:
A Novel Method for Detecting Targets on Inactive Radars Using an
Adaptive Processing on the Ambiguity Function
RESEARCH NOTE
M. Kafi, J. Ranjbar, J. Khalilpour, S. Zarezade
Department of Electrical and Computer Engineering, Khatam Al Anbia University, Tehran, Iran
P A P E R I N F O
Paper history:
Received 10 November 2017
Received in revised form 23 December 2017 Accepted 04 Januray 2018
Keywords: Bistatic Passive Radar Ambiguity Function Delay
Doppler Noise
هدیکچ
هقباس زا شور نیا رد .تسا هدش هئارا لاعف ریغ یاهرادار رد فادها یزاسراکشآ و ییاسانش روظنم هب دیدج شور کی هلاقم نیا رد ص هب اه لولس ینامز هقباس ادتبا روظنم نیا یارب .تسا هدش هدافتسا یزاسراکشآ یارب ماهبا عبات یاه لولس ینامز یفداصت هتشر کی ترو
زیون هب طوبرم ینامز یاه هتشر زا رظن دروم فادها هب طوبرم ینامز یاه هتشر یقفو رتلیف کی زا هدافتسا اب سپس .دوش یم هتفرگ رظن رد لماش یطیحم یارب یداهنشیپ شور درکلمع یسررب روظنم هب .دوش یم ادج طیحم رد دوجوم رتلاک و
3
یاه تعرس و لصاوف اب فده
تم نیا دهد یم ناشن هدمآ تسدب جیاتن .تسا هدش هسیاقم ناسکی طیارش رد رگید شور ود اب نآ زا لصاح جیاتن و یزاس هیبش تواف
دودح رد یزاس راکشآ دصرد رظن زا شور
5
/
12
شور رگید هب تبسن دصرد
ACM
دودح رد و
8
شور هب تبسن دصرد
NNTD
دراد یرتهب درکلمع
.